Persons using assistive technology might not be able to fully access information in this file. For assistance, please send e-mail to: mmwrq@cdc.gov. Type 508 Accommodation and the title of the report in the subject line of e-mail.
Prevalence of Coronary Heart Disease --- United States, 2006--2010
Age-adjusted mortality rates for coronary heart disease (CHD) have declined steadily in the United States since the 1960s (1). Multiple factors likely have contributed to this decline in CHD deaths, including greater control of risk factors, resulting in declining incidence of CHD, and improved treatment (2). Greater control of risk factors and declining incidence can reduce CHD prevalence, whereas improved treatment that results in lower mortality rates and more persons living with CHD can increase prevalence. To estimate state-specific CHD prevalence and recent trends by age, sex, race/ethnicity, and education, CDC analyzed data from Behavioral Risk Factor Surveillance System (BRFSS) surveys for the period 2006--2010. This report summarizes the results of that analysis, which determined that, although self-reported CHD prevalence declined overall, substantial differences in prevalence existed by age, sex, race/ethnicity, education, and state of residence. These data can enable state and national health agencies to monitor CHD prevalence as a measure of progress toward meeting the Healthy People 2020 objective to reduce the U.S. rate of CHD deaths 20% from the 2007 baseline (3).
BRFSS is a state-based, random-digit--dialed telephone survey of the U.S. civilian, noninstitutionalized population aged ≥18 years (4). The survey is administered in all 50 states, the District of Columbia (DC), and the U.S. territories of Guam, Puerto Rico, and the U.S. Virgin Islands. Since 2005, BRFSS has included two questions related to coronary heart disease: "Has a doctor, nurse, or other health professional ever told you that you had angina or coronary heart disease?" and "Has a doctor, nurse, or other health professional ever told you that you had a heart attack, also called a myocardial infarction?" Participants who answered "yes" to either of the questions were defined as having self-reported CHD. Those who answered "no" to both questions were defined as not having CHD. Those who answered "don't know," refused to answer the questions, or for whom responses were missing were excluded.
CHD prevalence data were analyzed by age group, sex, education, state, and racial/ethnic population (Hispanic, white, black, Asian or Native Hawaiian/Other Pacific Islander, or American Indian/Alaska Native).* All estimates were weighted to the state population, and analyses were conducted using statistical software to account for the complex sampling design. Age-adjusted prevalence of CHD, standardized to the 2000 U.S. standard population, was estimated for each year during the period 2006--2010. Orthogonal polynomial coefficients, which were calculated recursively, were used to determine the significance of linear trends. The number of BRFSS respondents ranged from 347,790 in 2006 to 444,927 in 2010 for all states. Sample sizes for states (including DC) ranged from 1,964 in Alaska in 2010 to 39,549 in Florida in 2007. Median BRFSS response rate during 2006--2010 was 52.3%.
From 2006 to 2010, age-adjusted CHD prevalence in the United States declined overall from 6.7% to 6.0% (Table 1). Similar declines were observed across age group, sex, and education categories. Among racial/ethnic populations, declines from 2006 to 2010 were observed among whites (6.4% to 5.8%) and Hispanics (6.9% to 6.1%) (Table 1).
In 2010, the prevalence of CHD was greatest among persons aged ≥65 years (19.8%), followed by those aged 45--64 years (7.1%) and those aged 18--44 years (1.2%). CHD prevalence was greater among men (7.8%) than women (4.6%), and among those with less than a high school education (9.2%), compared with high school graduates (6.7%), those with some college (6.2%), and those with more than a college degree (4.6%) (Table 1). Among racial/ethnic populations, CHD prevalence was greatest among American Indians/Alaska Natives (11.6%), followed by blacks (6.5%), Hispanics (6.1%), whites (5.8%), and Asians or Native Hawaiians/Other Pacific Islanders (3.9%). By race and sex in 2010, the greatest male prevalences were among American Indian/Alaska Natives (14.3%) and whites (7.7%), and the greatest females prevalences were among American Indian/Alaska Natives (8.4%) and blacks (5.9%) (Table 1).
By state, from 2006 to 2010, the greatest statistically significant linear declines in age-adjusted CHD prevalence were 23.1% in West Virginia (from 10.4% to 8.0%) and 22.1% in Missouri (from 7.7% to 6.0%) (Table 2). Although five states showed an increase in CHD prevalence from 2006 to 2010, none of the five showed a statistically significant linear increase. In 2010, CHD prevalence ranged from 3.7% in Hawaii and 3.8% in DC to 8.0% in West Virginia and 8.2% in Kentucky, with the greatest regional prevalences generally observed in the South (Figure).
Reported by
Jing Fang, MD, Kate M. Shaw, MS, Nora L. Keenan, PhD, Div for Heart Disease and Stroke Prevention, National Center for Chronic Disease Prevention and Health Promotion. Corresponding contributor: Jing Fang, jfang@cdc.gov, 770-488-5142.
Editorial Note
During the past half century, the CHD mortality rate has declined continuously (1); a Healthy People 2020 objective is to lower the death rate 20%, from a baseline of 126.0 per 100,000 population in 2007 to 100.8. The decline in the mortality rate suggests that more persons are living with CHD, which should result in an increase in the prevalence of CHD, not a decrease as described in this report. However, the decline in prevalence in this report was affected not only by CHD mortality but also by CHD incidence, which is decreased by the prevention and control of CHD risk factors. Given that CHD mortality is declining, the observed decline in prevalence of CHD in this study suggests that CHD incidence also has declined. Although no national-level surveillance of CHD incidence is conducted in the United States, a decline in CHD incidence from 1980 to 1992 was observed in a population-based study (5). Additionally, a 2007 report attributed 47% of the decline in CHD mortality to improvements in treatment and 44% to a reduction in risk factors (6). Because improvements in treatment would tend to increase CHD prevalence, the decline in prevalence is consistent with the reported decline in the prevalence of a population at high risk (i.e., persons with uncontrolled hypertension, uncontrolled high levels of low-density lipoprotein cholesterol, and current smokers), as noted in the recent report on the U.S. Department of Health and Human Services Million Hearts initiative (7).
This report estimates a national CHD prevalence of 6.0%. In 2007, CDC estimated the national prevalence of CHD at 6.5%, based on data from the 2005 BRFSS survey (8). Since 2005, the prevalence of self-reported CHD has shown a significant decline. In the only other recent report estimating CHD prevalence, data from the 2005--2008 National Health and Nutrition Examination Survey were used to calculate an estimate of 7.0%, slightly greater than the BRFSS estimates but including a slightly older population: U.S. adults aged ≥20 years (9).
This report is subject to at least six limitations. First, BRFSS is a telephone survey that excludes persons living in institutions, nursing homes, long-term care facilities, and correctional institutions, and results might not be applicable to these populations. Second, the 52.3% median response rate might further limit generalizability of the findings, if the sociodemographics of nonrespondents differed from respondents. Third, these BRFSS surveys included only persons with landline telephones. The increasing number of households with cellular telephones only might make BRFSS increasingly less representative of the general U.S. adult population. Fourth, BRFSS is conducted in English and Spanish and excludes persons who cannot speak either one of those languages. Fifth, BRFSS data are self-reported and subject to recall bias and social desirability effects. However, should bias exist, no evidence suggests that it would confound trend estimates by fluctuating from year to year. Finally, no data were collected regarding CHD incidence, which might have shown its effect on the finding for CHD prevalence.
The CDC National Heart Disease and Stroke Prevention Program funds 41 states and DC, with a focus on developing and sustaining population-based strategies that target an identified area of a state or segment of the population (10). The goal of the program is to increase state capacity to address the issues related to control and prevention of heart disease, stroke, and related risk factors (e.g., hypertension and high levels of low-density lipoprotein cholesterol). Examples of preventive interventions include the enhancement of clinical-based management of treatment for hypertension and high cholesterol and the promotion of patient use of home blood pressure monitoring. The data from this report can help health planners develop more targeted prevention programs for states and populations with greater CHD prevalence (e.g., American Indian/Alaska Native men and black women). Development of effective prevention programs targeting populations with greater CHD prevalence should reduce risk factors and CHD incidence, which will continue the decline in both CHD prevalence and CHD deaths.
References
- Xu JQ, Kochanek KD, Murphy SL, Tejada-Vera B. Deaths: final data for 2007. Natl Vital Stat Rep 2009;58(19).
- Wijeysundera HC, Machado M, Farahati F, et al. Association of temporal trends in risk factors and treatment uptake with coronary heart disease mortality, 1994--2005. JAMA 2010;303:1841--7.
- US Department of Health and Human Services. HDS-2: Reduce coronary heart disease deaths. Healthy People 2020. Washington, DC: US Department of Health and Human Services; 2011. Available at http://www.healthypeople.gov/hp2020. Accessed October 7, 2011.
- CDC. Behavioral Risk Factor Surveillance System. Available at http://www.cdc.gov/brfss. Accessed October 7, 2011.
- Hu FB, Stampfer MJ, Manson JE, et al. Trends in the incidence of coronary heart disease and changes in diet and lifestyle in women. N Engl J Med 2000;343:530--7.
- Ford ES, Ajani UA, Croft JB, et al. Explaining the decrease in U.S. deaths from coronary disease, 1980--2000. N Engl J Med 2007;356:2388--98.
- CDC. Million Hearts: strategies to reduce the prevalence of leading cardiovascular disease risk factors---United States, 2011. MMWR 2011;60:1248--51.
- CDC. Prevalence of heart disease---United States, 2005. MMWR 2007;56:113--8.
- Roger VL, Go AS, Lloyd-Jones DM, et al. Heart disease and stroke statistics---2011 update: a report from the American Heart Association. Circulation 2011;123:e18--209.
- CDC. National Heart Disease and Stroke Prevention Program. Atlanta, GA: US Department of Health and Human Services, CDC; 2011. Available at http://www.cdc.gov/dhdsp/programs/nhdsp_program/index.htm. Accessed October 7, 2011.
* All respondents categorized by race were non-Hispanic. Hispanic respondents might be of any race.
What is already known on this topic?
The 2005 Behavioral Risk Factor Surveillance System survey found a prevalence of coronary heart disease (CHD) in the United States of 6.5% among adults aged ≥18 years and certain disparities in prevalence by sex, race, education, and state of residence.
What is added by this report?
From 2006 to 2010, CHD prevalence overall in the United States decreased from 6.7% to 6.0%. Prevalence varied substantially by sex (men, 7.8%, versus women, 4.6%), race (American Indians/Alaska Natives, 11.6%, versus Asians or Native Hawaiians/Other Pacific Islanders, 3.9%), education (those with less than a high school education, 9.2%, versus those with more than a college degree, 4.6%), and state of residence, with prevalence generally greater in the South, the highest in Kentucky (8.2%) and the lowest in Hawaii (3.7%).
What are the implications for public health practice?
Prevention programs can be targeted at the states and populations with the greatest prevalence of CHD to meet the Healthy People 2020 objective of reducing the U.S. CHD death rate by 20%.
FIGURE. Age-adjusted prevalence of coronary heart disease among adults --- Behavioral Risk Factor Surveillance System, United States, 2010
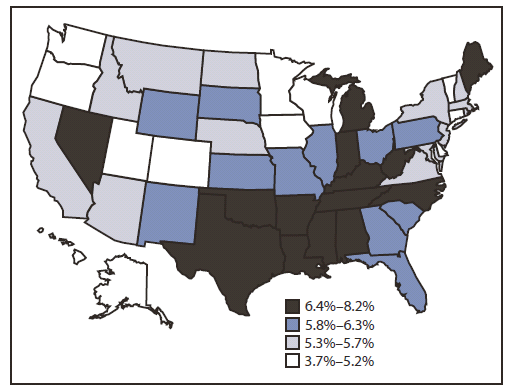
Alternate Text: The figure above is a U.S. map showing age-adjusted prevalence of coronary heart disease among adults in the United States during 2010, according to the Behavioral Risk Factor Surveillance System. By state, age-adjusted CHD prevalence in 2010 ranged from 3.7% in Hawaii and 3.8% in DC to 8.0% in West Virginia and 8.2% in Kentucky, with the greatest regional prevalences generally observed in the South.
Use of trade names and commercial sources is for identification only and does not imply endorsement by the U.S. Department of
Health and Human Services.
References to non-CDC sites on the Internet are
provided as a service to MMWR readers and do not constitute or imply
endorsement of these organizations or their programs by CDC or the U.S.
Department of Health and Human Services. CDC is not responsible for the content
of pages found at these sites. URL addresses listed in MMWR were current as of
the date of publication.
All MMWR HTML versions of articles are electronic conversions from typeset documents.
This conversion might result in character translation or format errors in the HTML version.
Users are referred to the electronic PDF version (http://www.cdc.gov/mmwr)
and/or the original MMWR paper copy for printable versions of official text, figures, and tables.
An original paper copy of this issue can be obtained from the Superintendent of Documents, U.S.
Government Printing Office (GPO), Washington, DC 20402-9371;
telephone: (202) 512-1800. Contact GPO for current prices.
**Questions or messages regarding errors in formatting should be addressed to
mmwrq@cdc.gov.
