FIGURE 1. Number of self-reported episodes of alcohol-impaired driving among adults --- Behavioral Risk Factor Surveillance System, United States, 1993--2010
Persons using assistive technology might not be able to fully access information in this file. For assistance, please send e-mail to: mmwrq@cdc.gov. Type 508 Accommodation and the title of the report in the subject line of e-mail.
Vital Signs: Alcohol-Impaired Driving Among Adults --- United States, 2010
On October 4, 2011, this report was posted as an MMWR Early Release on the MMWR website (http://www.cdc.gov/mmwr).
Abstract
Background: Alcohol-impaired driving crashes account for nearly 11,000 crash fatalities, or about one third of all crash fatalities in the United States.
Methods: CDC analyzed data from the 2010 Behavioral Risk Factor Surveillance System survey to obtain the prevalence, episodes, and rates of alcohol-impaired driving (defined as driving "when you've had perhaps too much to drink" in the past 30 days) among U.S. adults aged ≥18 years who responded to the survey by landline telephone.
Results: In 2010, an estimated 4 million U.S. adult respondents reported at least one episode of alcohol-impaired driving, for an estimated total of approximately 112 million alcohol-impaired driving episodes or 479 episodes per 1,000 adult population. From a peak in 2006, such episodes decreased 30% through 2010. Men accounted for 81% of all episodes with young men aged 21--34 years accounting for 32% of all episodes. Additionally, 85% of alcohol-impaired driving episodes were reported by persons who also reported binge drinking, and the 4.5% of the adult population who reported binge drinking at least four times per month accounted for 55% of all alcohol-impaired driving episodes. Episode rates were nearly four times higher among persons who reported not always wearing seatbelts compared with persons who reported always wearing seatbelts.
Conclusions: Rates of self-reported alcohol-impaired driving have declined substantially in recent years. However, rates remain disproportionally high among young men, binge drinkers, and those who do not always wear a seat belt.
Implications for Public Health: States and communities should continue current evidence-based strategies, such as sobriety checkpoints and enforcement of 0.08 g/dL blood alcohol concentration laws to deter the public from driving while impaired. Additionally, all states should consider requiring ignition interlocks on the vehicles of all persons convicted of alcohol-impaired driving. States without primary seatbelt laws should consider enacting them to reduce fatalities in alcohol-impaired driving crashes.
Introduction
Approximately one third of all motor vehicle crash fatalities involve alcohol-impaired driving. In 2009, a total of 10,839 persons died in crashes in which at least one driver had a blood alcohol concentration (BAC) of ≥0.08 g/dL, the illegal level for adult drivers in the United States (1). A 0.08 g/dL BAC corresponds to four drinks in 1 hour for a 160-pound (73 kg) man and three drinks in 2 hours for a 120-pound (55 kg) woman (2).
Methods
For this report, CDC used data from the 2010 Behavioral Risk Factor Surveillance System (BRFSS) survey to provide estimates of the prevalence, episodes, and rates of alcohol-impaired driving among adults aged ≥18 years by selected characteristics, state, and Census region. BRFSS is a state-based, landline, random-digit--dialed telephone survey that collects information on health-related behaviors from a representative sample of civilian, noninstitutionalized adults aged ≥18 years. Data from the 2010 BRFSS survey included all 50 states and the District of Columbia (DC). The median Council of American Survey and Research Organizations (CASRO) response rate for the 2010 BRFSS survey was 55% (3).
One question on alcohol-impaired driving is included periodically on the BRFSS survey of each state. Respondents who report having had at least one alcoholic beverage in the past 30 days are asked, "During the past 30 days, how many times have you driven when you've had perhaps too much to drink?" Annual estimates of alcohol-impaired driving episodes per respondent were calculated by multiplying the reported episodes in the preceding 30 days by 12. These numbers of episodes were summed to obtain state and national estimates of alcohol-impaired driving episodes. Annual rates of alcohol-impaired driving episodes then were calculated by dividing the annual number of alcohol-impaired driving episodes by the respective weighted population estimate from BRFSS for 2010. Annual alcohol-impaired driving episodes for 2004, 2006, and 2008, which had not been described previously, were produced, and estimates of alcohol-impaired driving episodes for the years 1993, 1995, 1997, 1999, and 2002 were obtained from an earlier study (4) and used to report the alcohol-impaired driving trend over time.
Alcohol-impaired driving prevalence in 2010 was stratified by sex and reported by age, race/ethnicity, education level, marital status, household income, number of binge drinking episodes per month, seatbelt use, and Census region. Binge drinking was defined as consuming ≥5 drinks on one occasion for men and consuming ≥4 drinks on one occasion for women. Seat belt use was dichotomized as always wear or less than always wear. All data were weighted according to age-, race/ethnicity-, and sex-specific state population counts and to the respondent's probability of selection to produce population-based estimates. T-tests were used to determine differences between subgroups, with differences considered statistically significant at p<0.05.
Results
In 2010, 1.8% of respondents reported at least one episode of alcohol-impaired driving in the past 30 days. These four million adults reported an estimated 112,116,000 episodes of alcohol-impaired driving in the United States for the year. This is the lowest percentage of drinking drivers and lowest number of episodes reported since 1993, the first year for which published national BRFSS estimates are available. Since the peak in 2006, alcohol-impaired driving episodes have declined 30%, from 161 million to 112 million (Figure 1). Sixty percent of those who reported driving while impaired indicated one episode in the past 30 days; however, some respondents reported that they drove while impaired daily. Men accounted for 81% of 2010 alcohol-impaired driving episodes. Young men aged 21--34 years, who represented 11% of the U.S. adult population, reported 32% of all 2010 episodes.
Binge drinking was strongly associated with alcohol-impaired driving; 85% of all alcohol-impaired driving episodes were reported by persons who also reported binge drinking. Frequent binge drinkers contributed disproportionately to the alcohol-impaired driving rates; the 4.5% of the adult population who reported binge drinking ≥4 times per month accounted for 55% of all alcohol-impaired driving episodes (Table 1).
Persons who reported not always using seatbelts had alcohol-impaired driving rates nearly four times higher than persons who reported always using seatbelts. Among respondents who reported driving while impaired, seatbelt use varied significantly by the type of state seatbelt law in effect; 76% of persons living in states with a primary seatbelt law (which allows police to stop drivers and ticket them solely because occupants are unbelted) reported always wearing a seatbelt, whereas 58% of their counterparts living in states with a secondary law (which only allows police to issue seat belt tickets if drivers were stopped from some other violation) or no seatbelt law (New Hampshire) reported always wearing a seatbelt.
The Midwest Census region had the highest annual rate of alcohol-impaired driving episodes at 643 per 1,000 population, which was significantly higher than the rates in all other regions (Figure 2). Excluding 12 states and DC with small sample sizes and potentially unstable rates, four of the seven states with rates of alcohol-impaired driving that were significantly higher than the U.S. rate overall were in the Midwest (Table 2). The Midwest also had the highest prevalence of binge drinking at 16.5%, which was significantly higher than the prevalence in the Northeast (15.1%), West (14.3%), or South (12.6%).
Conclusions and Comment
Since 2006, self-reported alcohol-impaired driving episodes have declined 30%, reaching a low of an estimated 112 million episodes in 2010. Neither self-reported alcohol consumption nor binge drinking in the past 30 days, as reported by BRFSS, declined significantly over this period. Reasons for the decline in alcohol-impaired driving are not well understood, but possible factors include less discretionary driving as a result of the current economic downturn (5) and possible changes in drinking location to places where driving is not required such as at home (6).
Alcohol-impaired driving fatalities declined 20% from 13,491 to 10,839 from 2006 to 2009, the most recent year for which fatality data are available (7). However, the proportion of all motor vehicle fatalities that involve at least one alcohol-impaired driver has remained stable at about 33%, because non-alcohol-impaired driving fatalities have declined at the same rate as alcohol-impaired fatalities (7). This study indicated that alcohol-impaired driving rates remain disproportionally high among young men, binge drinkers, persons who do not always wear a seatbelt, and persons living in the Midwest.
Effective strategies to reduce alcohol-impaired driving are underutilized in the United States (8). Examples include sobriety checkpoints, enforcement of 0.08 BAC laws and minimum legal drinking age laws, multicomponent community-based programs, and ignition interlock programs for all convicted alcohol-impaired driving offenders (9). Given the strong association between binge drinking and alcohol-impaired driving, programs to reduce alcohol impaired driving should consider adding effective strategies to reduce excessive drinking. These strategies include increasing alcohol taxes, regulating alcohol outlet density, and dram shop liability laws, which hold alcohol retailers (both on premises and off premises) legally responsible for harms caused by serving alcohol to minors or visibly intoxicated patrons (10).
Two thirds of all fatalities in alcohol-impaired driving crashes in the United States occur among alcohol-impaired drivers themselves (1). In 2009, seatbelt status was known for 93% of fatally injured alcohol-impaired passenger vehicle drivers; of those drivers, 72% were unbelted. In the states with secondary seatbelt laws, 81% of fatally injured alcohol-impaired passenger vehicle drivers were unbelted (Tonja Lindsey, National Highway Traffic Safety Administration, personal communication, 2011). In this report, always using seatbelts was 18 percentage points higher among alcohol-impaired drivers in states with primary seatbelt laws compared with those from states with secondary laws. This finding is important because seatbelts are 48%--61% effective in preventing driver fatalities in crashes (11).
The findings in this report confirm those from the most recent National Roadside Survey, which in 2007 found that only a small percentage of adult drivers are alcohol-impaired. That survey showed that 2.2% of drivers on the road on Friday afternoon or Friday or Saturday night had a BAC of ≥0.08 g/dL (12). Additionally, the findings in this report are consistent with alcohol-impaired driving fatality data. Men accounted for 81% of all alcohol-impaired driving episodes in 2010 and 82% of all alcohol-impaired drivers involved in fatal crashes in 2009 (1). Likewise, men aged 21--34 accounted for 32% of alcohol-impaired driving episodes and 35% of all alcohol-impaired drivers involved in fatal crashes (Tonja Lindsey, National Highway Traffic Safety Administration, personal communication, 2011).
The findings in this report are subject to at least seven limitations. First, BRFSS surveys only those aged ≥18 years, so alcohol-impaired driving episodes of younger drivers are not included, which underestimates episodes. Second, an increasing proportion of adults use wireless telephones exclusively; as of the second half of 2010, 28% of adults lived in wireless-only households (13). These adults are younger and report a higher prevalence of binge drinking compared with adults with landline phones (14). Given the association among binge drinking, younger persons, and alcohol-impaired driving, omitting wireless-only households likely results in underestimating alcohol-impaired driving episodes. Third, a social stigma is attached to alcohol-impaired driving; therefore, self-reports might be spuriously low. Fourth, self-reported alcohol-impaired driving as defined by the BRFSS survey cannot be equated to a specific BAC; however 85% of alcohol-impaired driving episodes were reported by persons who also reported binge drinking. Fifth, the alcohol-impaired driving prevalence estimates for 12 states and DC were potentially unstable because of small sample sizes and/or high relative standard errors. Therefore, this report included only the stable state estimates. Sixth, this report uses one month self-reported estimates of alcohol-impaired driving to calculate an annual estimate. However, BRFSS is administered year-round, eliminating potential bias from seasonal fluctuations in alcohol-impaired driving. Additionally, using a 5-week recall period to estimate injuries has been found to result in a more accurate estimate than longer recall periods (15). Finally, the CASRO response rate for the 2010 BRFSS was only 55%, which increases the risk for response bias; although the large sample size might decrease this risk.
Public support for preventing alcohol-impaired driving is strong. For example, 75% of respondents in a recent Department of Transportation survey endorsed weekly or monthly sobriety checkpoints; only 6% believed that sobriety checkpoints should not be used at all (16). However, sobriety checkpoints are not conducted in 12 states and are conducted at intervals varying from weekly to a few times a year in the remaining 38 states and DC (17). An estimated 1,500 to 3,000 lives might be saved annually through widespread use of frequent sobriety checkpoints (18), which produce an estimated $6.80 in total benefits (i.e., reductions in medical costs, work loss, and lost quality of life) for each $1.00 spent (19). Public support for ignition interlock programs is also strong. These programs install ignition interlock devices in the vehicles of persons convicted of alcohol-impaired driving to prevent them from operating the vehicle if they have been drinking. In a recent survey, 90% of respondents supported requiring ignition interlocks for drivers with multiple alcohol-impaired driving convictions, and 69% supported this requirement for drivers upon their first conviction (20). Historically, ignition interlock programs have targeted persons with multiple alcohol-impaired driving convictions. As of August 2011, 14 states had passed legislation requiring or strongly encouraging use of ignition interlocks for persons upon their first alcohol-impaired driving conviction (21). Ignition interlocks reduce alcohol-impaired driving rearrest rates by a median 67% while installed (9) and are estimated to result in a 6.6 benefit:cost ratio (19); however, only about 20% of eligible offenders currently are enrolled in ignition interlock programs (9,22).
In recent decades, the United States has lagged behind most other high-income countries in reducing the rate of motor vehicle crash deaths (18). Because alcohol-impaired driving crashes account for about one third of all crash fatalities, any successful strategy for reducing overall crash deaths must address alcohol-impaired driving. To decrease alcohol-impaired driving, states and communities should consider expanding use of sobriety checkpoints, strictly enforcing 0.08 BAC laws and minimum legal drinking age laws, and requiring ignition interlocks for all persons convicted of alcohol-impaired driving, whether it is their first offense or a subsequent offense. To reduce the excessive drinking associated with alcohol-impaired driving, states and communities should consider increasing alcohol taxes, regulating alcohol outlet density, and enacting dram shop liability laws. States without primary seatbelt laws should consider enacting them to help reduce fatalities in alcohol-impaired driving crashes.
Reported by
Gwen Bergen, PhD, Ruth A. Shults, PhD, Rose Ann Rudd, MSPH, Div of Unintentional Injury Prevention, National Center for Injury Prevention and Control, CDC. Corresponding contributor: Gwen Bergen, gbergen@cdc.gov, 770-488-1394.
Acknowledgment
Tonja Lindsey, National Highway Traffic Safety Administration, Washington, DC.
References
- National Highway Traffic Safety Administration. Traffic safety facts 2009: alcohol-impaired driving. Washington, DC: US Department of Transportation, National Highway Traffic Safety Administration; 2010. Available at http://www-nrd.nhtsa.dot.gov/pubs/811385.pdf. Accessed July 20, 2011.
- Miller WR, Munoz RF. How to control your drinking. Albuquerque, NM: University of Mexico Press; 1982:8--11.
- Behavioral Risk Factor Surveillance System. 2010 Summary data quality report. May 2011. Available at ftp://ftp.cdc.gov/pub/data/brfss/2010_summary_data_quality_report.pdf. Accessed August 2, 2011.
- Quinlan KP, Brewer RD, Siegel P, et al. Alcohol-impaired driving among U.S. adults, 1993--2002. Am J Prev Med 2005:28;4:346--50.
- Sivak M, Schoettle B. Toward understanding the recent large reductions in U.S. road fatalities. Traffic Inj Prev 2010;11:561--6.
- Evans L. Do increases in the cost of fuel reduce traffic fatalities? October 2008. Available at http://scienceservingsociety.com/p/X/07.htm. Accessed August 12, 2011.
- National Highway Traffic Safety Administration. Traffic safety facts 2009: a compilation of motor vehicle crash data from the Fatality Analysis Reporting System and the General Estimates System. Early edition. Washington, DC: US Department of Transportation, National Highway Traffic Safety Administration; 2010. Available at http://www-nrd.nhtsa.dot.gov/pubs/811385.pdf. Accessed July 20, 2011.
- Williams AF. Alcohol-impaired driving and its consequences in the United States: the past 25 years. J Safety Res 2006;37:123--38.
- The Task Force on Community Preventive Services. Motor vehicle-related injury prevention: reducing alcohol-impaired driving. Atlanta, GA: Task Force on Community Preventive Services; 2011. Available at http://www.thecommunityguide.org/mvoi/aid/index.html. Accessed August 2, 2011.
- The Task Force on Community Preventive Services. Preventing excessive alcohol consumption. Atlanta, GA: Task Force on Community Preventive Services; 2011. Available at http://www.thecommunityguide.org/alcohol/index.html. Accessed August 2, 2011.
- Kahane C. Fatality reduction by safety belts for front-seat occupants of cars and light trucks, technical report. Washington, DC: National Highway Traffic Safety Administration; 2000. Available at http://www-nrd.nhtsa.dot.gov/pubs/809199.pdf. Accessed August 1, 2011.
- Lacey J, Kelley-Baker T, Furr-Holden D, et al. 2007 National roadside survey of alcohol and drug use by drivers: alcohol results. Washington, DC: National Highway Traffic Safety Administration; 2009. Available at http://www.nhtsa.gov/DOT/NHTSA/Traffic%20Injury%20Control/Articles/Associated%20Files/811248.pdf. Accessed August 2, 2011.
- Blumberg SJ, Luke JV. Wireless substitution: early release of estimates from the National Health Interview Survey, July--December 2010, Hyattsville, MD: National Center for Health Statistics; 2011. Available at http:/www.cdc.gov/nchs/data/nhis/earlyrelease/wireless201106.pdf. Accessed August 1, 2011.
- CDC. Vital signs: binge drinking among high school students and adults---United States, 2009. MMWR 2010;59:1274--9.
- Warner M, Schenker N, Heinen MA, Fingerhut LA. The effects of recall on reporting injury and poisoning episodes in the National Health Interview Survey. Inj Prev 2005;11:282--7.
- Moulton BE, Peterson A, Haddix D, Drew L. National survey of drinking and driving attitudes and behaviors: 2008. Volume II: findings report. Washington, DC: National Highway Traffic Safety Administration; 2010. Available at http://www.nhtsa.gov/staticfiles/nti/pdf/811343.pdf. Accessed August 1, 2011.
- Governors Highway Safety Administration. Sobriety checkpoint laws, August 2011. Available at http://www.statehighwaysafety.org/html/stateinfo/laws/checkpoint_laws.html. Accessed August 29, 2011.
- Transportation Research Board of the National Academies. Achieving traffic safety goals in the United States: lessons from other nations. Special report 300. Washington, DC: Transportation Research Board of the National Academies; 2011. Available at http://onlinepubs.trb.org/onlinepubs/sr/sr300.pdf. Accessed August 3, 2011.
- Children's Safety Network. Injury prevention: what works? A summary of cost-outcome analysis for impaired driving (2010 update). Calverton, MD: Children's Safety Network; 2010. Available at http://www.childrenssafetynetwork.org/publications_resources/pdf/data/injurypreventionwhatworks_impaireddriving.pdf. Accessed August 12, 2011.
- American Automobile Association Foundation for Traffic Safety. 2010 traffic safety culture index. Washington, DC: American Automobile Association Foundation for Traffic Safety; 2010. Available at http://www.aaafoundation.org/pdf/2010tscindexfinalreport.pdf. Accessed August 1, 2011.
- Insurance Institute for Highway Safety. DUI/DWI laws: August 2011. Arlington, VA: Insurance Institute for Highway Safety; 2011. Available at http://www.iihs.org/laws/dui.aspx. Accessed August 12, 2011.
- Marques PR, Voas RB. Key features for ignition interlock programs. Washington, DC: National Highway Traffic Safety Administration. March 2010. Publication No. DOT-HS-811-262. Available at http://www.nhtsa.gov/staticfiles/nti/impaired_driving/pdf/811262.pdf. Accessed August 12, 2011.
|
Key Points |
|
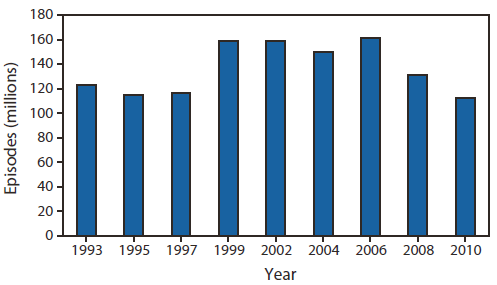
Alternate Text: The figure above shows the number of self-reported episodes of alcohol-impaired driving among adults in the United States from 1993-2010, according to the Behavioral Risk Factor Surveillance System. Since the peak in 2006, alcohol-impaired driving episodes have declined 30%, from 161 million to 112 million.
FIGURE 2. Rates of self-reported alcohol-impaired driving episodes* among adults --- Behavioral Risk Factor Surveillance System, United States, 2010
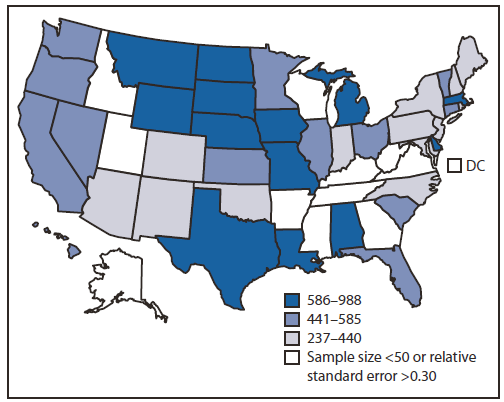
* Per 1,000 population.
Alternate Text: The figure above shows rates of self-reported alcohol-impaired driving episodes among adults in the United States in 2010, according to the Behavioral Risk Factor Surveillance System. The Midwest Census region had the highest annual rate of alcohol-impaired driving episodes at 643 per 1,000 population, which was significantly higher than the rates in all other regions.
Use of trade names and commercial sources is for identification only and does not imply endorsement by the U.S. Department of
Health and Human Services.
References to non-CDC sites on the Internet are
provided as a service to MMWR readers and do not constitute or imply
endorsement of these organizations or their programs by CDC or the U.S.
Department of Health and Human Services. CDC is not responsible for the content
of pages found at these sites. URL addresses listed in MMWR were current as of
the date of publication.
All MMWR HTML versions of articles are electronic conversions from typeset documents.
This conversion might result in character translation or format errors in the HTML version.
Users are referred to the electronic PDF version (http://www.cdc.gov/mmwr)
and/or the original MMWR paper copy for printable versions of official text, figures, and tables.
An original paper copy of this issue can be obtained from the Superintendent of Documents, U.S.
Government Printing Office (GPO), Washington, DC 20402-9371;
telephone: (202) 512-1800. Contact GPO for current prices.
**Questions or messages regarding errors in formatting should be addressed to
mmwrq@cdc.gov.
