Persons using assistive technology might not be able to fully access information in this file. For assistance, please send e-mail to: mmwrq@cdc.gov. Type 508 Accommodation and the title of the report in the subject line of e-mail.
Severe Illness from 2009 Pandemic Influenza A (H1N1) --- Utah, 2009--10 Influenza Season
Influenza-associated hospitalizations have been a reportable condition in Utah since 2005, and surveillance for influenza hospitalizations has been a valuable tool for identifying and tracking the population impact of serious influenza illness. During the 2009 influenza A (H1N1) pandemic, Utah public health officials used comparisons with hospitalization data from three previous influenza seasons to rapidly assess the impact of 2009 H1N1 and enable public health authorities to target persons at greatest risk for severe illness. This report summarizes the results of that assessment, which determined that 1,327 2009 H1N1 hospitalizations were reported, compared with an average of 435 seasonal influenza hospitalizations during three previous influenza seasons, and 25.5% of 2009 H1N1 hospitalizations resulted in severe illness (intensive-care unit [ICU] admission or death), compared with 14.0% of seasonal influenza hospitalizations. In addition, 2009 H1N1 disproportionately affected racial/ethnic minorities, pregnant women, and residents of Salt Lake County (the state's most densely populated county). During the 4-month "spring wave" of the H1N1 pandemic, a greater percentage of hospitalizations (30.9%) resulted in severe illness than during the 9-month "fall wave" (23.0%). Surveillance for influenza hospitalizations can provide essential data to public health authorities that will help them identify those populations at greatest risk for severe illness.
All confirmed and probable influenza-associated hospitalizations* reported by infection-prevention programs and laboratories in the state from April 27, 2009, to May 21, 2010, were analyzed by the Utah Department of Health. Because subtyping data from the Unified State Laboratory: Public Health indicated that 99% of all circulating influenza viruses were 2009 H1N1, all influenza hospitalizations during this period were considered to have resulted from pandemic influenza. Pandemic hospitalizations were compared with confirmed and probable seasonal influenza-associated hospitalizations reported during three previous influenza seasons (2005--06, 2006--07, and 2007--08). Data from the 2008--09 influenza season were not used because of overlap with the 2009 H1N1 spring wave. Additionally, cases occurring during the 4-month 2009 H1N1 spring wave (April 27, 2009--August 29, 2009) were compared with cases during the 9-month "fall wave" (August 30, 2009--May 21, 2010). Data collected by medical chart reviews and investigations by local health department personnel included demographic information, illness onset dates, laboratory results, comorbid conditions, and number of severe illnesses (defined as ICU admission or death) among persons hospitalized. In this analysis, racial/ethnic minorities were defined as all persons who were not non-Hispanic whites.
Rates were calculated using the total state population as a denominator. Chi-square tests were used to assess the significance of differences between 2009 H1N1 and seasonal hospitalizations by illness severity, race/ethnicity, county of residence, age group, and comorbid conditions and to assess the differences between spring and fall waves of 2009 H1N1 hospitalizations by illness severity, race/ethnicity, county of residence, and age group.
During the 2009 H1N1 pandemic, 1,327 influenza hospitalizations were reported; 423 (15.6 cases per 100,000 persons) were reported during the 4-month spring wave, and 904 (32.8 cases per 100,000) during the 9-month fall wave (Table 1). By comparison, an average of 435 influenza hospitalizations (range: 281--511) (15.8 cases per 100,000) were reported during three previous influenza seasons (Figure). During the 2009 H1N1 pandemic period (April 27, 2009 to May 21, 2010), hospitalization rates, by age group, were as follows: 105.4 cases per 100,000 among persons aged 0--4 years, 40.5 among those aged 5--24 years, 38.0 among those aged 25--49 years, 55.3 among those aged 50--64 years, and 45.3 among those aged ≥65 years. By comparison, average hospitalization rates for the three previous seasons for these age groups were, 57.2, 5.7, 5.6, 12.1, and 55.5 cases per 100,000 population, respectively.
Pandemic H1N1 influenza resulted in more severe illness than seasonal influenza, with 25.5% of pandemic hospitalizations resulting in death or ICU admission, compared with 14.0% of seasonal hospitalizations during the 2007--08 influenza season (p<0.01) (Table 2). Severity increased with age. The percentage of 2009 H1N1 hospitalizations resulting in severe illness ranged from 12.2% among children aged 0--4 years to 42.2% among adults aged ≥65 years. The percentage of 2009 H1N1 hospitalizations resulting in death was zero among persons aged 0--4 years, 2.4% among those aged 5--24 years, 5.2% among those aged 25--49 years, 5.7% among those aged 50--64 years, and 8.1% among those aged ≥65 years. Additionally, hospitalized adults aged ≥65 years were more likely to experience severe disease from 2009 H1N1 (42.2%) than from seasonal influenza in 2007--08 (21.0%) (p<0.01). Overall, the percentage of 2009 H1N1 hospitalizations resulting in severe illness was significantly greater during the spring wave (30.9%) than the fall wave (23.0%) (p<0.01) (Table 2).
Of 2009 H1N1 hospitalizations with race/ethnicity reported, 29.5% of cases occurred among minorities, who make up 18.6% of the state population, compared with an average of 22.0% of cases during the three previous influenza seasons (p<0.01) (Table 1). Of spring wave H1N1 hospitalizations with known race/ethnicity, 40.7% occurred in minorities, compared with 24.6% of fall wave hospitalizations (p<0.01). Race/ethnicity data were missing for 12.3% of 2009 H1N1 hospitalizations and for an average of 12.6% of influenza hospitalizations during the three previous seasons.
A significantly greater percentage of all Utah 2009 H1N1 hospitalizations were among residents of Salt Lake County (43.7%), compared with hospitalizations for seasonal influenza during 2005--2008 (35.4%) (p<0.01) (Table 1). The largest county in the state, Salt Lake County includes 37% of the state population (1). However, the excess of 2009 H1N1 hospitalizations in Salt Lake County occurred only during the spring wave (64.3% versus 35.7% in other counties); the opposite was observed during the fall wave (34.1% versus 65.9% in other counties). By race/ethnicity, 36.5% of 2009 H1N1 hospitalizations in Salt Lake County occurred among minorities, who represent 24.8% of the county population (1), compared with 29.0% of seasonal hospitalizations (Table 1). This disparity also was limited to the H1N1 spring wave. When analyzed by census tract, 70% of spring wave 2009 H1N1 hospitalizations were among residents of census tracts with at least a 25% minority population, including one census tract with an 83% minority population. In contrast, only 36% of fall wave H1N1 hospitalizations were among residents of census tracts with at least a 25% minority population.
Among patients hospitalized with seasonal influenza during the combined 2006--07 and 2007--08 influenza seasons, 63.4% were at high risk for complications because of age (i.e., <5 years or ≥65 years), compared with 29.5% of patients hospitalized with 2009 H1N1 (Table 1). Among all hospitalized 2009 H1N1 patients, 6.3% were pregnant women, compared with 2.5% of those hospitalized with seasonal influenza (Table 1). When comorbidity† was considered, 61.6% of hospitalized 2009 H1N1 patients were at high risk for complications because of comorbidities, compared with 50.1% of patients hospitalized with seasonal influenza (Table 1).
Reported by
Rachelle Boulton, MSPH, Rachel Herlihy, MD, Robert Rolfs, MD, Valoree Vernon, MPH, Utah Dept of Health. Mary Hill, MPH, Andrea Price, Ilene Risk, MPA, Diana Thurston, PhD, Salt Lake Valley Health Dept. Carolyn Rose, MPH, Summit County Health Dept. Joy Holbrook, MPH, Utah County Health Dept. Corresponding contributor: Rachelle Boulton, rboulton@utah.gov, 801-538-6191.
Editorial Note
Influenza-associated hospitalizations have been reportable in Utah since 2005, and these reports have been beneficial for tracking seasonal influenza. When 2009 H1N1 pandemic influenza was first identified, a reporting system was already in place in Utah, and partners throughout the state were familiar with data collection and reporting procedures. Data on 2009 H1N1 became rapidly available to public health officials and provided valuable insights into disparities among those populations at greatest risk for severe disease. For example, during the spring wave of the pandemic, public health authorities were able to respond with messages in Spanish to persons in the Hispanic population, who make up the largest proportion of the state's minorities and who were experiencing a disproportionate number of hospitalizations from 2009 H1N1. Additionally, Utah health officials were able to use state-specific hospitalization data to support recommendations regarding vaccination. Surveillance data also allowed officials to communicate the importance of early initiation of antiviral therapy among hospitalized patients, persons in populations at high risk, and health-care providers.
Utah's surveillance data underscored the wide differences between the 2009 H1N1 pandemic and three recent influenza seasons. Whereas the number of patients hospitalized in Utah during the 2009 H1N1 spring wave was about the same as the number hospitalized for the entire 2007--08 influenza season, the fall wave more than doubled the number hospitalized during the spring wave. Early in the spring wave, public health professionals observed that persons in age groups not typically considered at increased risk for severe disease were being hospitalized in greater numbers than those historically at increased risk (i.e., children aged <5 years and adults aged ≥65 years) in Utah and elsewhere in the United States (2--5). However, although adults aged ≥65 years represented a lower percentage of hospitalizations during pandemic influenza than they did for seasonal influenza in 2007--08, those hospitalized for 2009 H1N1 were significantly more likely to have severe disease than those hospitalized with seasonal influenza.
Although severe illness was more common among patients hospitalized with 2009 H1N1 than seasonal influenza, the percentage of persons hospitalized in Utah with severe illness from 2009 H1N1 was similar to findings reported in published studies that found 20%--31% of spring pandemic hospitalizations required ICU admission (2--5). A decrease in the percentage of hospitalizations with severe illness was seen between the two 2009 H1N1 waves, although both spring and fall waves had greater percentages of severe illness than the 2007--08 influenza season.
The findings in this report are subject to at least two limitations. First, incomplete information in medical charts might have led to the underreporting of some underlying illnesses. Second, data on hospitalized patients only reflects events recorded in the medical record as of the time of data abstraction. Indicators of severe illness (death or ICU admission) that occurred after investigations were completed are not represented in the data. However, unrecognized illness severity was unlikely to have a significant effect on the data, because most case investigations were completed after patients were discharged.
Although Utah data showed minorities had disproportionately greater percentages of hospitalizations from 2009 H1N1 influenza, a trend also noted nationally (6,7), this finding was confined to the spring wave in Utah, when the majority of cases were in Salt Lake County, where 50.0% of the minority population in Utah lives (1). Health authorities could not determine whether the greater percentages of hospitalizations resulted from greater influenza transmission in areas with high minority population or from more severe disease in members of minority populations.
Acknowledgments
Utah's local health departments and Unified State Laboratory: Public Health.
References
- Perlich P. Population by race and Hispanic origin: Utah counties (2008). Salt Lake City, UT: University of Utah, Bureau of Economic and Business Research; 2009. Available at http://bebr.utah.edu/Documents/studies/2008_County_Race_Ethnicity_Estimates.pdf.
- Jain S, Kamimoto L, Bramley AM, et al. Hospitalized patients with 2009 H1N1 influenza in the United States, April--June 2009. N Engl J Med 2009;361:1935--44.
- CDC. Patients hospitalized with 2009 pandemic influenza A (H1N1)---New York City, May 2009. MMWR 2010;58:1436--40.
- Louie JK, Acosta M, Winter K, et al. Factors associated with death or hospitalization due to pandemic 2009 influenza A(H1N1) infection in California. JAMA 2009;302:1896--902.
- CDC. 2009 pandemic influenza A (H1N1) virus infections---Chicago, Illinois, April--July 2009. MMWR 2009;58:913--8.
- Zarychanski R, Stuart TL, Kumar A, et al. Correlates of severe disease in patients with 2009 pandemic influenza (H1N1) virus infection. CMAJ 2010;182:257--64.
- CDC. Deaths related to 2009 pandemic influenza A (H1N1) among American Indian/Alaska Natives---12 states, 2009. MMWR 2009;58:1341--4.
* A confirmed influenza-associated hospitalization was defined as hospitalization for ≥24 hours with a positive result for influenza infection by viral culture, viral nucleic acid test, or direct fluorescent antibody microscopy. A probable influenza-associated hospitalization was defined as hospitalization for ≥24 hours with a positive result for influenza infection from a rapid influenza test.
† Comorbid conditions include pregnancy, immunosuppression, and chronic cardiovascular, renal, metabolic, or respiratory conditions.
What is already known on this topic?
2009 pandemic influenza A (H1N1) produced substantial morbidity and mortality throughout the United States and the world.
What is added by this report?
In Utah, compared with seasonal influenza, 2009 H1N1 caused more severe illness, a geographically concentrated outbreak, and disproportionate hospitalization among minorities, particularly during the 2009 H1N1 "spring wave."
What are the implications for public health practice?
Hospital surveillance for influenza, both seasonal and pandemic, provides valuable information on populations severely affected by influenza. States that make influenza-associated hospitalizations a reportable condition can gain information useful for targeting influenza control activities.
FIGURE. Number of influenza hospitalizations, by surveillance week and pandemic influenza A (H1N1) wave --- Utah, 2005--2010 influenza seasons
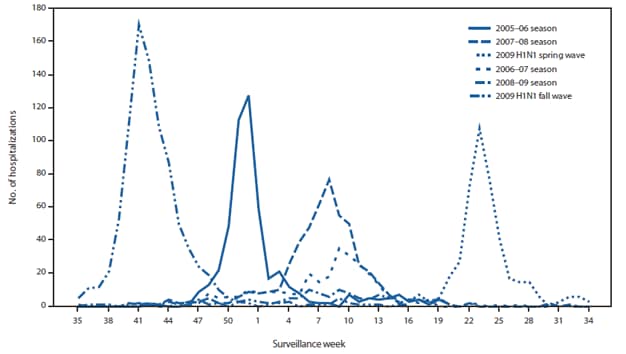
Alternate Text: The figure above shows the number of influenza hospitalizations, by surveillance week and pandemic influenza A (H1N1) wave in Utah during the 2005–2010 influenza seasons. During the 2009 H1N1 pandemic, 1,327 influenza hospitalizations were reported; 423 were reported during the 4-month spring wave, and 904 during the 9-month fall wave. By comparison, an average of 435 influenza hospitalizations were reported during three previous influenza seasons.
Use of trade names and commercial sources is for identification only and does not imply endorsement by the U.S. Department of
Health and Human Services.
References to non-CDC sites on the Internet are
provided as a service to MMWR readers and do not constitute or imply
endorsement of these organizations or their programs by CDC or the U.S.
Department of Health and Human Services. CDC is not responsible for the content
of pages found at these sites. URL addresses listed in MMWR were current as of
the date of publication.
All MMWR HTML versions of articles are electronic conversions from typeset documents.
This conversion might result in character translation or format errors in the HTML version.
Users are referred to the electronic PDF version (http://www.cdc.gov/mmwr)
and/or the original MMWR paper copy for printable versions of official text, figures, and tables.
An original paper copy of this issue can be obtained from the Superintendent of Documents, U.S.
Government Printing Office (GPO), Washington, DC 20402-9371;
telephone: (202) 512-1800. Contact GPO for current prices.
**Questions or messages regarding errors in formatting should be addressed to
mmwrq@cdc.gov.
