Persons using assistive technology might not be able to fully access information in this file. For assistance, please send e-mail to: mmwrq@cdc.gov. Type 508 Accommodation and the title of the report in the subject line of e-mail.
Respiratory Syncytial Virus --- United States, July 2007--June 2011
Each year in the United States, an estimated 75,000--125,000 hospitalizations related to respiratory syncytial virus (RSV)occur among children aged <1 year, and RSV infection results in approximately 1.5 million outpatient visits among children aged <5 years (1,2). In the United States, RSV season begins in the fall, peaks in winter, and ends in the late winter and early spring (3). However, the exact timing and duration vary from year to year and by geographic region (4). To describe trends in RSV seasonality, data from the National Respiratory and Enteric Virus Surveillance System (NREVSS) were used to determine the onset, offset, and peak of the July 2010--June 2011 RSV season, and for an aggregate analysis of the four most recent RSV seasons (July 2007--June 2011). During 2010--11, excluding Florida, season onset occurred from mid-November to early January, and offset occurred from mid-March to late April across all 10 U.S. Department of Health and Human Services (HHS) regions. Florida is reported separately because it has an earlier onset and longer duration than the rest of the country (4). During the four seasons from 2007 through 2011, onset among the HHS regions excluding Florida ranged from mid-October to early January, and offset ranged from early February to early May. Information on national and regional patterns can be used by clinicians and public health officials to guide diagnostic testing during respiratory disease outbreaks and determine when to provide RSV immunoprophylaxis for children at high risk for serious complications (5).
NREVSS is a passive, laboratory-based surveillance system that monitors the circulation of RSV and other respiratory and enteric viruses. Participating laboratories report weekly to CDC the number of RSV tests and the proportion that are positive.* For consistency, analysis was restricted to results of antigen detection methods, which were used by 98% of participating laboratories during 2007--2011. Only laboratories that reported for ≥30 weeks during a season, with an average of ≥10 tests per week were included in these analyses. Onset, offset, and duration were calculated based on the percentage of positive RSV tests.† The onset, offset, and peak were calculated at the national level with and without Florida, and for Florida and each of the 10 HHS regions§ individually. Data from Florida, part of HHS Region 4, were analyzed separately because the season can begin up to 3 months earlier in Florida than in the rest of the country (4).
During July 2010--June 2011, a total of 509 laboratories reported at least 1 week of RSV testing to NREVSS. Of these 509 laboratories, 179 (35.2%) from 42 states met inclusion criteria and reported a total of 320,751 tests, of which 50,860 (15.9%) were positive. National RSV onset occurred the week ending November 20, 2010, and lasted 21 weeks until the week ending April 9, 2011 (Table). The peak week occurred the week ending February 5, 2011. With data from Florida excluded from the analysis, the national RSV season onset occurred 1 week later (week ending November 27, 2010). Onset for the 10 HHS regions ranged from mid-November to early January, and season offset ranged from mid-March to late April. Median RSV season duration was 19 weeks (range: 13--22 weeks) (Table). Region 1 (Boston) had the shortest season, and Region 4 (Atlanta) had the longest season.
During the four reporting seasons from July 2007 to June 2011, the average number of laboratories that met inclusion criteria was 208 (range: 179--240). National RSV onset occurred from mid-October to mid-November, with the onset of each individual season within 3 weeks of the 4-season median (Figure). Offset occurred from mid-March to early April, with each season offset within 2 weeks of the median. National median season duration was 21 weeks (range: 19--22 weeks), and the median peak RSV week occurred in mid-January.
During the 4-season period, among the 10 HHS Regions excluding Florida, RSV season onset began as early as mid-October and lasted as late as early May. Each region had individual season onset and offset dates within 5 weeks on either side of the median onset and offset. The median seasonal durations ranged from 13 to 23 weeks, and median peak RSV activity occurred from mid-December to early February (Figure). In all regions, the most current RSV season (2010--11) onset and offset began during the same week or later than the onset during the first year of analysis (2007--08).
Weekly updates showing RSV national, regional, and state trends are available from the NREVSS website at http://www.cdc.gov/surveillance/nrevss. Additional information about Florida RSV trends is available from the Florida Department of Health website at http://www.doh.stat.fl.us/disease_ctrl/epi/rsv/rsv.htm.
Reported by
National Respiratory and Enteric Virus Surveillance System laboratories. Jeffry D. Mutuc, MPH, Gayle E. Langley, MD, Div of Viral Diseases, National Center for Immunization and Respiratory Diseases, CDC. Corresponding contributor: Jeffry D. Mutuc, jmutuc@cdc.gov, 404-639-2366.
Editorial Note
NREVSS data in this analysis were consistent with previously reported geographic differences in RSV seasonality (3,7); however, a narrow range of onset and offset dates was documented for most regions. Several factors might contribute to regional differences, including type of community (urban versus rural), population density, and weather patterns (6). Furthermore, although differences exist across regions within a given year, studies have shown variations in RSV activity reported by laboratories in the same region, even within short distances of one another (3,7,8). Comparisons between first and last years of analysis show a possible trend in later seasonal onset and offset dates. However, a progressively later onset and offset through the 4-season period was not consistent in all regions. Whether an actual change is occurring is unclear, and continued monitoring of RSV detections is necessary. Timely data are posted on the NREVSS website to alert health professionals and public health officials about the timing of the season.
NREVSS detections have been shown to correlate with RSV hospitalizations (9) and are a reliable measure for identifying RSV activity. Thus, surveillance data have been used to guide timing of RSV immunoprophylaxis with palivizumab. Palivizumab is a monoclonal anti-RSV antibody recommended to be administered as monthly injections during RSV season to children at high risk for severe RSV disease (i.e., select infants with congenital heart disease, chronic lung disease, or compromised immune systems, and those born prematurely) (10). The American Academy of Pediatrics provides guidelines for identifying infants and children likely to benefit from immunoprophylaxis and for timing of RSV immunoprophylaxis by region (10).
Because local activity does not always correspond to national patterns (3,7), NREVSS data can be used to guide the timing of RSV immunoprophylaxis at the local level. In a study using NREVSS data, 5-year median onset and offset dates were calculated for individual laboratories and showed that RSV transmission trends can be local and do not necessarily reflect regional trends (8).
The findings in this report are subject to at least four limitations. First, NREVSS data depend on voluntary reporting, a potential source of bias. Second, the number of participating laboratories that met inclusion criteria for analyses differed each season, which might explain some of the variation. Third, although NREVSS data provide good approximation of regional RSV seasonal characteristics, they might not always reflect RSV activity at the state or county level. Finally, percentage of positive detections reflects test ordering practices and might not directly reflect disease burden (e.g., number of cases or severity of the seasonal outbreak). Despite these limitations, NREVSS continues to play a crucial role in providing epidemiologic data on RSV circulation, guiding diagnostic testing, and helping plan prevention measures. Laboratories wishing to participate in NREVSS should contact CDC at e-mail nrevss@cdc.gov.
References
- Shay DK, Holman RC, Newman RD, et al. Bronchiolitis-associated hospitalizations among U.S. children, 1980--1996. JAMA 1999;282:1440--6.
- Hall CB, Weinberg GA, Iwane MK, et al. The burden of respiratory syncytial virus infection in young children. N Engl J Med 2009;360:588--98.
- Mullins JA, LaMonte AC, Bresee JS, et al. Substantial variability in community RSV season timing. Pediatr Infect Dis J 2003;22:857--62.
- CDC. Respiratory syncytial virus activity---United States, July 2008--December 2009. MMWR 2010;59:230--3.
- American Academy of Pediatrics. Respiratory syncytial virus. In: Pickering LK, Baker CJ, Kimberlin DW, Long SS, eds. Red book: 2009 report of the Committee on Infectious Diseases. 28th ed. Elk Grove Village, IL: American Academy of Pediatrics; 2009:560--9.
- Zachariah P, Shah S, Gao D, Simoes EA. Predictors of the duration of the respiratory syncytial virus season. Pediatr Infect Dis J 2009;28:772--6.
- Panozzo CA, Fowlkes AL, Anderson LJ. Variation in timing of respiratory syncytial virus outbreaks: lessons from national surveillance. Pediatr Infect Dis J 2007;26(11 Suppl):S41--5.
- Panozzo CA, Stockman LJ, Curns AT, Anderson LJ. Use of respiratory syncytial virus surveillance data to optimize the timing of immunoprophylaxis. Pediatrics 2010;126:e116--23.
- Light M, Bauman J, Mavunda K, et al. Correlation between respiratory syncytial virus (RSV) test data and hospitalization of children for lower respiratory tract illness in Florida. Pediatr Infect Dis J 2008;27:512--8.
- American Academy of Pediatrics Committee on Infectious Diseases. Modified recommendations for use of palivizumab for prevention of respiratory syncytial virus infections. Pediatrics 2009;124:1694--701.
* Surveillance Data, Inc. (SDI), a private company that conducts RSV surveillance with support from MedImmune, Inc. (Gaithersburg, Maryland), also contributes laboratory data to NREVSS.
† As defined by NREVSS, RSV national and regional season onset is the first of 2 consecutive weeks during which the mean percentage of specimens testing positive for RSV antigen is ≥10%. RSV season offset is the last of 2 consecutive weeks during which the mean percentage of positive specimens is ≥10%. Season duration is the number of weeks between season onset and offset, and the peak is the week with the highest proportion of positive RSV tests.
§ The 10 HHS regions (listed by region number and location of the regional headquarters) are Region 1 (Boston): Connecticut, Maine, Massachusetts, New Hampshire, Rhode Island, and Vermont; Region 2 (New York): New Jersey and New York; Region 3 (Philadelphia): Delaware, District of Columbia, Maryland, Pennsylvania, Virginia, and West Virginia; Region 4 (Atlanta): Alabama, Georgia, Kentucky, Mississippi, North Carolina, South Carolina, and Tennessee; Region 5 (Chicago): Illinois, Indiana, Michigan, Minnesota, Ohio, and Wisconsin; Region 6 (Dallas): Arkansas, Louisiana, New Mexico, Oklahoma, and Texas; Region 7 (Kansas City): Iowa, Kansas, Missouri, and Nebraska; Region 8 (Denver): Colorado, Montana, North Dakota, South Dakota, Utah, and Wyoming; Region 9 (San Francisco): Arizona, California, Hawaii, and Nevada; and Region 10 (Seattle): Alaska, Idaho, Oregon, and Washington.
What is already known on this topic?
Respiratory syncytial virus (RSV) is the leading cause of pneumonia and bronchiolitis among infants. In the United States, the season generally begins during the fall and continues through the winter and spring months; however, the exact timing of RSV circulation can vary by location and year. The National Respiratory and Enteric Virus Surveillance System (NREVSS) is a network of laboratories that track RSV trends by calculating the percentage of RSV antigen tests performed each week that are positive.
What is added by this report?
The most recent RSV season began in November 2010 and ended in April 2011; in several regions, the onset and offset was slightly later during the 2010--11 season compared with the first season of analysis (2007--08).
What are the implications for public health practice?
Understanding long-term seasonal trends in RSV activity is helpful for guiding diagnostic testing during respiratory disease outbreaks and timing the use of RSV immunoprophylaxis for reducing RSV-related hospitalizations of children at high risk for serious disease.
FIGURE. Respiratory syncytial virus (RSV) season onset and offset range and median, by U.S. Department of Health and Human Services Region* and in Florida --- National Respiratory and Enteric Virus Surveillance System, July 2007--June 2011
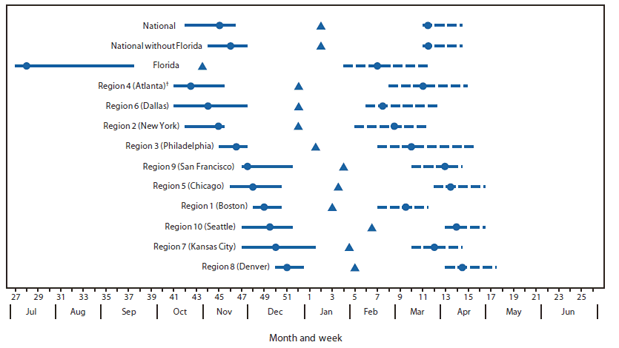
* Listed by region number and headquarters city. Region 1 (Boston): Connecticut, Maine, Massachusetts, New Hampshire, Rhode Island, and Vermont. Region 2 (New York): New Jersey and New York. Region 3 (Philadelphia): Delaware, District of Columbia, Maryland, Pennsylvania, Virginia, and West Virginia. Region 4 (Atlanta): Alabama, Georgia, Kentucky, Mississippi, North Carolina, South Carolina, and Tennessee. Region 5 (Chicago): Illinois, Indiana, Michigan, Minnesota, Ohio, and Wisconsin. Region 6 (Dallas): Arkansas, Louisiana, New Mexico, Oklahoma, and Texas. Region 7 (Kansas City): Iowa, Kansas, Missouri, and Nebraska. Region 8 (Denver): Colorado, Montana, North Dakota, South Dakota, Utah, and Wyoming. Region 9 (San Francisco): Arizona, California, Hawaii, and Nevada. Region 10 (Seattle): Alaska, Idaho, Oregon, and Washington. Idaho, Maine, New Mexico, and the District of Columbia did not have any participating laboratories in the four-season (2007--2011) analysis.
† Excludes data from Florida.
Alternate Text: The figure above shows respiratory syncytial virus (RSV) season onset and offset range and median, by U.S. Department of Health and Human Services Region and in Florida, during July 2007-June 2011, based on data from the National Respiratory and Enteric Virus Surveillance System. National RSV onset occurred from mid-October to mid-November, with the onset of each individual season within 3 weeks of the 4-season median.
Use of trade names and commercial sources is for identification only and does not imply endorsement by the U.S. Department of
Health and Human Services.
References to non-CDC sites on the Internet are
provided as a service to MMWR readers and do not constitute or imply
endorsement of these organizations or their programs by CDC or the U.S.
Department of Health and Human Services. CDC is not responsible for the content
of pages found at these sites. URL addresses listed in MMWR were current as of
the date of publication.
All MMWR HTML versions of articles are electronic conversions from typeset documents.
This conversion might result in character translation or format errors in the HTML version.
Users are referred to the electronic PDF version (http://www.cdc.gov/mmwr)
and/or the original MMWR paper copy for printable versions of official text, figures, and tables.
An original paper copy of this issue can be obtained from the Superintendent of Documents, U.S.
Government Printing Office (GPO), Washington, DC 20402-9371;
telephone: (202) 512-1800. Contact GPO for current prices.
**Questions or messages regarding errors in formatting should be addressed to
mmwrq@cdc.gov.
