Persons using assistive technology might not be able to fully access information in this file. For assistance, please send e-mail to: mmwrq@cdc.gov. Type 508 Accommodation and the title of the report in the subject line of e-mail.
West Nile Virus Disease and Other Arboviral Diseases --- United States, 2010
Arthropod-borne viruses (arboviruses) are transmitted to humans primarily through the bites of infected mosquitoes and ticks. Since West Nile virus (WNV) was first detected in the Western Hemisphere in 1999, it has become the leading cause of neuroinvasive arboviral disease in the United States (1). However, several other arboviruses continue to cause sporadic cases and seasonal outbreaks of neuroinvasive disease (i.e., meningitis, encephalitis, or acute flaccid paralysis) (1,2). This report summarizes surveillance data reported to CDC in 2010 for WNV and other nationally notifiable arboviruses (excluding dengue, which is reported separately). In 2010, 40 states and the District of Columbia (DC) reported 1,021 cases of WNV disease. Of these, 629 (62%) were classified as WNV neuroinvasive disease, for a national incidence of 0.20 per 100,000 population. States with the highest incidence were Arizona (1.60), New Mexico (1.03), Nebraska (0.55), and Colorado (0.51). After WNV, the next most commonly reported cause of neuroinvasive arboviral disease was California serogroup viruses (CALV), with 68 cases, followed by eastern equine encephalitis virus (EEEV), 10 cases, St. Louis encephalitis virus (SLEV), eight cases, and Powassan virus (POWV), eight cases. WNV and other arboviruses continue to cause focal outbreaks and severe illness in substantial numbers of persons in the United States. Maintaining surveillance remains important to guide arboviral disease prevention activities.
In the United States, arboviruses are maintained in transmission cycles between arthropods and vertebrate hosts (typically birds or small mammals). Humans usually are infected incidentally and become "dead-end" hosts, with too little virus in their blood to continue the cycle by infecting feeding mosquitoes. The majority of human arboviral infections are asymptomatic. Symptomatic illness commonly manifests as systemic febrile illness and less commonly as neuroinvasive disease. Most endemic arboviral diseases are nationally notifiable (3). Data are reported to CDC through ArboNET, an Internet-based national surveillance system (4). In addition to cases of human disease, ArboNET collects data on viremic blood donors, veterinary cases, and infections in mosquitoes, dead birds, and sentinel chickens.* Using standard definitions, human cases are classified as neuroinvasive disease (i.e., meningitis, encephalitis, or acute flaccid paralysis) or nonneuroinvasive disease (3). Because of the substantial associated morbidity, detection and reporting of neuroinvasive disease cases is assumed to be more consistent and complete than for nonneuroinvasive disease cases. For this report, incidence was calculated only for cases of neuroinvasive disease.
In 2010, a total of 1,021 human cases of WNV disease, including 629 (62%) cases of neuroinvasive disease were reported from 40 states and DC. The number of human disease cases peaked in mid-August; in 911 (89%) cases, illness onset occurred during July--September (Table 1). Median age of WNV patients was 56 years (range 1--98 years), and 574 (56%) cases were in males. Overall, 718 (70%) persons were hospitalized with WNV disease, and 57 (6%) died.
Of the 629 cases of WNV neuroinvasive disease reported, 342 (54%) patients had encephalitis, 239 (38%) had meningitis, and 48 (8%) had acute flaccid paralysis; 33 (69%) of the 48 patients with acute flaccid paralysis also had encephalitis or meningitis. Fifty-four (9%) patients with neuroinvasive disease died. The national rate of neuroinvasive disease was 0.2 per 100,000 population. The highest reported rates were in Arizona (1.60), New Mexico (1.03), Nebraska (0.55), and Colorado (0.51) (Table 2). Among the neuroinvasive cases, 345 (55%) cases were reported from four states: Arizona (107 cases), New York (89), Texas (77), and California (72). Neuroinvasive disease incidence increased with age, with the highest incidence among persons aged ≥70 years (Figure).
Seventy-five cases of CALV disease, including 68 (91%) neuroinvasive disease cases, were reported from 11 states (Table 2); 74 (99%) of the CALV cases were caused by La Crosse virus, the most commonly reported CALV in the United States. Dates of illness onset for human cases ranged from March to November; 64 (85%) cases had illness onset during July--September (Table 1). The median age of patients was 8 years (range 1 month--74 years); 66 (89%) cases occurred in persons aged <18 years, and 42 (56%) occurred in males. One fatal case (1%) was reported. CALV neuroinvasive disease incidence was highest in West Virginia (0.44 per 100,000), North Carolina (0.23), and Ohio (0.17) (Table 2).
Ten EEEV disease cases (all neuroinvasive disease) were reported from five states, with the largest numbers reported from Florida (four cases) and Michigan (three) (Table 2). Dates of illness onset for human cases ranged from July to August (Table 1). Nine cases occurred in adults (median age: 51 years, range: 1--73 years); seven cases occurred in males. Five of the 10 cases (50%) were fatal, including all four cases reported from Florida. Median age in fatal cases was 56 years (range: 1--73 years); median number of days from illness onset to death was 10 (range: 1--11 days).
A total of 10 SLEV disease cases were reported from Texas (three cases), Arkansas (two), Michigan (two), DC (two), and Missouri (one) (Table 2). The DC cases were the first SLEV cases reported from that jurisdiction since 1975; both were classified as nonneuroinvasive disease. The other eight cases all were classified as neuroinvasive disease. Dates of illness onset for the 10 cases overall ranged from June to November (Table 1). All cases occurred in adults (median age: 56 years, range: 23--75 years); five occurred in males. One fatal case (10%) was reported.
Eight POWV disease cases (all neuroinvasive disease) were reported from Wisconsin (four cases), Minnesota (three), and New York (one) (Table 2). Months of illness onset ranged from May to December, with four occurring during April--June and three during October--December (Table 1). Median age of patients was 56 years (range: 6--77 years); seven cases occurred in males. No fatal cases were reported.
Reported by
Nicole P. Lindsey, MS, Jennifer A. Lehman, Dustin Weaver, DVM, Grant L. Campbell, MD, J. Erin Staples, MD, Marc Fischer, MD, Div of Vector-Borne Diseases, National Center for Emerging and Zoonotic Infectious Diseases, CDC. Corresponding contributor: Nicole P. Lindsey, nplindsey@cdc.gov, 970-221-6400.
Editorial Note
In 2010, WNV was the most common cause of neuroinvasive arboviral disease in the United States; however, La Crosse virus was the most common cause among children, a finding consistent with previous reports (1). EEEV disease, although rare, remained the most severe arboviral disease, with a 50% case-fatality rate. Among human cases of arboviral disease reported in 2010, 88% occurred during July--September, emphasizing the importance of targeting public health interventions for this period.
Reported numbers of arboviral disease cases vary from year to year. During 2004--2007, WNV appeared to reach a stable annual incidence of approximately 0.4 per 100,000. Incidence dropped to 0.2 per 100,000 in 2008 and declined further in 2009 (1,5). However, in 2010, the number of reported WNV neuroinvasive disease cases increased 62% from that reported in 2009. The number of arboviral disease cases reported annually is affected by complex interactions between arthropod vectors, vertebrate hosts, human behavior, environmental factors, and diagnostic testing and reporting practices (6). These variables make difficult predicting how many cases of disease might occur in the future and in what areas. Persons who seek to limit their risk for arboviral disease should use measures (e.g., repellent) to reduce their exposure to mosquitoes and ticks.
The findings in this report are subject to at least two limitations. First, arboviral surveillance programs, testing capacity, and reporting vary by location. Second, ArboNET is a passive surveillance system that relies on clinicians considering diagnosis of an arboviral disease and obtaining appropriate diagnostic tests, and on reporting of laboratory-confirmed cases to public health authorities. Detection and reporting are incomplete, leading to a substantial underestimate of the actual number of cases. Based on previous studies, for every case of WNV neuroinvasive disease, approximately 140 human WNV infections occur, with 80% of infected persons remaining asymptomatic and 20% developing nonneuroinvasive disease (7,8). Extrapolating from the 629 reported WNV neuroinvasive disease cases, an estimated 88,000 infections and 17,600 cases of nonneuroinvasive disease might have occurred in 2010; however, only 392 (2%) nonneuroinvasive disease cases were reported.
WNV and other arboviruses continue to cause severe illness in substantial numbers of persons in the United States. Continued surveillance of WNV and other arboviruses is important to guide prevention efforts aimed at reducing the incidence of these diseases. Health-care providers should consider arboviral infections in the differential diagnosis of cases of aseptic meningitis and encephalitis, obtain appropriate specimens for laboratory testing, and promptly report cases to state health departments. Specific etiologic diagnoses in such cases are important to 1) rule out diseases for which specific therapy is available, 2) better inform patients about prognosis, and 3) alert public health authorities to take appropriate control measures. In the absence of effective human vaccines, prevention of arboviral disease depends on community and household efforts to reduce vector densities (e.g., applying insecticides and reducing mosquito breeding sites), personal protective measures to decrease exposure to vectors (e.g., use of repellents and long-sleeved shirts and long pants), and screening blood donors.
Acknowledgment
ArboNET surveillance coordinators in local and state health departments.
References
- Reimann CA, Hayes EB, DiGuiseppi C, et al. Epidemiology of neuroinvasive arboviral disease in the United States, 1999--2007. Am J Trop Med Hyg 2008;79:974--9.
- CDC. Arboviral infections of the central nervous system---United States, 1996--1997. MMWR 1998;47:517--22.
- CDC. Arboviral diseases, neuroinvasive and non-neuroinvasive: 2011 case definition. Atlanta, GA: US Department of Health and Human Services, CDC; 2011. Available at http://www.cdc.gov/osels/ph_surveillance/nndss/casedef/arboviral_current.htm. Accessed July 29, 2011.
- CDC. Surveillance for human West Nile virus disease---United States, 1999--2008. MMWR 2010;59(No. SS-2).
- CDC. West Nile virus activity---United States, 2009. MMWR 2010;59:769--72.
- Hayes EB, Komar N, Nasci RS, Montgomery SP, O'Leary DR, Campbell GL. Epidemiology and transmission dynamics of West Nile virus disease. Emerg Infect Dis 2005;11:1167--73.
- Mostashari F, Bunning ML, Kitsutani PT, et al. Epidemic West Nile encephalitis, New York, 1999: results of a household-based seroepidemiological survey. Lancet 2001;358:261--4.
- Tsai TF, Popovici F, Cernescu C, Campbell GL, Nedelcu NI. West Nile encephalitis epidemic in southeastern Romania. Lancet 1998;352:767--71.
What is already known on this topic?
Since West Nile virus (WNV) was first detected in the Western Hemisphere in 1999, it has become the leading cause of neuroinvasive arboviral disease in the United States. However, several other arboviruses can cause sporadic cases and seasonal outbreaks of neuroinvasive disease.
What is added by this report?
WNV was the most common cause of neuroinvasive arboviral diseases in the United States in 2010; however, La Crosse virus was the most common cause among children. Eastern equine encephalitis, although rare, remained the most severe arboviral disease, with a 50% case-fatality rate.
What are the implications for public health practice?
WNV and other arboviruses continue to be a source of severe illness each year for substantial numbers of persons in the United States. Maintaining surveillance remains important to help direct and promote prevention activities.
FIGURE. Incidence* of cases (N = 629) of West Nile virus neuroinvasive disease,† by age group --- United States, 2010
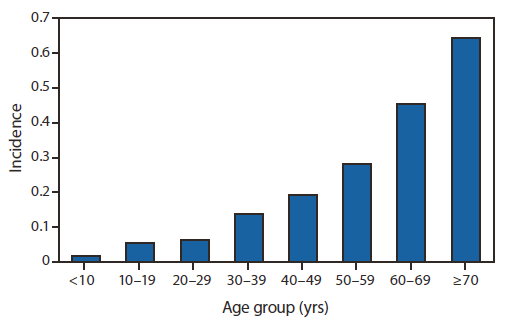
* Per 100,000 population, based on July 1, 2010, U.S. Census estimates.
† Meningitis, encephalitis, or acute flaccid paralysis.
Alternate Text: The figure above shows the incidence of cases (N = 629) of West Nile virus neuroinvasive disease, by age group, in the United States in 2010. WNV neuroinvasive disease incidence increased with age group, with the highest incidence among persons aged ≥70 years.
Use of trade names and commercial sources is for identification only and does not imply endorsement by the U.S. Department of
Health and Human Services.
References to non-CDC sites on the Internet are
provided as a service to MMWR readers and do not constitute or imply
endorsement of these organizations or their programs by CDC or the U.S.
Department of Health and Human Services. CDC is not responsible for the content
of pages found at these sites. URL addresses listed in MMWR were current as of
the date of publication.
All MMWR HTML versions of articles are electronic conversions from typeset documents.
This conversion might result in character translation or format errors in the HTML version.
Users are referred to the electronic PDF version (http://www.cdc.gov/mmwr)
and/or the original MMWR paper copy for printable versions of official text, figures, and tables.
An original paper copy of this issue can be obtained from the Superintendent of Documents, U.S.
Government Printing Office (GPO), Washington, DC 20402-9371;
telephone: (202) 512-1800. Contact GPO for current prices.
**Questions or messages regarding errors in formatting should be addressed to
mmwrq@cdc.gov.
