Persons using assistive technology might not be able to fully access information in this file. For assistance, please send e-mail to: mmwrq@cdc.gov. Type 508 Accommodation and the title of the report in the subject line of e-mail.
Adult Blood Lead Epidemiology and Surveillance --- United States, 2008--2009
Lead exposure can result in acute or chronic adverse effects in multiple organ systems, ranging from subclinical changes in function to symptomatic, life-threatening toxicity. Despite improvements in public health policies and substantial reductions in blood lead levels (BLLs) in adults, lead exposure remains an important health problem worldwide. Approximately 95% of all elevated BLLs reported among adults in the United States are work-related (1), and recent research has raised concerns regarding the toxicity of BLLs as low as 5 µg/dL (2,3). CDC's state-based Adult Blood Lead Epidemiology and Surveillance (ABLES) program tracks laboratory-reported elevated BLLs. To update rate trends and identify industry subsectors and nonoccupational activities with high lead exposures, CDC collected and analyzed 2008--2009 data from 40 state ABLES programs. The results of that analysis indicated that a decline in the prevalence of elevated BLLs (≥25 µg/dL) was extended, from 14.0 per 100,000 employed adults in 1994 to 6.3 in 2009. Industry subsectors with the highest numbers of lead-exposed workers were battery manufacturing, secondary smelting and refining of nonferrous metals, and painting and paper hanging. The most common nonoccupational exposures to lead were shooting firearms; remodeling, renovating, or painting; retained bullets (gunshot wounds); and lead casting. The findings underscore the need for government agencies, employers, public health professionals, health-care providers, and worker-affiliated organizations to increase interventions to prevent workplace lead exposure, and the importance of conducting lead exposure surveillance to assess the effectiveness of these interventions.
State ABLES programs 1) collect data on adult BLLs from laboratories and physicians through mandatory reporting requirements; 2) assign unique identifiers to each adult to account for multiple BLL records; 3) follow-up on adults with BLLs ≥25 µg/dL with laboratories, health-care providers, employers, or workers to ensure completeness of information (e.g., the industry where the adult is employed and whether the exposure source is occupational, nonoccupational, or both); and 4) code the industry where the adult worked using the 1987 Standard Industrial Classification (SIC) or the 2002 North American Industry Classification System (NAICS). The requirement for laboratories and health-care providers to notify state authorities about BLLs varies among ABLES states, ranging from the reporting of all BLLs to only BLLs ≥40 µg/dL.* Most ABLES states submit data on all BLLs to CDC's National Institute for Occupational Safety and Health (NIOSH), including records from adults whose BLLs fall below the state reporting requirement.
Adults were defined as persons aged ≥16 years. For adults with more than one BLL record in a given year, only the highest BLL was included. Elevated BLLs were defined as blood lead concentrations ≥25µg/dL. Prevalence numerators were either "state residents" (adults residing in the reporting state) or "state residents and nonresidents" (all adults reported by a state) with elevated BLLs (a distinction in the data since 2002); both employed and unemployed persons were included in the numerators. Denominators were the annual employed population aged ≥16 years for the period 2008--2009, as obtained from the U.S. Bureau of Labor Statistics (4). To calculate annual state prevalences, the numbers of adults with elevated BLLs from each of the 40 states reporting† were divided by the state's annual employed population and expressed as a rate per 100,000 employed adults. The combined state numerators and denominators for each year were then used to calculate national (40-state) prevalence rates for 2008--2009. The percentage of adults with BLL ≥40 µg/dL among adults with BLL ≥25µg/dL in each industry subsector was used to identify industry subsectors with the highest lead exposures. Additional information regarding interpretation of specific state ABLES data, definitions, and rate calculations is available at the ABLES program website (5).
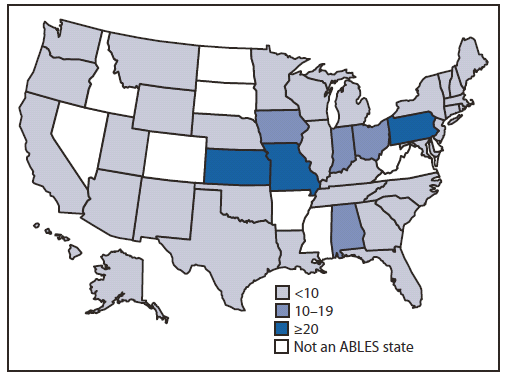
A total of 40 states submitted data in both 2008 and 2009. Overall, the prevalence of elevated BLLs (≥25 µg/dL) among state residents and nonresidents declined from 14.0 adults per 100,000 employed adults in 1994 (4) to 7.4 in 2008 and 6.3 in 2009. Rates were slightly lower (7.1 and 6.1 respectively) when only state resident adults were included (Figure 1). The number of states with high prevalence of elevated BLLs (i.e., ≥20 adults per 100,000 employed adults) decreased from six of 17 states in 1994 to three of 40 states in 2009 (Figure 2). ABLES states reported 9,325 and 7,674 state resident adults with elevated BLLs in 2008 and 2009, respectively. State resident prevalence of elevated BLLs for 2008 ranged from 0.5 per 100,000 employed adults (Hawaii) to 37.6 (Pennsylvania); and for 2009, from 0.3 (Hawaii) to 32.0 (Pennsylvania). Prevalence of state resident and nonresident adults with BLLs ≥40 µg/dL declined from 3.5 in 1994 to 1.2 in 2008 and 0.9 in 2009. In 2008, these rates ranged from 0.2 (Arizona) to 6.5 (Pennsylvania) and in 2009, from zero (Alaska and Wyoming) to 4.2 (Pennsylvania).
Thirty-seven states in 2008 and 38 states in 2009 submitted data on industry and exposure source (8,450 and 7,112 state resident adults with elevated BLLs, respectively).§ Among all reported cases of elevated BLLs, exposures at work accounted for 6,081 (71.9%) in 2008 and 4,998 (70.1%) in 2009 (Table). Among only those cases with known exposure type (i.e., occupational or nonoccupational), occupational exposures accounted for 94.8% of cases in 2008 and 93.8% in 2009. The greatest proportions of adults with elevated BLLs were employed in three main industry sectors: manufacturing (72.1% in 2008 and 72.3% in 2009), construction (13.2% in 2008 and 14.4% in 2009), and mining (6.6% in 2008 and 5.1% in 2009). Industry subsectors with the highest numbers of workers with elevated BLLs were manufacturing of storage batteries, secondary smelting and refining of nonferrous metals, and painting and paper hanging (Table). Industry subsectors with the greatest proportions of adults with BLLs ≥40 µg/dL among adults with BLLs ≥25 µg/dL were painting and paper hanging; bridge, tunnel, and elevated highway construction; copper foundries; special trade contractors; and heavy construction industries (Table). Nonoccupational exposures accounted for 337 (4.0%) and 328 (4.6%) of all adult cases in 2008 and 2009, respectively. The most common nonoccupational exposures were from shooting firearms; remodeling, renovating, or painting; retained bullets; and lead casting (Table).
Reported by
Walter A. Alarcon, MD, Janet R. Graydon, Geoffrey M. Calvert, MD, Div of Surveillance, Hazard Evaluations, and Field Studies, National Institute for Occupational Safety and Health, CDC. Corresponding contributor: Walter A. Alarcon, CDC, walarcon@cdc.gov, 513-841-4451.
Editorial Note
Job activities known to involve the use or disturbance of lead include the following: handling of lead-containing powders, liquids, or pastes; production of dust or fumes by melting, burning, cutting, drilling, machining, sanding, scraping, grinding, polishing, etching, blasting, torching, or welding lead-containing solids; and dry sweeping of lead-containing dust and debris (3). Since 1994, ABLES surveillance results indicate an overall decreasing trend in the prevalence of elevated BLLs in U.S. adults and a decrease in the number of states with the highest rates (i.e., ≥20 adults per 100,000). This decrease, in part, might be attributable to a decline in the number of manufacturing jobs with potential for lead exposure over time and prevention measures that have been enacted since the early 1990s, including 1) improved interventions by state ABLES programs,¶ worker-affiliated organizations, and federal programs such as the Occupational Safety and Health Administration (OSHA) National Emphasis Program to reduce lead exposure** and 2) measures implemented by industry (e.g., engineering and work practice controls,†† and respiratory protection). However, the decrease in rates also might reflect low employer compliance with testing and reporting requirements (6).
ABLES data also underscore that elevated BLLs among adults are almost exclusively an occupational health problem in the United States. Those states with higher rates of elevated BLLs might represent 1) states where higher proportions of workers are employed in high-risk industries (e.g., lead-related manufacturing, construction activities involving lead paint exposure, and lead mining), 2) states where workers in high-risk areas are less likely to be protected by engineering and workplace controls, or 3) states where greater compliance with testing requirements by employers and reporting requirements by laboratories result in larger numbers of reported cases of elevated BLLs. Similar to findings in previous years, the 2008--2009 data indicate that five industry subsectors accounted for approximately 65% and 14 subsectors accounted for approximately 80% of adults with elevated BLLs who were exposed at work. Higher lead exposures likely are present in those industries with the greatest proportions of elevated BLLs ≥40 µg/dL.
ABLES data are used to track Healthy People 2020 objective OSH-7, to reduce the prevalence of persons who have elevated BLLs from work exposures (7). The Healthy People 2020 target incorporates the new ≥10 µg/dL operational definition for elevated BLLs established by ABLES consistent with guidance from the Association of Occupational and Environmental Clinics and the Council of State and Territorial Epidemiologists (8).
The findings in this report are subject to at least four limitations. First, the number of adults with elevated BLLs reported to ABLES likely is underreported because some employers might not provide BLL testing to all lead-exposed workers as required by OSHA regulations and because some laboratories might not report all tests as required by state regulations (9). Second, because denominators are the numbers of employed persons, aged ≥16 years, unemployed adults who might be at risk for lead exposure, although included in the numerator, are not included in the denominator. Third, although state ABLES programs ascertain the work-relatedness of a lead exposure by following up with laboratories, physicians, employers, or workers, the possibility of misclassification of occupational versus nonoccupational cases cannot be excluded. Finally, analyzing lead exposures using a threshold of 25 µg/dL likely underestimates harmful occupational lead exposure because lead-related toxicity can occur at levels as low as 5 µg/dL and the Healthy People 2020 target is set at 10 µg/dL
Progress toward meeting the Healthy People 2020 target for reducing the prevalence of adults with BLLS ≥10 µg/dL from workplace lead exposures can be aided by improving 1) worker protection programs developed and maintained by employers§§; 2) government activities such as ABLES programs, which can effectively intervene to prevent lead exposures and the OSHA National Emphasis Program to reduce lead exposure; 3) research and interventions by stakeholder organizations; and 4) education of the public regarding preventing nonoccupational exposures. Emphasis should be placed on those industries identified in this report with the highest numbers of workers with elevated BLLs: manufacturing of storage batteries, secondary smelting and refining of nonferrous metals, painting and paper hanging, and bridge, tunnel, and elevated highway construction.
Acknowledgments
ABLES program coordinators in 40 states who contributed data in 2008 and 2009.
References
- CDC. Adult blood lead epidemiology and surveillance---United States, 2003--2004. MMWR 2006;55:876--9.
- Kosnett MJ, Wedeen, RP, Rothenberg SJ, et al. Recommendations for medical management of adult lead exposure. Environ Health Perspect 2007;115:463--71.
- Association of Occupational and Environmental Clinics. Medical management guidelines for lead-exposed adults. Washington, DC: Association of Occupational and Environmental Clinics; 2007. Available at
http://www.aoec.org/documents/positions/mmg_final.pdf. Accessed June 27, 2011.
- Bureau of Labor Statistics. Local Area Unemployment Statistics (LAUS). Washington, DC: US Department of Labor, Bureau of Labor Statistics; 2011. Available at
http://www.bls.gov/data. Accessed March 1, 2011.
- National Institute for Occupational Safety and Health. Adult Blood Lead Epidemiology & Surveillance (ABLES). Atlanta, GA: US Department of Health and Human Services, CDC, National Institute for Occupational Safety and Health. Available at
http://www.cdc.gov/niosh/topics/ables/ables.html. Accessed June 27, 2011.
- Tak S, Roscoe RJ, Alarcon W, et al. Characteristics of US workers whose blood lead levels trigger the medical removal protection provision, and conformity with biological monitoring requirements, 2003--2005. Am J Ind Med 2008;51:691--700.
- US Department of Health and Human Services. Healthy people 2020: occupational safety and health. OSH-7: reduce the proportion of persons who have elevated blood lead concentrations from work exposures. Washington, DC: US Department of Health and Human Services; 2011. Available at
http://www.healthypeople.gov/2020/topicsobjectives2020/objectiveslist.aspx?topicid=30. Accessed June 27, 2011.
- National Center for Health Statistics. Health Indicators Warehouse: elevated blood led rates in adults. Hyattsville, MD: US Department of Health and Human Services, CDC, National Center for Health Statistics. Available at
http://www.healthindicators.gov/Indicators/Elevated-blood-lead-rates-in-adults_1300/National_0/Profile. Accessed June 27, 2011.
- Whittaker SG. Lead exposure in radiator repair workers: a survey of Washington State radiator repair shops and review of occupational lead exposure registry data. J Occup Environ Med 2003;45:724--33.
What is already known on this topic?
Lead exposure among adults remains almost exclusively an occupational health problem in the United States, although the health effects from lead exposure are well characterized and controls to reduce lead exposure for workers exist.
What this report adds?
During 2008--2009, the prevalence of U.S. adults with blood lead levels (BLLs) ≥25 µg/dL continued to decrease, to 6.3 per 100,000 employed adults in 2009 from 14.0 in 1994. The highest prevalences of elevated BLLs continue to be found among workers in the manufacturing, construction, and mining industries.
What are the implications for public health practice?
Measures to improve lead exposure surveillance and preventive interventions focused in the manufacturing, construction, and mining industries should be implemented by government agencies, employers, and worker-affiliated organizations.
FIGURE 1. Prevalence rates* of adults with elevated blood lead levels (BLLs) --- Adult Blood Lead Epidemiology and Surveillance program, United States, 1994--2009
Alternate Text: The figure above shows prevalence rates of adults with elevated blood lead levels (BLLs) in the United States during 1994-2009, according to the Adult Blood Lead Epidemiology and Surveillance program.
FIGURE 2. Prevalence rates* of adults with elevated blood lead levels (≥25 µg/dL), among adults residing in the reporting state --- Adult Blood Lead Epidemiology and Surveillance (ABLES) program, United States, 2009†
Alternate Text: The figure above shows prevalence rates of adults with elevated blood lead levels (≥25 μg/dL), among adults residing in the reporting state in the United States in 2009, according to the Adult Blood Lead Epidemiology and Surveillance (ABLES) program. The number of states with high prevalence of elevated BLLs (i.e., ≥20 adults per 100,000 employed adults) decreased from six of 17 states in 1994 to three of 40 states in 2009.
|
Exposure type
|
2008 (37 states)
|
2009 (38 states)
|
|
BLLs ≥25 µg/dL
|
BLLs ≥40 µg/dL
|
BLLs ≥25 µg/dL
|
BLLs ≥40 µg/dL
|
|
No.
|
(%†)
|
No.
|
(%§)
|
No.
|
(%†)
|
No.
|
(%§)
|
|
Occupational (industry subsector [SIC and NAICS codes]*)
|
|
Manufacturing
|
|
Storage batteries (SIC 3691, NAICS 335911)
|
2,214
|
(36.4)
|
239
|
(10.8)
|
1,800
|
(36.0)
|
138
|
(7.7)
|
|
Secondary smelting and refining of nonferrous metals (SIC 3341, NAICS 331314 part, 331423 part, 331492 part)
|
575
|
(9.5)
|
95
|
(16.5)
|
641
|
(12.8)
|
99
|
(15.4)
|
|
Primary batteries (dry and wet) (SIC 3692, NAICS 335912)
|
510
|
(8.4)
|
77
|
(15.1)
|
225
|
(4.5)
|
8
|
(3.6)
|
|
Primary smelting and refining of nonferrous metals (SIC 3339, NAICS 331419)
|
161
|
(2.6)
|
13
|
(8.1)
|
160
|
(3.2)
|
7
|
(4.4)
|
|
Copper foundries (SIC 3366, NAICS 331525)
|
126
|
(2.1)
|
28
|
(22.2)
|
56
|
(1.1)
|
11
|
(19.6)
|
|
Rolling, drawing, and extruding of nonferrous metals (SIC 3356, NAICS 331491)
|
68
|
(1.1)
|
10
|
(14.7)
|
102
|
(2.0)
|
14
|
(13.7)
|
|
Nonferrous die-castings, except aluminum (SIC 3364, NAICS 331522)
|
52
|
(0.9)
|
6
|
(11.5)
|
33
|
(0.7)
|
3
|
(9.1)
|
|
Nonferrous foundries, except aluminum and copper (SIC 3369, NAICS 331528)
|
41
|
(0.7)
|
6
|
(14.6)
|
38
|
(0.8)
|
3
|
(7.9)
|
|
Construction
|
|
|
|
|
|
|
|
|
|
Painting and paper hanging (SIC 1721, NAICS 237310 part, 238320 part)
|
453
|
(7.4)
|
142
|
(31.3)
|
314
|
(6.3)
|
85
|
(27.1)
|
|
Bridge, tunnel, and elevated highway construction (SIC 1622, NAICS 237310 part, 237990 part)
|
78
|
(1.3)
|
11
|
(14.1)
|
131
|
(2.6)
|
33
|
(25.2)
|
|
Special trade contractors NEC (SIC 1799, various NAICS codes in construction and services)
|
52
|
(0.9)
|
5
|
(9.6)
|
76
|
(1.5)
|
20
|
(26.3)
|
|
Heavy construction, NEC (SIC 1629, various NAICS codes in construction)
|
36
|
(0.6)
|
5
|
(13.9)
|
49
|
(1.0)
|
10
|
(20.4)
|
|
Metal mining
|
|
|
|
|
|
|
|
|
|
Lead and zinc ores (SIC 1031, NAICS 212231)
|
393
|
(6.5)
|
58
|
(14.8)
|
242
|
(4.8)
|
19
|
(7.9)
|
|
Trade
|
|
|
|
|
|
|
|
|
|
Scrap and waste materials (SIC 5093, NAICS 423930, 425110 part, 425120 part)
|
81
|
(1.3)
|
19
|
(23.5)
|
44
|
(0.9)
|
4
|
(9.1)
|
|
Other industries and unavailable information on industry¶
|
1,241
|
(20.4)
|
204
|
(16.4)
|
1,087
|
(21.7)
|
214
|
(19.7)
|
|
Total exposed at work
|
6,081
|
(100.0)
|
918
|
(15.1)
|
4,998
|
(100.0)
|
668
|
(13.4)
|
|
Nonoccupational
|
|
|
|
|
|
|
|
|
|
Shooting firearms (target shooting)
|
120
|
(35.6)
|
19
|
(15.8)
|
105
|
(32.0)
|
23
|
(21.9)
|
|
Remodeling/Renovation/Painting
|
37
|
(11.0)
|
12
|
(32.4)
|
34
|
(10.4)
|
8
|
(23.5)
|
|
Retained bullets (gunshot wounds)
|
20
|
(5.9)
|
9
|
(45.0)
|
29
|
(8.8)
|
6
|
(20.7)
|
|
Casting (e.g., bullets and fishing weights)
|
26
|
(7.7)
|
7
|
(26.9)
|
20
|
(6.1)
|
9
|
(45.0)
|
|
Eating food containing lead
|
16
|
(4.7)
|
10
|
(62.5)
|
27
|
(8.2)
|
11
|
(40.7)
|
|
Pica (eating nonfood items)
|
14
|
(4.2)
|
4
|
(28.6)
|
13
|
(4.0)
|
8
|
(61.5)
|
|
Complementary and alternative medicines (e.g., Ayurvedic medicines)
|
9
|
(2.7)
|
6
|
(66.7)
|
7
|
(2.1)
|
3
|
(42.9)
|
|
Retired**
|
7
|
(2.1)
|
2
|
(28.6)
|
7
|
(2.1)
|
0
|
(0.0)
|
|
Other nonoccupational exposure
|
37
|
(11.0)
|
3
|
(8.1)
|
21
|
(6.4)
|
7
|
(33.3)
|
|
Nonoccupational source of exposure unavailable
|
51
|
(15.1)
|
17
|
(33.3)
|
65
|
(19.8)
|
21
|
(32.3)
|
|
Total exposed at places other than work
|
337
|
(100.0)
|
89
|
(26.4)
|
328
|
(100.0)
|
96
|
(29.3)
|
|
Total unknown exposure source
|
2,032
|
|
357
|
(17.6)
|
1,786
|
|
282
|
(15.8)
|