|
TABLE 1. Number and rate of fatal aviation occupational crashes and associated fatalities --- Alaska, 2000--2004, 2005--2009, and 2010 |
|||
|---|---|---|---|
|
Event |
2000--2004 |
2005--2009 |
2010 |
|
Fatal occupational crashes |
32 |
16 |
6 |
|
Rate |
6.5* |
4.4* |
|
|
Per year |
6† |
3† |
|
|
Occupational fatalities |
53 |
25 |
12 |
|
Rate |
10.8* |
6.9* |
|
|
Per year |
11† |
5† |
|
|
* Rate per 1 million departures for air carrier, air taxi and commuter, and general aviation operations based on Federal Aviation Administration Terminal Area Forecast data, available at http://aspm.faa.gov/main/taf.asp. † Average for 5-year interval. |
|||
Persons using assistive technology might not be able to fully access information in this file. For assistance, please send e-mail to: mmwrq@cdc.gov. Type 508 Accommodation and the title of the report in the subject line of e-mail.
Occupational Aviation Fatalities --- Alaska, 2000--2010
Aircraft crashes are the second leading cause of occupational deaths in Alaska; during the 1990s, a total of 108 fatal aviation crashes resulted in 155 occupational fatalities (1). To update data and identify risk factors for occupational death from aircraft crashes, CDC reviewed data from the National Transportation Safety Board (NTSB) and the Alaska Occupational Injury Surveillance System. During 2000--2010, a total of 90 occupational fatalities occurred as a result of 54 crashes, an average of five fatal aircraft crashes and eight fatalities per year. Among those crashes, 21 (39%) were associated with intended takeoffs or landings at landing sites not registered with the Federal Aviation Administration (FAA). Fifteen crashes (28%) were associated with weather, including poor visibility, wind, and turbulence. In addition, 11 crashes (20%) resulted from pilots' loss of aircraft control; nine (17%) from pilots' failure to maintain clearance from terrain, water, or objects; and seven (13%) from engine, structure, or component failure. To reduce occupational fatalities resulting from aircraft crashes in the state, safety interventions should focus on providing weather and other flight information to increase pilots' situational awareness, maintaining pilot proficiency and decision-making abilities, and expanding the infrastructure used by pilots to fly by instruments.
CDC reviewed reports from its Alaska Occupational Injury Surveillance System (AOISS) and information from the NTSB accident database* to identify risk factors for occupational deaths. A case was defined as a fatal occupational traumatic injury in an aircraft crash during 2000--2010 that was reported in Alaska and investigated by NTSB. AOISS contains information on all fatal occupational traumatic injuries that occur in Alaska. Only cases that meet the criteria for an occupational fatality using established guidelines for injury at work are included (2). NTSB is mandated by Congress to investigate civilian transportation incidents and crashes, determine probable causes, and issue safety recommendations. NTSB reports include information on aircraft, crash circumstances, pilots and crew, and a narrative outlining contributing factors. Crashes are "accidents," defined by the NTSB as "an occurrence associated with the operation of an aircraft which takes place between the time any person boards the aircraft with the intention of flight and all such persons have disembarked, and in which any person suffers death or serious injury, or in which the aircraft receives substantial damage."† Military crashes and crashes of aircraft that are not registered in a civil aviation registry (such as ultralights) routinely are not investigated.
Rates for the number of departures were calculated using data from the FAA Terminal Area Forecast summary report for the Alaska region for 2000--2010.§ FAA air traffic control towers and radar approach control facilities record aircraft operations (takeoffs and landings). Aircraft operations at contracted air traffic control towers and nontowered airports are estimated. For this report, the number of departures was calculated as operations (takeoffs + landings) divided by two. FAA reports aviation operations by fiscal year (i.e., October through September). Fatalities are reported by calendar year. Data on fatalities from each calendar year were paired with operations data from corresponding fiscal years.
During 2000--2010, 54 aircraft crashes involving fatalities occurred in Alaska, resulting in 90 occupational deaths (Figure). The mean age of victims was 44 years (range: 20--73 years), and 79 (88%) of the victims were male. Of those persons who died, 53 (59%) were occupational pilots. Mean total flight hours (when available) for pilots in command (n = 43) was 7,798 hours. The most common occupations of the nonpilot victims were management (11); installation, service, and repair (seven); personal care/service occupations, including tour guides (six); and protective service occupations (four). Fixed wing aircraft were involved in 48 (89%) of the crashes and six (11%) involved helicopters. Most (65%) crashes occurred during May--September; 48% of crashes occurred during the hours of 12:01 p.m. and 6:00 p.m.
The numbers and rates of occupational fatal crashes and deaths that occurred during 2005--2009 were lower than those during 2000--2004 (Table 1). The crash rate declined 32%, from 6.5 to 4.4 crashes per 1 million departures. The fatality rate decreased 36%, from 10.8 to 6.9 per 1 million departures. However, in 2010, numbers were higher than the previous yearly average, with six occupational fatal crashes resulting in 12 deaths. A review of the departure locations and destinations revealed that 21 (39%) fatal crashes were associated with intended takeoffs or landings at non-FAA--registered landing sites, such as gravel bars, snow fields, lakes, and temporary airstrips. The other 33 (61%) crashes were associated with intended takeoffs and landings at FAA-registered airports. The leading causes of fatal crashes, by numbers of crashes, were 15 (28%) encounters with adverse weather; 11 (20%) pilots' loss of control; nine (17%) pilots' failure to maintain clearance from terrain, water or objects; and seven (13%) from engine, structure, or component failure (Table 2). Causes are undetermined for three crashes with missing aircraft, and not yet determined for all 2010 crashes.
Reported by
Mary O'Connor, MS, Jennifer Lincoln, PhD, George A. Conway, MD, Alaska Pacific Regional Office, National Institute for Occupational Safety and Health, CDC. Corresponding contributor: Mary O'Connor, mboconnor@cdc.gov, 907-271-1571.
Editorial Note
To reduce the state's high number and rate of aircraft crashes in the 1990s CDC's National Institute for Occupational Safety and Health (NIOSH), NTSB, FAA, the National Weather Service (NWS), and the Alaska aviation industry started the Alaska Interagency Aviation Safety Initiative (AIASI). Several interventions were implemented, including the FAA Capstone program (3), which funded the purchase and installation of avionics equipment in commercial aircraft based in southwestern and southeastern Alaska and provided training in its use. This equipment provides terrain, air traffic, and weather information to pilots. FAA also has funded the installation of 150 weather cameras in mountain passes and remote locations throughout Alaska. These images are transmitted sequentially via the Internet.¶ The NWS and FAA mike-in-hand program provides current weather information to pilots in the air (4), and the FAA Circle of Safety program helps educate passengers on their responsibilities for safe flight (5). The Medallion Foundation is a nonprofit organization created to raise safety standards and foster a culture of safety among operators and pilots.**
In the 1990s, NIOSH determined that crashes into terrain and flying from good weather into conditions of poor visibility were strongly associated (6). Interventions developed as part of AIASI focused on improving the industry's safety culture and provided tools to avoid flight into poor visibility conditions. These various interventions have been effective in reducing fatalities (3); however, adverse weather continues to be a risk factor for fatal crashes. Loss of control, failure to maintain clearance, and aircraft structure or component failure also are risk factors. Crashes resulting from loss of aircraft control, failure to maintain clearance from terrain and objects, failure of aircraft structure and components, failure to follow published procedures, and improper use of landing gear might be associated with pilot proficiency and decision making. Crashes since 2000 commonly were associated with flights to or from non-FAA--registered landing sites. These locations often are in remote areas of Alaska having limited weather information and minimal or no emergency equipment. Alaska's vast area, lack of roads, mountainous terrain, adverse weather conditions, and limited coverage by air traffic control, plus the use of airstrips and nonestablished landing fields, increase flight safety risks. Continued safety interventions that increase access to weather information, pilot proficiency, and instrument flight capabilities are needed to contend with the unique flying hazards found in Alaska.
The findings in this report are subject to at least two limitations. First, departure data were used as a denominator to measure flight activity, but these data are not a precise representation of worker exposure. The number of flight hours logged by workers traveling as part of their job or to their jobsites would give more precise measure of worker exposure. Second, departure data are obtained through reports to air traffic control towers and radar approach control facilities and estimated for nontowered airports included in FAA's National Plan of Integrated Airport Systems (NPIAS). Operations at non-FAA--registered landing sites and airports not listed in NPIAS are not included in the estimates.
In October 2010, approximately 200 members of the Alaska aviation community met to acknowledge the seriousness of the increased number of crashes in 2010, to explore solutions, and to identify resources to advance aviation safety in Alaska. Six vital items were identified by workgroups and persons at the meeting: pilot proficiency, access to weather information, Capstone avionics equipment, runway maintenance, fuel availability, and increased infrastructure support for instrument flight navigation (7). Further safety interventions should continue to focus on providing weather and other information to increase pilots' situational awareness, maintaining pilot proficiency and decision-making ability regardless of experience, ratings and flight hours, and providing infrastructure to allow pilots to fly by instruments.
Acknowledgments
National Transportation Safety Board. Federal Aviation Admin. National Weather Svc. Medallion Foundation. Alaska Air Carriers Assoc, Alaska Airmen's Assoc, Univ of Alaska Anchorage Aviation Technology Div, State of Alaska.
References
- National Institute of Occupational Safety and Health. Surveillance and prevention of occupational injuries in Alaska: a decade of progress, 1990--1999. Atlanta, GA: US Department of Health and Human Services, CDC, National Institute of Occupational Safety and Health; 2002. Available at http://www.cdc.gov/niosh/docs/2002-115. Accessed June 21, 2011.
- CDC. Fatal injuries to civilian workers in the United States, 1980--1995. Cincinnati, OH: US Department of Health and Human Services, CDC, National Institute for Occupational Safety and Health; 2001. NIOSH publication no. 2001-129. Available at http://www.cdc.gov/niosh/docs/2001-129/2001129pd.html.
- Herrick P, Murphy P, editors. 2005. The impact of Capstone Phase 1 Program: final report. Anchorage, AK: University of Alaska Anchorage; 2005.
- LaBelle JD. Testimony during an oversight hearing on Alaska aviation issues for the 21st century. In: Hearings before a subcommittee of the Committee on Appropriations, US Senate, 106th Congress, second session, on H.R. 4475, 5394, and S. 2720. S. Hrg. 106-921. Washington, DC: US Government Printing Office; 2001. Available at http://www.gpo.gov/fdsys/pkg/CHRG-106shrg62808/pdf/CHRG-106shrg62808.pdf. Accessed June 28, 2011.
- Federal Aviation Administration. Circle of Safety---information for passengers: Alaska Region Flight Standards, FAA; 2009. Available at http://www.faa.gov/about/office_org/headquarters_offices/avs/offices/afs/divisions/alaskan_region/circleofsafety. Accessed March 25, 2011.
- Thomas TK, Bensyl DM, Manwaring JC, Conway GA. Controlled flight into terrain accidents among commuter and air taxi operators in Alaska. Aviat Space Environ Med 2000;71:1098--103.
- Rock GH. Alaska Aviation Safety Summit follow-up. Anchorage, AK: Alaska Air Carriers Association; 2011. Available at http://www.alaskaaircarriers.org/servlet/download?id=423. Accessed June 29, 2011.
* Available at http://www.ntsb.gov/aviationquery/index.aspx.
† Definitions, 49 C.F.R. Sect. 830.2 (1995).
§ Available at http://aspm.faa.gov/main/taf.asp.
¶ Information available at http://akweathercams.faa.gov.
** Information available at http://www.medallionfoundation.org.
What is already known on this topic?
Aircraft crashes are the second leading cause of occupational fatalities in Alaska.
What is added by this report?
Occupational aviation safety in Alaska has improved, with the fatal crash rate decreasing 32% from the first to the second half of 2000--2009. The higher than average number of crashes in 2010 call for continued efforts to identify risk factors, develop interventions, and promote safety. The most frequent causes of fatal occupational aircraft crashes include encounters with weather, pilots' loss of aircraft control, failure to maintain clearance from terrain, and aircraft structure or component failure.
What are the implications for public health practice?
Safety interventions should continue to focus on providing weather information and improving pilots' situational awareness, and on enhancing airport infrastructure to allow pilots with appropriate equipment and experience to fly by instruments; proficiency in piloting skills and aeronautical decision making should be emphasized for pilots regardless of experience, ratings, and flight hours.
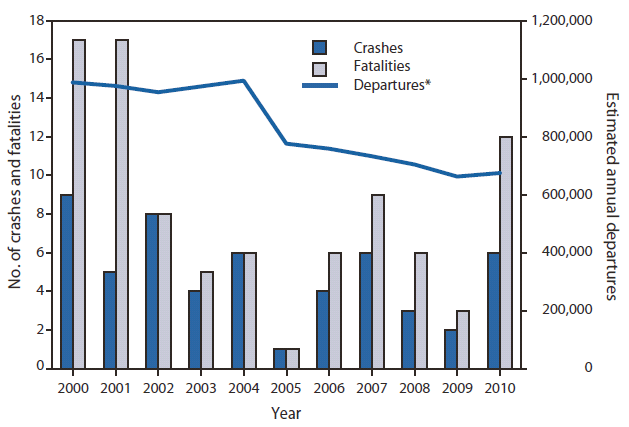
* Based on Federal Aviation Administration Terminal Area Forecast data.
Alternate Text: The figure above shows the number of fatal aircraft crashes, associated fatalities, and departures in Alaska during 2000-2010, when 54 fatal crashes resulted in 90 occupational deaths.
Use of trade names and commercial sources is for identification only and does not imply endorsement by the U.S. Department of
Health and Human Services.
References to non-CDC sites on the Internet are
provided as a service to MMWR readers and do not constitute or imply
endorsement of these organizations or their programs by CDC or the U.S.
Department of Health and Human Services. CDC is not responsible for the content
of pages found at these sites. URL addresses listed in MMWR were current as of
the date of publication.
All MMWR HTML versions of articles are electronic conversions from typeset documents.
This conversion might result in character translation or format errors in the HTML version.
Users are referred to the electronic PDF version (http://www.cdc.gov/mmwr)
and/or the original MMWR paper copy for printable versions of official text, figures, and tables.
An original paper copy of this issue can be obtained from the Superintendent of Documents, U.S.
Government Printing Office (GPO), Washington, DC 20402-9371;
telephone: (202) 512-1800. Contact GPO for current prices.
**Questions or messages regarding errors in formatting should be addressed to
mmwrq@cdc.gov.
