FIGURE. Timeline of events during an extended water loss emergency --- two communities,* Alabama, January 2010
Persons using assistive technology might not be able to fully access information in this file. For assistance, please send e-mail to: mmwrq@cdc.gov. Type 508 Accommodation and the title of the report in the subject line of e-mail.
Community Health Impact of Extended Loss of Water Service --- Alabama, January 2010
Access to clean water is fundamental to good health (1). During January 2010, approximately 18,000 residents of two predominantly rural counties in Alabama lost access to municipal water for up to 12 days after below-freezing temperatures led to breaks in water mains and residential water pipes and caused widespread systemic mechanical failures. To assess potential health impacts, use of alternative water sources, and effectiveness of the emergency response, the Alabama Department of Public Health (ADPH) invited CDC to assist in an investigation that included a survey of 470 households representing 1,283 residents and a qualitative investigation (i.e., focus group discussions and interviews with key informants). This report summarizes the results of that investigation, which found a significantly higher prevalence of acute gastrointestinal illness (AGI) among residents of households that lost both water service and water pressure (adjusted odds ratio [AOR] = 2.6), that lost water service for ≥7 days (AOR = 2.4), and that lost water pressure for ≥7 days (AOR = 3.5). Significant dose-response relationships were observed between increased duration of lost water service or pressure and AGI. The survey and qualitative investigation revealed that households, communities, water utilities, and institutions were not adequately prepared for water emergencies in areas of communication and notification, planning for alternative water sources, and interagency coordination. Health effects from loss of water supply or water pressure might be mitigated by public health involvement in fostering household, community, and interagency preparedness, and developing communication strategies that will reach the majority of citizens in a timely manner.
Community A and community B are located in two contiguous, predominantly rural counties in southwestern Alabama, served primarily by three interconnected public water utilities. Because freezing conditions are rare in this area, few building code regulations require burial or insulation of residential water pipes. During January 4--11, 2010, overnight low temperatures ranged from 12°F to 22°F (-11°C to -6°C), causing many utility water mains and residential water pipes to break. The resulting systemic water loss and related mechanical failures forced water utilities to cut off service to most households in the two communities (Figure). Local ADPH offices did not learn about the water shortages until January 10 in community A, when a resident complained about restaurants operating without water, and January 11 in community B, when an ADPH nurse found a school operating without water. Subsequently, ADPH issued boil water advisories for both communities. Three agencies were involved in supplying emergency water to the affected communities: the Alabama Emergency Management Agency provided five truckloads of bottled water to community A and one truckload to community B; the National Guard delivered nonpotable water to community A; and ADPH deployed water filtration/UV disinfection units to both communities.
Household Survey
During February 26--March 9, 2010, CDC and ADPH conducted a household survey to assess the extent of the water emergency and its effect on public health. A stratified random sample of addresses was drawn from community A, community B, and two additional communities in the same area that were presumed to be unaffected by the water emergency.* Each of the sampling areas included a mixture of unaffected and affected households. The entire population was analyzed together in a cross-sectional survey, and results in this report are in aggregate unless otherwise noted.
In-person interviews were conducted with one adult who resided in each home throughout January, normally received municipal water service, and provided oral consent. Each respondent answered questions regarding normal household water service and January water service interruptions, including loss of service,† loss of pressure,§ and availability and use of emergency water sources. Each respondent also provided data regarding every household member, regardless of age, including information on demographics, chronic health conditions, and whether or not household members had experienced acute illnesses during January 4--31, 2010. The primary outcomes of interest were AGI¶ and acute respiratory illness** (ARI). Data on skin and eye complaints also were collected.
Prevalence of self-reported illness by self-reported water service disruption category was calculated, as were odds ratios (ORs), AORs, and 95% confidence intervals to evaluate the association between water service disruptions and illness. Using the chi square test, associations between duration of water service interruptions and illness outcomes were tested for linear trends. Of 900 randomly selected households, approximately one third were excluded (e.g., because of a vacant home or no municipal water service), leaving 610 (68%) that were eligible for inclusion. Of those, a respondent in 470 (77%) households completed the survey, providing data on 1,283 persons. Median age of the 1,283 was 36 years (range: 0--94 years), and 54% were female; 55% were black, and 44% were white. Demographic characteristics of respondents were similar to census data for both counties.
Among households with no loss of water service or pressure, AGI was reported for 13 (4.3%) residents during January 4--31. AGI was associated with combined loss of water service and pressure (67 residents [12.4%], AOR = 2.6), loss of service ≥7 days (46 [13.2%], AOR = 2.4), and loss of pressure ≥7 days (23 [15.6%], AOR = 3.5) and 3--6 days (30 [12.7%], AOR = 2.8). Dose-response relationships were evident for the duration of both loss of service and loss of pressure (p for trend = 0.03 and 0.002, respectively) (Table).
The prevalence of ARI among unaffected households was 13.9%. Although individual AORs were not statistically significant, reporting of ARI increased with increasing duration of loss of pressure (1--2 days, 12.8%; 3--6 days, 20.5%; ≥7 days, 22.8%; p-value for trend = 0.04). Loss of water service was not associated with ARI. A total of 25 persons (1.6%) reported skin complaints, and 15 (1.0%) reported eye complaints; these outcomes were not significantly associated with loss of service or pressure.
Of the 470 surveyed households, 108 (23%) reported water pipe breaks as a result of the January freeze. A total of 210 (45%) of the 470 households had any water stored for emergencies, and <10% had stored >5 gallons. Among households in community A and community B, which were under a boil water advisory, residents in 90% of the households had heard about the advisory. However, <50% heard about it at the beginning of the water emergency, and 30% reported drinking unboiled tap water. In community B, residents in 40% of the households said they heard about the boil water advisory from family, friends, or neighbors, and not from official sources. In both community A and community B, residents preferred to hear emergency information via telephone (73.4% and 59.1%, respectively), television (37.4% and 42.4%), or radio (42.4% and 24.2%), compared with informal sources such as friends and neighbors (15.1% and 9.1%) (preferences were not mutually exclusive).
Qualitative Investigation
A concurrent qualitative investigation was conducted, including focus group discussions with members of the community, emergency responders, and government officials, as well as interviews with key informants from institutions (e.g., restaurants, schools, and health-care facilities). No health-care facilities or public health agencies identified any clusters of illness, and focus group participants did not attribute illnesses to the water emergency. Like respondents in the household survey, focus group participants described insufficient household preparedness and said they preferred receiving emergency information via telephone from official sources. Emergency responders and government officials indicated that the two communities were not sufficiently prepared for the intensity and duration of the water emergency; many officials said they thought their communities would be most effectively served by word-of-mouth communication. In general, community emergency preparedness planning had not included collaboration with water utilities, plans had not outlined a clear chain-of-command structure and boil water notification procedures, and emergency water distribution did not meet the needs of vulnerable populations, such as senior citizens, persons with disabilities, and those with limited financial or transportation resources. As a result of this investigation, CDC prepared recommendations for public health involvement in water emergency preparedness (Box).
Reported by
B Etheridge, T Porter, J Holliday, R Underwood, MS, C Woernle, MD, Alabama Dept of Public Health. L Zajac, MD, Montefiore Medical Center, New York City, New York. M Morrison, MPH, Office of Public Health Preparedness and Response, J Brunkard, PhD, Div of Foodborne, Waterborne, and Environmental Diseases, National Center for Emerging and Zoonotic Infectious Diseases; M Miller, MPH, C Otto, MPA, Div of Emergency and Environmental Health Svcs, National Center for Environmental Health; A Hightower, PhD, A Wolkon, MPH, Div of Parasitic Diseases and Malaria, Center for Global Health; J Gargano, PhD, A Freeland, PhD, EIS officers, CDC.
Editorial Note
In this investigation, the prevalence of AGI in households unaffected by the January 2010 water emergency (4.3%) was similar to the national 1-month background prevalence (5.1%) of acute diarrheal illness identified in FoodNet population surveys (2), whereas the prevalence of AGI in the most affected households was significantly higher (12.4%--15.6%). Of 780 drinking water--associated outbreaks reported in the United States during 1971--2006, 10% were associated with water distribution system deficiencies (3). Although a limited number of epidemiologic studies have investigated the association between low water pressure and illness, some have identified increased AGI in populations experiencing low water pressure (4--6). Even without loss of water service, brief periods of low pressure lasting only seconds (pressure transients) can draw contaminants into the distribution system through numerous cracks and leaks in water pipes (7) or back-siphonage from household plumbing systems that lack adequate backflow prevention devices. The findings from this investigation suggest that additional studies are needed to assess the prevalence of waterborne disease attributable to water distribution systems.
The findings in this report are subject to at least three limitations. First, because the investigation began approximately 6 weeks after the onset of the water emergency, detailed information regarding the periods of loss of water service or water pressure and the dates of illness onset could not be collected; thus, their temporal order is uncertain. Second, no clinical specimens or environmental samples were collected to corroborate illness, identify responsible pathogens, and determine the precise cause of increased AGI in affected households. Although consuming contaminated water might have been responsible, altered hygiene and sanitary practices related to household water shortages (8) or changes in activities could have contributed to increased incidence of AGI. Finally, because the household survey relied on self-report for both water service events and illnesses, some of the findings might be subject to recall bias. However, concerns regarding bias are mitigated somewhat by the specificity of the associations with AGI and the dose-response relationships observed.
Households, institutions, and communities were not adequately prepared for the water emergency that affected Alabama communities in January 2010. In part because of an aging water infrastructure, approximately 240,000 water main breaks, which can allow contaminants to enter the drinking water supply, occur in the United States each year (9,10). Public investment in improved drinking water infrastructure is critically important to protecting public health. Health effects from loss of water service or low water pressure might be mitigated by public health involvement in fostering household, community, and interagency preparedness, and developing communication strategies that will reach the majority of citizens in a timely manner. Additional information regarding preparedness and communications during water emergencies is available at http://www.cdc.gov/healthywater/emergency/preparedness/before.html.
Acknowledgments
The findings in this report are based, in part, on contributions by J Bender, N Bradford, K Bush, R Carpenter, MSW, M Clinkscales, J Coleman, B Cooper, S Davidson, MPH, C Detlefsen, R Elliot, MPH, GB Fisher, J Guerry, T Hatch, MPA, B Hollinger, D Johnson, S Johnson, B Jowers, D Kelly, C Kent, K Kiser, S McDaniel, A Mullins, MPA, M Nowlin, A Oliveira, DrPH, E Phillips, T Pippin, J Pope, P Pugh, N Quinney, MSW, H Railey, D Rhone, P Roberts, B Robinson, J Roley, J Roberts, F Sheffield, J Skinner, MPH, A Smith, MPH, H Steadham, K Stevens, MS, J Strother, T Syphrit, S Terrell, MSW, B Webb, J Wade, S Wood, M Woodfin, D Wysmulek, R Spencer, Alabama Dept of Public Health; A Wendel, MD, L Brown, PhD, K Delea, MPH, Div of Emergency and Environmental Health Svcs, National Center for Environmental Health; E Ailes, PhD, S Collier, MPH, J Yoder, MPH, MJ Beach, PhD, Div of Foodborne, Waterborne, and Environmental Diseases, National Center for Emerging and Zoonotic Infectious Diseases; and B Person, PhD, Office of the Director, National Center for Emerging and Zoonotic Infectious Diseases, CDC.
References
- World Health Organization. Guidelines for drinking-water quality. 3rd ed. Geneva, Switzerland: World Health Organization; 2008. Available at http://www.who.int/water_sanitation_health/dwq/fulltext.pdf. Accessed February 14, 2011.
- Jones TF, McMillian MB, Scallan E, et al. A population-based estimate of the substantial burden of diarrhoeal disease in the United States; FoodNet, 1996--2003. Epidemiol Infect 2007;135:293--301.
- Craun GF, Brunkard JM, Yoder JS, et al. Causes of outbreaks associated with drinking water in the United States from 1971 to 2006. Clin Microbiol Rev 2010;23:507--28.
- Hunter PR, Chalmers RM, Hughes S, Syed Q. Self-reported diarrhea in a control group: a strong association with reporting of low-pressure events in tap water. Clin Infect Dis 2005;40:e32--4.
- Nygard K, Wahl E, Krogh T, et al. Breaks and maintenance work in the water distribution systems and gastrointestinal illness: a cohort study. Int J Epidemiol 2007;36:873--80.
- Payment P, Siemiatycki J, Richardson L, Renaud G, Franco E, Prevost M. A prospective epidemiological study of gastrointestinal health effects due to the consumption of drinking water. Int J Environ Health Res 1997;7:5--31.
- LeChevallier MW, Gullick RW, Karim MR, Friedman M, Funk JE. The potential for health risks from intrusion of contaminants into the distribution system from pressure transients. J Water Health 2003;1:3--14.
- Hennessy TW, Ritter T, Holman RC, et al. The relationship between in-home water service and the risk of respiratory tract, skin, and gastrointestinal tract infections among rural Alaska natives. Am J Public Health 2008;98:2072--8.
- Kirmeyer G, Richards W, Smith C. An assessment of water distribution systems and associated research needs. Denver, CO: American Water Works Association Research Foundation; 1994.
- American Water Works Association. Dawn of the replacement era: reinvesting in drinking water infrastructure. Denver, CO: American Water Works Association; 2001. Available at http://www.win-water.org/reports/infrastructure.pdf. Accessed February 14, 2011.
* Although the two additional communities were thought to be unaffected by the water emergency and were not subject to boil water advisories, survey results indicated that 17.4% and 43.3% of households in the additional sampling areas reported low water pressure, compared with 76.7% of households in community A and 71.0% of households in community B, and 7.0% and 13.3% of households in the additional sampling areas reported loss of water service, compared with 56.5% of households in community A and 89.4% of households in community B.
† Defined as a period during which the household's water supply completely ceased.
§ Defined as a period when the household's water pressure was lower than usual, but water service did not completely cease.
¶ Defined as new onset of diarrhea or vomiting, with diarrhea defined as three or more loose stools in a 24-hour period during January 4--January 31, 2010.
** Defined as new onset of cold or flu symptoms during January 4--January 31, 2010.
What is already known on this topic?
Studies in other countries have identified an association between low pressure events in water distribution systems and gastrointestinal illness; the aging water infrastructure in the United States might increase the risk for similar health effects during main breaks or water-related emergencies that cause loss of pressure throughout the water distribution system.
What is added by this report?
In January 2010, in two Alabama communities, persons in households that experienced extended water service interruption were more likely to report acute gastrointestinal illness (AGI) than members of unaffected households; this association was particularly significant among persons in households that experienced ≥7 days of loss of water pressure (15.6% reporting AGI), compared with those unaffected by the water emergency (4.3% reporting AGI).
What are the implications for public health practice?
Public health agencies might help to prevent or mitigate the health effects from future water emergencies through efforts to improve community and household preparedness and to develop and implement effective communication strategies to reach diverse communities before and during such emergencies.
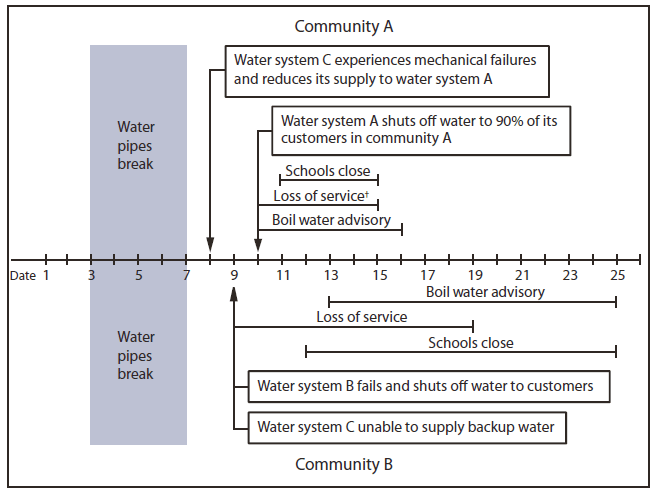
* Water system A is owned by community A and normally supplies one fouth of community A's water. In 2009, water system A had reduced its storage levels by 50% to meet regulatory standards on chlorination by-products. Water system B is owned by community B and normally supplies all of community B's water. Water system C is owned by a nearby community and normally supplies three fourths of community A's water and is the designated backup supplier for community B in the event of a water shortage.
† Defined as a period during which the household's water supply completely ceased. Periods are approximate.
Alternate Text: The figure above shows the timeline of events during an extended water loss emergency in January 2010 in two Alabama communities. Sub-freezing overnight low temperatures caused many utility water mains and residential water pipes to break. The resulting systemic water loss and related mechanical failures forced water utilities to cut off service to most households in the two communities.
Use of trade names and commercial sources is for identification only and does not imply endorsement by the U.S. Department of
Health and Human Services.
References to non-CDC sites on the Internet are
provided as a service to MMWR readers and do not constitute or imply
endorsement of these organizations or their programs by CDC or the U.S.
Department of Health and Human Services. CDC is not responsible for the content
of pages found at these sites. URL addresses listed in MMWR were current as of
the date of publication.
All MMWR HTML versions of articles are electronic conversions from typeset documents.
This conversion might result in character translation or format errors in the HTML version.
Users are referred to the electronic PDF version (http://www.cdc.gov/mmwr)
and/or the original MMWR paper copy for printable versions of official text, figures, and tables.
An original paper copy of this issue can be obtained from the Superintendent of Documents, U.S.
Government Printing Office (GPO), Washington, DC 20402-9371;
telephone: (202) 512-1800. Contact GPO for current prices.
**Questions or messages regarding errors in formatting should be addressed to
mmwrq@cdc.gov.
