Persons using assistive technology might not be able to fully access information in this file. For assistance, please send e-mail to: mmwrq@cdc.gov. Type 508 Accommodation and the title of the report in the subject line of e-mail.
Decrease in Smoking Prevalence --- Minnesota, 1999--2010
Following the landmark 1998 settlement of the lawsuit, State of Minnesota versus Philip Morris, Inc., et al., Minnesota implemented a series of tobacco control efforts to limit the harm caused by tobacco use. In 2001, quitline services for tobacco users without health insurance coverage for cessation services were introduced and statewide mass media campaigns publicizing them were initiated. In 2005, Minnesota imposed a $0.75 per pack tax on cigarettes, followed in 2009 by a $0.62 per pack increase in federal excise tax, contributing in large part to a more than $2 increase in the average price of cigarettes (1). In 2007, a comprehensive, statewide smoke-free law was passed. Using surveillance data from the Minnesota Adult Tobacco Survey (MATS) and cigarette pack sales data, this report examines the effects of these tobacco-related public health efforts. Compared with a 15% decline in national adult smoking prevalence since 1999, adult smoking prevalence in Minnesota decreased 27.1%, from 22.1% in 1999 to 16.1% in 2010. During the same period, per capita cigarette sales in Minnesota decreased 40%. In addition, in 2010 compared with 1999, a higher percentage of adults reported that smoking was restricted in their homes (87.2% versus 64.5%), and adults were less likely to report exposure to secondhand smoke (45.6% versus 67.2%). In the past decade, Minnesota has benefited from sustained tobacco control. Future progress in decreasing adult smoking and reducing exposure to secondhand smoke will depend on a concerted effort across the public health community to keep tobacco control a priority.
MATS is a telephone survey designed to collect data about tobacco use and attitudes from a representative sample of the entire civilian, noninstitutionalized adult population in Minnesota.* MATS was implemented in 1999 to measure the effects of tobacco-related policies and programs by monitoring trends in the use of tobacco products in the state. The fourth survey in this ongoing surveillance initiative was completed in 2010. Prior surveys were conducted in 1999, 2003, and 2007.
MATS uses rigorous survey methods, including computer-assisted telephone interviewing, consistent core questions, random-digit--dialing (RDD) sampling, and survey weighting based on available characteristics of the adult Minnesota population. MATS 2010 used a list-assisted RDD sampling method based on two statewide sample frames: all possible landline telephone numbers and all possible cellular telephone numbers. The sample design called for an adult to be selected at random from each household identified through the RDD screening process.
Several communications methods were used before and during data collection for the MATS 2010 sample. These included letters, an informational website, and contact numbers that potential respondents could call for information. These tools were designed to improve response rates and provide information about the survey. Consistent with other large-scale, telephone-based surveys, MATS telephone interviewers made a second attempt to secure cooperation by recontacting persons who initially declined to participate in the survey.
For the 2010 survey, 5,555 landline and 1,502 cellular telephone interviews were completed, for a total sample of 7,057 interviews. Based on American Association for Public Opinion Research methodology, the weighted landline and cellular telephone response rates were 45.0% and 44.5%, respectively, which reflect net response rates across both the prescreening eligibility questionnaire and MATS questionnaire. The Minnesota Department of Health Institutional Review Board reviewed and approved the MATS questionnaire, data collection, and data security procedures.
For the surveys, an adult current smoker was defined as a person aged ≥18 years who had smoked ≥100 cigarettes and currently smoked every day or some days. Those smokers were asked to estimate how many cigarettes they smoked. Heavy smoking was defined as ≥25 cigarettes per day, moderate smoking as 16--24 cigarettes per day, and light smoking as ≤15 cigarettes per day. To assess exposure to secondhand smoke, participants were asked several questions to determine whether, in the past 7 days, anyone had smoked near them in their workplace, car, home, or another location. In addition, MATS participants were asked to choose the statement that best described rules they follow about smoking inside their home. Smoking was either allowed anywhere, allowed in some places, or not allowed. Cigarette sales data were obtained from an annual compendium on tobacco revenue and statistics (1). Per capita consumption was calculated for both Minnesota and nationally for the years 1999 to 2009 by dividing the annual number of packs sold by the total population of Minnesota and the national population. National consumption calculations excluded cigarette sales in Minnesota. National smoking prevalence estimates were from the National Health Interview Survey (2).†
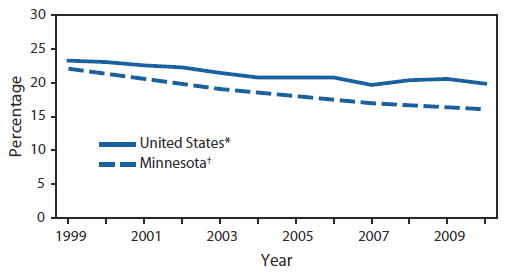
Based on MATS data, Minnesota adult smoking prevalence declined steadily from 22.1% in 1999 to 16.1% in 2010, a 27.1% decrease (Figure 1). The rate of decline was greatest during 1999--2003. During 2007--2010, smoking prevalence declined from 17.0% to 16.1%. By comparison, cigarette smoking declined nationally from 23.3% in 1999 to 19.9% in 2010. However, the national rate remained essentially unchanged from 2004 to 2010 (2).
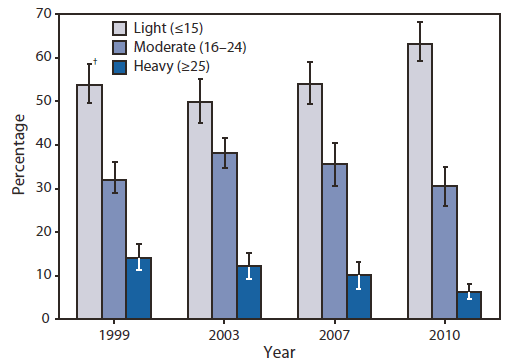
Significant (p<0.05) changes in smoking behavior also occurred in Minnesota during the past decade, based on t tests and chi-square tests. The daily average number of cigarettes smoked by current smokers decreased from 14.3 in 1999 to 12.2 in 2010. In addition, the proportion of current smokers who smoked ≥25 cigarettes per day decreased steadily, from 14.3% in 1999 to 6.3% in 2010 (Figure 2). From 2007 to 2010, the proportion of current smokers who smoked ≤15 cigarettes per day increased from 54.1% to 63.2%.
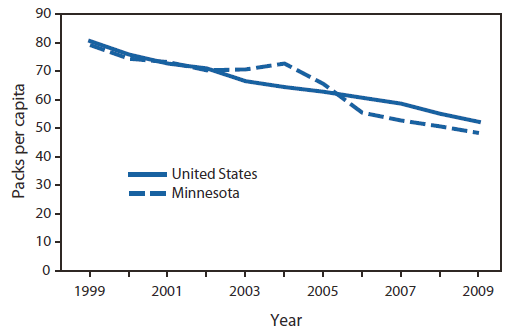
The decrease in both smoking prevalence and cigarettes smoked per day corresponds with a decrease in sales of cigarettes. Per capita cigarette pack sales in Minnesota decreased 40% from 1999 to 2009 (Figure 3). Nationally, per capita cigarette pack sales have fallen steadily and, as of 2009, were 35% lower than in 1999. In addition, the percentage of Minnesota residents who reported that someone had smoked near them in the past 7 days in any location dropped steadily from 67.2% in 2003, before any large municipalities banned indoor smoking, to 56.7% just before the statewide ban, to 45.6% in 2010. In addition to the increase in smoke-free workplaces brought about by the statewide ban, more Minnesota residents reported smoke-free rules in their homes. In 2010, 87.2% reported that smoking was not allowed anywhere inside their home. This is a significant increase from 64.5% in 1999, and follows previous increases documented in 2003 (74.8%) and 2007 (83.2%).
Reported by
RG Boyle, PhD, AW St. Claire, MPH, M Whittet, MPH, J D'Silva, MPH, JK Lee, PhD, ClearWay Minnesota, Minneapolis; AM Kinney, PhD, P Rode, MA, Minnesota Dept of Health.
Editorial Note
The decline in the percentage of adult Minnesota residents who smoke, the reduction in number of cigarettes smoked, the reported reduction in exposure to secondhand smoke, and the increase in smoke-free homes collectively suggest a favorable shift in the tobacco use behaviors and practices of Minnesota adults. These encouraging trends occurred during a decade of tobacco control policy advances in Minnesota. These policies included enactment of local smoke-free ordinances and a comprehensive statewide smoke-free law, cigarette tax increases, mass media campaigns to promote cessation, and statewide provision of cessation services. In 2000, Moose Lake became the first city in Minnesota to adopt a smoke-free restaurant ordinance, followed by Duluth (3). By the end of 2006, the movement to ban indoor smoking had resulted in five counties and 10 cities in Minnesota enacting smoke-free ordinances,§ covering 38% of the state population. In May 2007, passage of the comprehensive, statewide Freedom to Breathe Act strengthened the Minnesota Clean Indoor Air Act.¶ The Freedom to Breathe Act required public places and workplaces, including bars and restaurants, to be smoke-free (4). Since 2004, the average price per pack of cigarettes in Minnesota has increased by more than $2.00, from $3.51 to $5.67 (1). This change in price included a state $0.75 health impact fee imposed in 2005 on every pack of cigarettes sold in Minnesota and a $0.62 per pack increase in the federal excise tax on cigarettes in 2009.
These policies have been supported by a decade-long mass media campaign designed to educate Minnesota residents about the dangers of tobacco use and to promote cessation. Minnesota smokers also have benefited from universal access to tobacco cessation services. ClearWay Minnesota, the nonprofit organization formed from Minnesota's settlement with the tobacco industry in 1998, developed a partnership with Minnesota's major health plans to provide quitline services to all Minnesota residents (5). As part of this partnership, health plans in Minnesota provide cessation services to their members and patients, and ClearWay Minnesota serves the underinsured and uninsured through the QUITPLAN Helpline. The telephone helpline was launched in 2001, and free pharmacotherapy was added in 2002. ClearWay Minnesota also began providing other cessation services in 2003, including face-to-face, worksite, and web-based programs.
Consistent with the recommendations outlined in CDC's Best Practices for Comprehensive Tobacco Control Programs (6), this combination of policies and programs has fostered a favorable shift in the behaviors and practices of Minnesota adults on cigarette smoking and exposure to secondhand smoke. The 27.1% decrease in adult smoking prevalence in Minnesota since 1999 represents an average annual decrease of 2.5%. This decline is similar to those seen in Maryland (2.5% annually during 1999--2009), California (3.1% annually during 1999--2009), and Massachusetts (2.2% annually during 1999--2009) after similar policies were implemented, but is less than New York City's 5.0% average annual decrease from 2002 to 2006 (7,8). Although Minnesota experienced a nonsignificant decline in prevalence from 2007 to 2010, the proportion of heavy smokers decreased significantly, indicating that the profile of smoking in Minnesota has shifted. The shift away from heavy smoking and toward light smoking has implications for tobacco-dependence treatment programs.
The findings in this report are subject to at least two limitations. First, the data rely on self-reported behaviors that might be subject to social desirability bias. Second, although the cigarette pack consumption data are based on reported state sales data, they do not take into account the proportion of smokers who purchase cigarettes over the Internet or from neighboring states.
In the past decade, Minnesota has benefited from a sustained tobacco control program and has experienced decreasing trends in adult cigarette smoking and reduced exposure to secondhand smoke. Future progress in reducing cigarette smoking and exposure to secondhand smoke will require a concerted effort across the public health community to continue to make the case that reduced tobacco consumption has broad benefits for society.
References
-
Orzechowski W, Walker RC. The tax burden on tobacco: historical compilation, vol. 44, 2009. Arlington, VA: Orzechowski and Walker; 2009.
-
CDC. Vital Signs: current cigarette smoking among adults aged ≥18 years---United States, 2009. MMWR 2010;59:1135--40.
-
Tsoukalas T, Glantz SA. The Duluth clean indoor air ordinance: problems and success in fighting the tobacco industry at the local level in the 21st century. Am J Public Health 2003;93:1214--21.
-
Brunswick M. New smoking ban. Star Tribune. September 30, 2007. Available at
http://www.startribune.com/local/11606746.html. Accessed February 2, 2010.
-
Schillo BA, Wendling A, Saul J, et al. Expanding access to nicotine replacement therapy through Minnesota's QUITLINE partnership. Tob Control 2007;16(Suppl 1):i37--41.
-
CDC. Best practices for comprehensive tobacco control programs---2007. Atlanta, GA: US Department of Health and Human Services, CDC; 2007. Available at
http://www.cdc.gov/tobacco/stateandcommunity/best_practices/pdfs/2007/bestpractices_complete.pdf. Accessed February 9, 2011.
-
CDC. Decline in smoking prevalence---New York City, 2002--2006. MMWR 2007;56:604--8.
-
Cohn M. Smoking drops in Maryland more than in the nation. The Baltimore Sun. October 5, 2010. Available at
http://weblogs.baltimoresun.com/health/2010/10/smoking_drops_in_maryland_more.html. Accessed October 7, 2010.
What is already known on this topic?
Following a landmark lawsuit settlement in 1998, Minnesota implemented a series of tobacco control efforts.
What is added by this report?
Over the past decade, Minnesota experienced a decline in the percentage of adults who smoke, a reduction in the number of cigarettes smoked, fewer cigarettes sold, less reported exposure to secondhand smoke, and an increase in smoke-free homes.
What are the implications for public health practice?
As overall smoking prevalence declines, shifts in smoking behaviors need to be monitored to track the impact of policy efforts and to appropriately direct tobacco control prevention and treatment programs.
FIGURE 1. Prevalence of smoking among adults --- Minnesota and the United States, 1999--2010
† Based on data from the Minnesota Adult Tobacco Survey, conducted in 1999, 2003, 2007, and 2010.
Alternate Text: The figure above shows the prevalence of smoking among adults in Minnesota and the United States during 1999-2010. Based on MATS data, Minnesota adult smoking prevalence declined steadily from 22.1% in 1999 to 16.1% in 2010, a
27.1% decrease. The rate of decline was greatest during 1999-2003. During 2007-2010, smoking prevalence declined from 17.0% to 16.1%. By comparison, cigarette smoking declined nationally from 23.3% in 1999 to 19.9% in 2010. However, the national rate remained essentially unchanged during 2004-2010.
FIGURE 2. Percentage of current light, moderate, and heavy smokers, based on number of cigarettes smoked per day --- Minnesota, 1999--2010*
Alternate Text: The figure above shows the percentage of current light, moderate, and heavy smokers, by year, based on number of cigarettes smoked per day in Minnesota during 1999-2010. The daily average number of cigarettes smoked by current smokers decreased from 14.3 in 1999 to 12.2 in 2010. In addition, the proportion of current smokers who smoked ≥25 cigarettes per day decreased steadily, from 14.3% in 1999 to 6.3% in 2010. From 2007 to 2010, the proportion of current smokers who smoked ≤15 cigarettes per day increased from 54.1% to 63.2%.
FIGURE 3. Packs of cigarettes sold per capita each year --- Minnesota and the United States,* 1999--2009
* U.S. cigarette packs per capita excludes Minnesota data.
Alternate Text: The figure above shows packs of cigarettes sold per capita each year in Minnesota and the United States during 1999-2009. The decrease in both smoking prevalence and cigarettes smoked per day corresponds with a decrease in sales of cigarettes. Per capita cigarette pack sales in Minnesota decreased 40% from 1999 to 2009.