Skip directly to search Skip directly to A to Z list Skip directly to site content
CDC Home

Persons using assistive technology might not be able to fully access information in this file. For assistance, please send e-mail to: mmwrq@cdc.gov. Type 508 Accommodation and the title of the report in the subject line of e-mail.

QuickStats: Rates of Drug-Induced Deaths,* by Race/Ethnicity --- United States, 1999--2007

The figure shows the rates of drug-induced deaths, by race/ethnicity, in the United States, during 1999-2007. During 1999-2007, age-adjusted rates for drug-induced deaths generally increased for each race group. However, the rate remained relatively stable among the Hispanic population, with a slight decline of 5.8% during this period. The rate increased by 80.0% for the total population, 97.1% for the white population, 15.8% for the black population, 65.8% for American Indians/Alaska Natives, and 42.9% for Asians/Pacific Islanders. During 1999-2007, Asians/Pacific Islanders had substantially lower rates than all other groups.

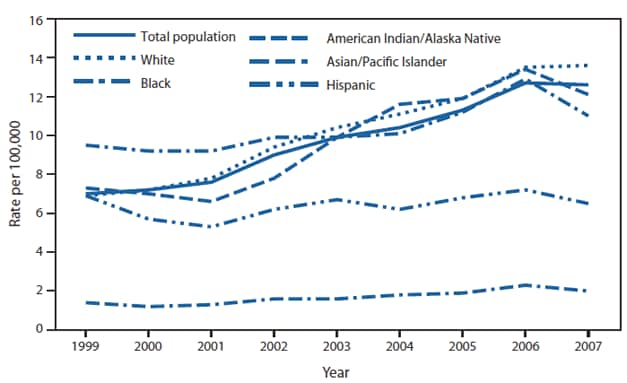
* Age-adjusted rates for drug-induced deaths per 100,000 U.S. standard population (based on International Classification of Diseases, 10th Revision [ICD-10] codes D52.1, D59.0, D59.2, D61.1, D64.2, E06.4, E16.0, E23.1, E24.2, E27.3, E66.1, F11.0--F11.5, F11.7--F11.9, F12.0--F12.5, F12.7--F12.9, F13.0--F13.5, F13.7--F13.9, F14.0--F14.5, F14.7--F14.9, F15.0--F15.5, F15.7--F15.9, F16.0--F16.5, F16.7--F16.9, F17.0, F17.3--F17.5, F17.7--F17.9, F18.0--F18.5, F18.7--F18.9, F19.0--F19.5, F19.7--F19.9, G21.1, G24.0, G25.1, G25.4, G25.6, G44.4, G62.0, G72.0, I95.2, J70.2--J70.4, K85.3, L10.5, L27.0--L27.1, M10.2, M32.0, M80.4, M81.4, M83.5, M87.1, R50.2, R78.1--R78.5, X40--X44, X60--X64, X85, and Y10--Y14). Drug-induced deaths include deaths from poisoning, drug dependence, and conditions resulting from acute or chronic exposure to drugs. Drug-induced deaths exclude deaths from adverse events caused by drugs in therapeutic use (ICD-10 codes Y40--59), deaths indirectly related to drug use (e.g., motor vehicle crashes), and newborn deaths associated with the mother's drug use.

Race and Hispanic ethnicity are reported separately on the death certificate. Persons of Hispanic ethnicity might be of any race. Hispanic decedents also are counted among the races shown.

During 1999--2007, age-adjusted rates for drug-induced deaths generally increased for each race group. The rate increased by 80.0% for the total population, 97.1% for the white population, 15.8% for the black population, 65.8% for American Indians/Alaska Natives, and 42.9% for Asians/Pacific Islanders. However, for the Hispanic population the rate was more stable, with a decline of 5.8%. During this period, Asians/Pacific Islanders had substantially lower rates than all other groups.

Source: Xu J, Kochanek KD, Murphy SL, Tejada-Vera B. Deaths: final data for 2007. Natl Vital Stat Rep 2010;58(19). Available at http://www.cdc.gov/nchs/data/nvsr/nvsr58/nvsr58_19.pdf.

Alternate Text: The figure above shows the rates of drug-induced deaths, by race/ethnicity, in the United States, during 1999-2007. During 1999-2007, age-adjusted rates for drug-induced deaths generally increased for each race group. However, the rate remained relatively stable among the Hispanic population, with a slight decline of 5.8% during this period. The rate increased by 80.0% for the total population, 97.1% for the white population, 15.8% for the black population, 65.8% for American Indians/Alaska Natives, and 42.9% for Asians/Pacific Islanders. During 1999-2007, Asians/Pacific Islanders had substantially lower rates than all other groups.


Use of trade names and commercial sources is for identification only and does not imply endorsement by the U.S. Department of Health and Human Services.

References to non-CDC sites on the Internet are provided as a service to MMWR readers and do not constitute or imply endorsement of these organizations or their programs by CDC or the U.S. Department of Health and Human Services. CDC is not responsible for the content of pages found at these sites. URL addresses listed in MMWR were current as of the date of publication.


All MMWR HTML versions of articles are electronic conversions from typeset documents. This conversion might result in character translation or format errors in the HTML version. Users are referred to the electronic PDF version (http://www.cdc.gov/mmwr) and/or the original MMWR paper copy for printable versions of official text, figures, and tables. An original paper copy of this issue can be obtained from the Superintendent of Documents, U.S. Government Printing Office (GPO), Washington, DC 20402-9371; telephone: (202) 512-1800. Contact GPO for current prices.

**Questions or messages regarding errors in formatting should be addressed to mmwrq@cdc.gov.

 
USA.gov: The U.S. Government's Official Web PortalDepartment of Health and Human Services
Centers for Disease Control and Prevention   1600 Clifton Road Atlanta, GA 30329-4027, USA
800-CDC-INFO (800-232-4636) TTY: (888) 232-6348 - Contact CDC–INFO
A-Z Index
  1. A
  2. B
  3. C
  4. D
  5. E
  6. F
  7. G
  8. H
  9. I
  10. J
  11. K
  12. L
  13. M
  14. N
  15. O
  16. P
  17. Q
  18. R
  19. S
  20. T
  21. U
  22. V
  23. W
  24. X
  25. Y
  26. Z
  27. #