Persons using assistive technology might not be able to fully access information in this file. For assistance, please send e-mail to: mmwrq@cdc.gov. Type 508 Accommodation and the title of the report in the subject line of e-mail.
Drivers Aged 16 or 17 Years Involved in Fatal Crashes --- United States, 2004--2008
Motor vehicle crashes are the leading cause of death among teens in the United States, accounting for approximately one third of deaths in this age group (1). Crash risk is highest during the first years of independent driving (2). To characterize trends in fatal crashes involving drivers aged 16 or 17 years, CDC analyzed data from the Fatality Analysis Report System (FARS) for 2004--2008. This report summarizes the results of that analysis, which indicated that, during 2004--2008, a total of 9,644 passenger vehicle drivers aged 16 or 17 years were involved in fatal crashes. During that period, the annual population-based rate for drivers aged 16 or 17 years involved in fatal crashes declined 38%, from 27.1 per 100,000 population in 2004 to 16.7 in 2008. By state, 5-year annualized rates for drivers aged 16 or 17 years involved in fatal crashes ranged from 9.7 per 100,000 population in New Jersey and New York to 59.6 in Wyoming. To further reduce fatal crashes involving young drivers, states should periodically reexamine and update graduated driver licensing (GDL) programs, and communities should vigorously enforce laws on minimum legal drinking age, blood alcohol concentration (BAC), and safety belt use, all of which can reduce the number of fatal crashes among young drivers.
FARS is a census of fatal traffic crashes in the United States maintained by the National Highway Traffic Safety Administration. For this study, records of drivers involved in fatal crashes during 2004--2008 were examined. A fatal crash was defined as one in which at least one vehicle occupant or nonoccupant (e.g., bicyclist or pedestrian) involved in the crash died within 30 days of the crash. Analyses were restricted to drivers of passenger vehicles (i.e., automobiles, sport utility vehicles, pickup trucks, and vans). Of the 10,048 drivers aged 16 or 17 years involved in fatal crashes, 9,644 (96%) drove passenger vehicles. U.S. census population estimates for persons aged 16 or 17 years and persons aged ≥18 years were used to calculate rates of fatal crash involvement. To examine state-specific rates for drivers aged 16 or 17 years involved in fatal crashes, 2004--2008 crash data and census data were aggregated separately, and an annualized rate was calculated for each state. The annualized rates then were compared with 2008 state-specific fatality rates for all crashes involving passenger vehicles.
During 2004--2008, a total of 9,644 drivers aged 16 or 17 years were involved in 9,494 fatal crashes. A total of 4,705 (50%) crashes involved one vehicle; 3,976 (42%) involved two vehicles; and 813 (8%) involved three or more vehicles. A total of 8,274 (87%) crashes resulted in one fatality, 986 (10%) resulted in two fatalities, and 234 (3%) resulted in three or more fatalities.
Of the 11,019 persons who died in these crashes, 4,071 (37%) were drivers aged 16 or 17 years; 3,428 (31%) were passengers of those drivers; 1,987 (18%) were drivers of other vehicles (aged ≥18 years, aged <16 years, and of unknown age); and 805 (7.3%) were passengers of those other drivers. Another 728 (6.7%) persons were other road users (e.g., bicyclists or pedestrians).
A total of 6,280 (65%) drivers aged 16 or 17 years involved in fatal crashes were male; 3,429 (36%) of drivers in the age group were reported speeding at the time of the crash. Of the 4,459 (46%) whose BAC levels were known, 3,512 (79%) had zero BAC. Of the 947 drivers with a positive BAC, levels ranged from 0.01 g/dL to 0.55 g/dL, with a median of 0.11 g/dL; 678 (72%) of these drivers had a BAC of ≥0.08 g/dL, above the legal limit for drivers aged ≥21 years. Drivers aged <21 years, who cannot purchase alcohol legally, are subject to lower BAC limits in every state (i.e., >0.00 g/dL, ≥0.01 g/dL, or ≥0.02 g/dL, depending on the state).
From 2004 to 2008, the annual number of drivers aged 16 or 17 years involved in fatal crashes decreased 36%, from 2,230 to 1,437 (Table 1). Continuing a general decline that began in 1996 (Figure), the population-based rate for drivers aged 16 or 17 years involved in fatal crashes decreased 38%, from 27.1 per 100,000 population in 2004 to 16.7 in 2008 (Table 1). During 2004--2008, year-to-year decreases in the rate ranged from 5% from 2005 to 2006 to 23% from 2007 to 2008. In comparison, the rate for drivers aged ≥18 years involved in fatal crashes declined 20%, from 20.5 per 100,000 population in 2004 to 16.3 per 100,000 in 2008. Year-to-year declines in the rate of fatal crash involvement for drivers aged ≥18 years ranged from <1% from 2004 to 2005 to 12% from 2007 to 2008 (Table 1).
Among states, the 5-year annualized rate for drivers aged 16 or 17 years involved in fatal crashes ranged from 9.7 per 100,000 population in New York and New Jersey to 59.6 in Wyoming (Table 2). These state-specific rates correlated strongly with 2008 state-specific fatality rates from all crashes involving passenger vehicles (Pearson correlation coefficient = 0.8) (Table 2).
Reported by
Shults RA, PhD, Ali B, MPH, Div of Unintentional Injury Prevention, National Center for Injury Prevention and Control, CDC.
Editorial Note
The results described in this report indicate that the population-based rate for drivers aged 16 or 17 years involved in fatal crashes continued to decline substantially during 2004--2008, most notably from 2007 to 2008, when the rate decreased 23%. Among drivers aged ≥18 years, the rate decreased 12% from 2007 to 2008. Reasons for the decreases in rates of involvement in fatal crashes are unknown but they have been attributed, in part, to decreases in the number of vehicle miles traveled (particularly discretionary travel) because of rising gasoline prices and adverse economic conditions (3). Economic downturns are believed to produce greater cutbacks in travel for drivers with limited funds, including teens (3). Additionally, some teens might delay obtaining drivers licenses for financial reasons during adverse economic conditions, reducing the number of overall miles driven by teens.
The decline during 2004--2008 in the rate of young drivers involved in fatal crashes extends a long-term downward trend (2). From 1996 to 2008, the rate for drivers aged 16 or 17 years involved in fatal crashes fell approximately 50%, from 36.0 per 100,000 population (2) to 16.7. GDL programs are widely credited with contributing to this decline. A recent review of GDL evaluations concluded that the programs have reduced young driver crash risk by approximately 20% to 40% (4). First implemented in the United States in 1996 in Florida, GDL programs now operate in 49 states and the District of Columbia.* The programs initially limit teens' independent driving under various high-risk conditions, such as nighttime driving or carrying teen passengers. All U.S. GDL programs include a nighttime driving restriction, and 42 states and the District of Columbia include a teen passenger restriction. CDC recommends that families of newly licensed teen drivers actively enforce GDL requirements with a parent-teen driving contract (5). Other factors that likely contributed to the long-term decline in fatal crashes involving young drivers include improvements in vehicle and road safety, increased seat belt use, and reductions in driving after drinking alcohol (6).
State-specific rates of drivers aged 16 or 17 years involved in fatal crashes varied by sixfold. By state, the strong correlation between rates for young drivers involved in fatal crashes and fatality rates from all crashes involving passenger vehicles suggests that state-specific differences in the driving environment (e.g., degree of urbanization, speed limits, amounts and types of travel, weather, state traffic laws, rates of licensure, and emergency-care capabilities) have similar effects on fatal crash risk for drivers of all ages.† The relatively low rates of crash involvement for young drivers in New Jersey and New York might be related to licensing policies. New Jersey is the only state with a minimum licensing age of 17 years; in New York City, the minimum age is 18 years, except for persons who take a state-approved driver education course and meet other requirements, who may be licensed at aged 17 years.
The findings in this report are subject to at least four limitations. First, population-based crash rates do not account for driving exposure. This limitation is of particular concern because the age at which teens may begin to drive independently varies by state from 14 years to 17 years; therefore, the proportion of persons aged 16 or 17 years who are eligible to drive without adult supervision varies widely by state. Ideally, studies of young driver crash risk would include measures such as the number of miles driven or number of licensed teen drivers. Reliable data on these driving exposure measures are not readily available for research (2,7). To help facilitate collection of data on driving exposure, the Transportation Research Board's Subcommittee on Young Drivers recently identified documenting the amount and type of driving done by teens as one of five high-priority research needs (7). Second, the two variables used in calculating the Pearson correlation coefficient were not completely independent because fatalities resulting from crashes involving drivers aged 16 or 17 years were included in the 2008 state-specific fatality rates for all crashes involving passenger vehicles. The effect is small, however, because only 5% of passenger vehicle fatalities in 2008 involved a driver aged 16 or 17 years. Third, any fatalities that occur >30 days postcrash are excluded from FARS. Finally, caution should be used in interpreting the differences in fatal crash involvement rates among states because many factors that vary by state contribute to crash risk.
GDL programs vary in makeup; the more comprehensive programs are associated with larger crash reductions (8). To further reduce crashes among young drivers, states should ensure that their GDL programs include all of the components with demonstrated effectiveness, including extended learner periods, nighttime driving restrictions, and passenger restrictions (9). As GDL programs evolve and additional evaluation results become available, states should reexamine their programs and consider implementing additional components that have been proven effective. Additionally, communities should vigorously enforce existing laws known to be effective among young drivers and the general driving population, including laws on minimum legal drinking age, BAC, and safety belt use. Information regarding the effectiveness of these strategies is available at http://www.thecommunityguide.org/mvoi/index.html.
Acknowledgments
The findings in this report are based, in part, on the contributions of T Lindsey, National Highway Traffic Safety Admin, District of Columbia, and AF Williams, PhD.
References
- CDC. WISQARS (Web-based Injury Statistics Query and Reporting System). Atlanta, GA: US Department of Health and Human Services, CDC; 2010. Available at http://www.cdc.gov/injury/wisqars/index.html. Accessed October 18, 2010
- Ferguson SA, Teoh ER, McCartt AT. Progress in teenage crash risk during the last decade. J Safety Res 2007;38:137--45.
- Sivak M. Is the U.S. on the path to the lowest motor vehicle fatalities in a decade? Ann Arbor, MI: University of Michigan Transportation Research Institute; 2008. Available at http://deepblue.lib.umich.edu/bitstream/2027.42/60424/1/100969.pdf. Accessed October 18, 2010.
- Shope J. Graduated driver licensing: review of evaluation results since 2002. J Safety Res 2007;38:166--75.
- CDC. Parents Are the Key Campaign. US Department of Health and Human Services, CDC; 2010. Available at http://www.cdc.gov/parentsarethekey/about/index.html. Accessed October 18, 2010.
- CDC. Achievements in public health, 1900--1999 motor-vehicle safety: a 20th century public health achievement. MMWR 1999;48:369--74.
- Transportation Research Board Subcommittee on Young Drivers. Future directions for research on motor vehicle crashes and injuries involving teenage drivers. Washington, DC: Transportation Research Board; 2009. Available at http://claire.hsrc.unc.edu/~foss/2008rpt.pdf. Accessed October 18, 2010.
- McCartt AT, Teoh ER, Fields M, Braitman KA, Hellinga LA. Graduated licensing laws and fatal crashes of teenage drivers: a national study. Traffic Inj Prev 2010;11:240--8.
- Williams AF. Contribution of the components of graduated driver licensing to crash reduction. J Safety Res 2007;38:177--84.
* Additional information available at http://www.iihs.org/laws/graduatedlicenseintro.aspx.
† Additional information available at http://www.iihs.org/research/fatality_facts_2008/statebystate.html.
What is already known on this topic?
Teen drivers have the highest motor vehicle crash risk of any age group, and crashes are the leading cause of death among teens in the United States.
What is added by this report?
The national rate for drivers aged 16 or 17 years involved in fatal crashes declined 38% from 2004 to 2008 to 16.7 per 100,000 population; however, rates among states ranged from 9.7 to 59.6.
What are the implications for public health practice?
To further reduce crashes among young drivers, states should ensure that their graduated driver licensing programs include all effective measures, including extended learner periods, nighttime driving restrictions, and passenger restrictions.
FIGURE. Annual rate* for drivers† aged 16 or 17 years involved in fatal crashes, by age group --- Fatality Analysis Reporting System, United States, 1990--2008
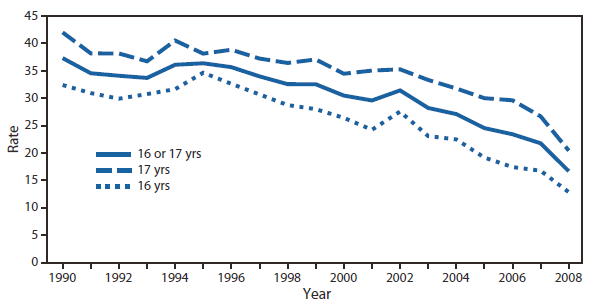
* Per 100,000 population in age group.
† Of passenger vehicles (i.e., automobiles, sport utility vehicles, pickup trucks, and vans).
Alternate Text: The figure above shows the annual rate for drivers aged 16 or 17 years involved in fatal crashes, by age group in the United States from 1990-2008. Continuing a general decline that began in 1996, the population-based rate for drivers aged 16 or 17 years involved in fatal crashes decreased 38%, from 27.1 per100,000 population in 2004 to 16.7 in 2008.
Use of trade names and commercial sources is for identification only and does not imply endorsement by the U.S. Department of
Health and Human Services.
References to non-CDC sites on the Internet are
provided as a service to MMWR readers and do not constitute or imply
endorsement of these organizations or their programs by CDC or the U.S.
Department of Health and Human Services. CDC is not responsible for the content
of pages found at these sites. URL addresses listed in MMWR were current as of
the date of publication.
All MMWR HTML versions of articles are electronic conversions from typeset documents.
This conversion might result in character translation or format errors in the HTML version.
Users are referred to the electronic PDF version (http://www.cdc.gov/mmwr)
and/or the original MMWR paper copy for printable versions of official text, figures, and tables.
An original paper copy of this issue can be obtained from the Superintendent of Documents, U.S.
Government Printing Office (GPO), Washington, DC 20402-9371;
telephone: (202) 512-1800. Contact GPO for current prices.
**Questions or messages regarding errors in formatting should be addressed to
mmwrq@cdc.gov.
