Persons using assistive technology might not be able to fully access information in this file. For assistance, please send e-mail to: mmwrq@cdc.gov. Type 508 Accommodation and the title of the report in the subject line of e-mail.
Prevalence of Doctor-Diagnosed Arthritis and Arthritis-Attributable Activity Limitation --- United States, 2007--2009
Arthritis is a large and growing public health problem in the United States (1), resulting in costs of $128 billion annually, and continues to be the most common cause of disability (2). With the aging of the U.S. population, even assuming that the prevalence of obesity and other risk factors remain unchanged, the prevalence of doctor-diagnosed arthritis and arthritis-attributable activity limitation (AAAL) is expected to increase significantly by 2030 (1). To update previous U.S. estimates of doctor-diagnosed arthritis and AAAL, CDC analyzed National Health Interview Survey (NHIS) data from 2007--2009. This report summarizes the results of that analysis, which found that 22.2% (49.9 million) of adults aged ≥18 years had self-reported doctor-diagnosed arthritis, and 9.4% (21.1 million or 42.4% of those with arthritis) had AAAL. Among persons who are obese, an age-adjusted 33.8% of women and 25.2% of men reported doctor-diagnosed arthritis. Arthritis and AAAL represent a major public health problem in the United States that can be addressed, at least in part, by implementing proven obesity prevention strategies and increasing availability of effective physical activity programs and self-management education courses in local communities.
NHIS is an annual, in-person interview survey of the health status and behaviors of the noninstitutionalized U.S. population of all ages. The analysis described in this report used the sample adult component, which is limited to persons aged ≥18 years. One adult per selected household was chosen randomly to participate. Because NHIS oversamples blacks, Hispanics, and Asians, persons in these populations aged ≥65 years have twice the probability of being selected, compared with other adults. For this analysis, NHIS data from 2007, 2008, and 2009 were combined, and annualized prevalence estimates were calculated and stratified by selected characteristics (i.e., sex, age group, race/ethnicity, education level, body mass index (BMI) category,* physical activity level,† and smoking status). Unweighted sample sizes were 23,393 in 2007; 21,781 in 2008; and 27,731 in 2009. Response rates for the sample adult component were 67.8% in 2007, 62.6% in 2008, and 65.4% in 2009.§ Respondents were defined as having doctor-diagnosed arthritis if they answered "yes" to "Have you ever been told by a doctor or other health professional that you have some form of arthritis, rheumatoid arthritis, gout, lupus, or fibromyalgia?" Those who responded "yes" to having doctor-diagnosed arthritis were asked "Are you limited in any way in any of your usual activities because of arthritis or joint symptoms?" Those responding "yes" to both questions were categorized as having AAAL.
Statistical software was used to account for complex multistage sampling design and produce weighted estimates and 95% confidence intervals. Unadjusted prevalence was estimated to describe the actual population burden; age-adjusted prevalence, standardized to the 2000 U.S. standard population, was estimated to facilitate comparisons among demographic subgroups. For all comparisons, statistical significance was determined using a two-sided t-test; differences were considered statistically significant at p<0.05.
During 2007--2009, an estimated 22.2% (49.9 million) of U.S. adults reported doctor-diagnosed arthritis. Arthritis prevalence increased significantly with age. After adjustment for age, arthritis prevalence was significantly higher among women (24.3%) than among men (18.2%); those with less than a high school diploma (21.9%), compared with those with at least some college (20.5%); persons who are obese (29.6%), compared with normal/underweight (16.9%) and overweight (19.8% ); physically inactive persons (23.5%) versus those meeting physical activity recommendations (18.7%); and current (23.7%) or former (25.4%) smokers, compared with never smokers (19.0%) (Table). For all these comparisons, p values were <0.001.
During 2007--2009, an estimated 9.4% (21.1 million) of U.S. adults reported AAAL. After adjustment for age, patterns of prevalence of AAAL were similar to those for doctor-diagnosed arthritis (Table).
Among adults reporting doctor-diagnosed arthritis, the unadjusted prevalence of AAAL was 42.4%. After adjustment for age, the greatest prevalences were among persons categorized as obese class III (52.9%), those with less than a high school diploma (52.0%), physically inactive persons (51.2%), current smokers (47.6%), those categorized as obese class II (46.7%), and non-Hispanic blacks (45.5%) (Table).
Among both men and women, age-adjusted arthritis prevalence increased significantly with increasing BMI (p<0.001 for trend). The age-adjusted prevalence among persons who are obese (25.2% for men, 33.8% for women) was approximately double that for persons who are underweight/normal weight (13.8% for men, 18.9% for women) (Figure). Among those with arthritis, the age-adjusted prevalence of AAAL also increased significantly with increasing BMI, from 34.7% for those who are underweight/normal weight to 44.8% for those who are obese (Table).
Reported by
YJ Cheng, MD, PhD, JM Hootman, PhD, LB Murphy, PhD, GA Langmaid, CG Helmick, MD, Div of Adult and Community Health, National Center for Chronic Disease Prevention and Health Promotion, CDC.
Editorial Note
Approximately one in five (49.9 million) adults in the United States reported doctor-diagnosed arthritis during 2007--2009, and 21.1 million adults reported AAAL. The prevalence of arthritis and AAAL is particularly high among persons who are obese. With the aging population and continued high prevalence of obesity (3) in the United States, the prevalence of arthritis is expected to increase significantly over the next 2 decades.
Compared with previous estimates, the number of adults with arthritis increased, but not significantly (p=0.07), from 46.4 million during 2003--2005 to 49.9 million during 2007--2009, an increase of approximately 1 million adults per year (4). During the same period, the prevalence of AAAL increased significantly (p=0.005), from 8.8% (18.9 million persons) to 9.4% (21.1 million). The data on arthritis prevalence appear consistent with a previous analysis that estimated 51.9 million adults would have arthritis by 2010 and 67 million by 2030 (1). That analysis also estimated that 19.1 million adults would have AAAL by 2010 and 25 million by 2030; however, the findings in this report indicate that 21.1 million persons already had AAAL during 2007--2009 (1).
Obesity is associated with onset of knee osteoarthritis (the most common type of arthritis), disease progression, disability, total knee joint replacement, and poor clinical outcomes after knee joint replacement, and likely has a critical role in the increasing impact of arthritis on disability, health-related quality of life, and health-care costs (5). Lifetime risk for symptomatic knee osteoarthritis alone is 60.5% among persons who are obese, double the risk for those of normal/underweight (6). Because even small amounts of weight loss (approximately 11 lbs [5 kg]) can reduce the risk for incident knee osteoarthritis among women by 50% (7) and might also reduce mortality risk in osteoarthritis patients by half (8), large-scale clinical and community efforts to prevent and treat obesity as recommended by the National Institutes of Health¶ might reduce the obesity-related burden and impact of arthritis in the population.
The findings in this report are subject to at least four limitations. First, doctor-diagnosed arthritis was self-reported and not confirmed by a health-care professional; however, self-reports are sufficiently sensitive for public health surveillance (9). Second, osteoarthritis, rheumatoid arthritis, gout, lupus, and fibromyalgia have different etiologies and risk factors; however, the public health recommendations for these different types of arthritis are the same (e.g., weight loss and increased physical activity), regardless of differences in etiology or medical management. Third, because NHIS is a cross-sectional survey, a cause-effect relationship between risk factors (e.g., obesity) and arthritis and AAAL could not be determined; certain risk factors, such as obesity, could develop after onset of arthritis. However, prospective studies consistently have identified excess body weight as a risk factor for incident arthritis, particularly lower extremity osteoarthritis (5,7). Finally, because all NHIS information is self-reported, underreporting of weight and overreporting of leisure-time physical activity might have occurred because of social desirability bias.
Both clinical treatment guidelines (10) and public health recommendations for osteoarthritis** call for proven community-based intervention strategies (e.g., self-management education, increased physical activity, and weight management) to reduce pain and improve physical function and health-related quality-of-life for persons with osteoarthritis. Health-care providers and public health organizations should work together to increase the availability of these interventions for persons with all types of arthritis.
References
- Hootman JM, Helmick CG. Projections of US prevalence of arthritis and associated activity limitations. Arthritis Rheum 2006;54:226--9.
- CDC. National and state medical expenditures and lost earnings attributable to arthritis and other rheumatic conditions---United States, 2003. MMWR 2007;56:4--7.
- Flegal KM, Carroll MD, Ogden CI, Curtin LR. Prevalence and trends in obesity among US adults, 1999--2008. JAMA 2010;303:235--41.
- CDC. Prevalence of doctor-diagnosed arthritis and arthritis-attributable activity limitation---United States, 2003--2005. MMWR 2006;55:1089--92.
- Anandacoomarasamy A, Caterson I, Sambrook P, Fransen M, March L. The impact of obesity on the musculoskeletal system. Int J Obes 2008;32:211--22.
- Murphy L, Schwartz TA, Helmick CG, et al. Lifetime risk of symptomatic knee osteoarthritis. Arthritis Rheum 2008;59:1207--13.
- Felson DT, Zhang Y. An update on the epidemiology of knee and hip osteoarthritis with a view to prevention. Arthritis Rheum 1998;41:1343--55.
- Shea MK, Houston DK, Nicklas BJ, et al. The effect of randomization to weight loss on total mortality in older overweight and obese adults: the ADAPT Study. J Gerontol A Biol Sci Med Sci 2010;65:519--25.
- Sacks JJ, Harrold LR, Helmick CG, Gurwitz JH, Emani S, Yood RA. Validation of a surveillance case definition for arthritis. J Rheumatol 2005;32:340--7.
- Zhang W, Nuki G, Moskowitz RW, et al. OARSI recommendations for the management of hip and knee osteoarthritis. Part III: changes in evidence following systematic cumulative update of research published through January 2009. Osteoarthritis Cartilage 2010;18:476--99.
* BMI = weight (kg) / height (m2). Categorized as follows: underweight/normal weight (<25.0), overweight (25.0 to <30.0), obese (≥30.0), obese class I (30.0 to <35.0), obese class II (35.0 to <40.0), obese class III (≥40.0).
† Determined from responses to six questions regarding frequency and duration of participation in leisure-time activities of moderate or vigorous intensity and categorized according to the U.S. Department of Health and Human Services 2008 Physical Activity Guidelines for Americans. Total minutes (moderate plus 2 × vigorous) of physical activity per week were categorized as follows: meeting recommendations (≥150 min per week), insufficient activity (10--149 min), and inactive (<10 min).
§ Information available at http://www.cdc.gov/nchs/nhis/quest_data_related_1997_forward.htm.
¶ Available at http://www.nhlbi.nih.gov/guidelines/obesity/ob_gdlns.htm.
** Available at http://www.cdc.gov/arthritis/docs/oaagenda.pdf.
What is already known on this topic?
Arthritis is a large and growing public health problem in the United States, resulting in costs of $128 billion annually, and continues to be the most common cause of disability.
What does this report add?
During 2007--2009, 22.2% of adults aged ≥18 years (49.9 million) had self-reported doctor-diagnosed arthritis, and 9.4% (21.1 million or 42.4% of those with arthritis) had self-reported arthritis-attributable activity limitation (AAAL). Among persons who are obese, an age-adjusted 33.8% of women and 25.2% of men reported doctor-diagnosed arthritis.
What are the implications for public health?
Arthritis and AAAL represent a major public health problem in the United States that can be addressed, at least in part, by implementing proven obesity prevention strategies and increasing availability of effective physical activity programs and self-management education courses in local communities.
FIGURE. Age-adjusted* prevalence of doctor-diagnosed arthritis among adults, by sex and body mass index (BMI) category† --- National Health Interview Survey, United States, 2007--2009
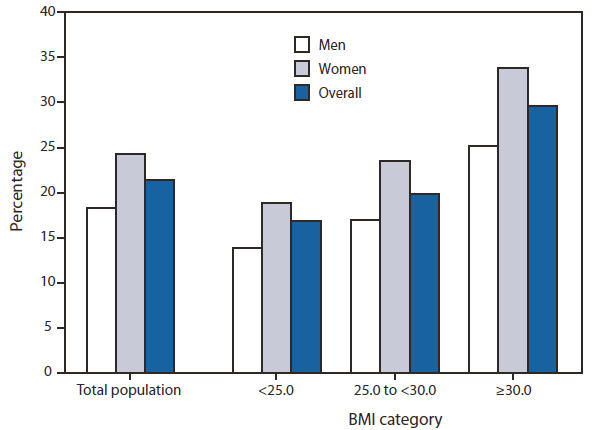
* Age adjusted to the 2000 U.S. projected adult population, using three age groups: 18--44 years, 45--64 years, and ≥65 years.
† BMI = weight (kg) / height (m2). Categorized as follows: underweight/normal weight (<25.0), overweight (25.0 to <30.0), and obese (≥30.0).
Alternate Text: The figure above shows age-adjusted prevalence of doctor-diagnosed arthritis among adults in the United States from 2007-2009, by sex and body mass index (BMI) category. Among both men and women, age-adjusted arthri¬tis prevalence increased significantly with increasing BMI (p<0.001 for trend). The age-adjusted preva¬lence among persons who are obese (25.2% for men and 33.8% for women) was approximately double that for persons who are underweight/normal weight (13.8% for men and 18.9% for women).
Use of trade names and commercial sources is for identification only and does not imply endorsement by the U.S. Department of
Health and Human Services.
References to non-CDC sites on the Internet are
provided as a service to MMWR readers and do not constitute or imply
endorsement of these organizations or their programs by CDC or the U.S.
Department of Health and Human Services. CDC is not responsible for the content
of pages found at these sites. URL addresses listed in MMWR were current as of
the date of publication.
All MMWR HTML versions of articles are electronic conversions from typeset documents.
This conversion might result in character translation or format errors in the HTML version.
Users are referred to the electronic PDF version (http://www.cdc.gov/mmwr)
and/or the original MMWR paper copy for printable versions of official text, figures, and tables.
An original paper copy of this issue can be obtained from the Superintendent of Documents, U.S.
Government Printing Office (GPO), Washington, DC 20402-9371;
telephone: (202) 512-1800. Contact GPO for current prices.
**Questions or messages regarding errors in formatting should be addressed to
mmwrq@cdc.gov.
