Persons using assistive technology might not be able to fully access information in this file. For assistance, please send e-mail to: mmwrq@cdc.gov. Type 508 Accommodation and the title of the report in the subject line of e-mail.
Current Depression Among Adults --- United States, 2006 and 2008
Please note: An erratum has been published for this article. To view the erratum, please click here.
Major depression is a common and treatable mental disorder; a study conducted during 2001--2002 estimated that 6.6% of the U.S. adult population had experienced a major depressive disorder during the preceding 12 months (1). Depressive disorders are more common among persons with chronic conditions (e.g., obesity, cardiovascular disease, diabetes, asthma [2,3], arthritis, and cancer [3]) and among those with unhealthy behaviors (e.g., smoking, physical inactivity, and binge drinking [2]). To estimate the prevalence of current depression, CDC analyzed Behavioral Risk Factor Surveillance System (BRFSS) survey data from 2006 and 2008. Current depression was defined as meeting BRFSS criteria for either major depression or "other depression" during the 2 weeks preceding the survey. This report summarizes the results of that analysis, which indicated that, among 235,067 adults (in 45 states, the District of Columbia [DC], Puerto Rico, and the U.S. Virgin Islands), 9.0% met the criteria for current depression, including 3.4% who met the criteria for major depression. By state, age-standardized estimates for current depression ranged from 4.8% in North Dakota to 14.8% in Mississippi. State health departments that include depression measures in their BRFSS surveys can track prevalence, set health goals for prevention and control, and monitor the effectiveness of relevant programs and policies.
BRFSS conducts state-based, random-digit--dialed telephone surveys of the noninstitutionalized U.S. civilian population aged ≥18 years, collecting data on health conditions and health risk behaviors.* Data from the 29 participating states, DC, Puerto Rico, and the U.S. Virgin Islands from the 2006 survey were included in the analysis along with data from the 16 states that participated in the 2008 survey (the most recent years the optional depression module was included in the BRFSS survey). Nine states (Hawaii, Kansas, Louisiana, Maine, Mississippi, Nebraska, North Dakota, Vermont, and Washington) participated in both years, but only their 2008 data were included. Five states (Kentucky, New Jersey, North Carolina, Pennsylvania, and South Dakota) did not participate in either year. Council of American Survey and Research Organizations (CASRO) response rates ranged from 36.9% (California) to 73.4% (Puerto Rico) in 2006 (mean: 52.7%) and from 40.0% (New York) to 65.5% (Nebraska) in 2008 (mean: 52.0%). Cooperation rates ranged from 56.9% (California) to 89.0% (Puerto Rico) in 2006 and from 63.4% (New York) to 81.9% (Colorado) in 2008.
Current depression was determined based on responses to the Patient Health Questionnaire 8 (PHQ-8) (4), which covers eight of the nine criteria from the Diagnostic and Statistical Manual of Mental Disorders, Fourth Edition (DSM-IV) for diagnosis of major depressive disorder (5). The ninth criterion in the DSM-IV assesses suicidal or self-injurious ideation and was omitted from the BRFSS depression module because interviewers would not able to provide adequate intervention by telephone. The PHQ-8 classification "other depression" includes the DSM-IV category Depressive Disorder, Not Otherwise Specified (sometimes referred to as minor or subthreshold depression); persons with "other depression" also might meet criteria for the category Dysthymia. The PHQ-8 sensitivity and specificity for major depression have been reported as 88% (4). The PHQ-8 response set was standardized to BRFSS methodology for current depression by asking the number of days "over the last 2 weeks" that the respondent experienced a particular depressive symptom.
Participants were considered to have major depression if, for "more than half the days," they met at least five of the eight criteria, including at least one of the following: 1) "little interest or pleasure in doing things" or 2) "feeling down, depressed, or hopeless."† Participants were considered to have "other depression" if they met two, three, or four of the eight criteria, including at least one of the two specified. Weighted prevalence estimates for major depression and "other depression" and 95% confidence intervals were calculated using statistical software to account for the complex survey design. Estimates were stratified by type of depression, age, sex, race/ethnicity, education level, and marital, employment, and health insurance coverage plan status. Age-standardized estimates also were calculated by state/territory using the 2000 U.S. standard population. For comparisons of prevalence, statistical significance (p<0.05) was determined using a two-sided z-test.
Among the 235,067 adult respondents in the sample for survey years 2006 and 2008, 9.0% met criteria for current depression, including 3.4% who met criteria for major depression (Table 1). The prevalence of major depression increased with age, from 2.8% among persons aged 18--24 years to 4.6% among persons aged 45--64 years, but declined to 1.6% among those aged ≥65 years. Women were significantly more likely than men to report major depression (4.0% versus 2.7%), as were persons without health insurance coverage compared with those with coverage (5.9% versus 2.9%), persons previously married (6.6%) or never married (4.1%) compared with those currently married (2.2%), and persons unable to work (22.2%) or unemployed (9.8%) compared with homemakers and students (3.0%), persons employed (2.0%), and retired persons (1.6%) (Table 1).
Non-Hispanic blacks (4.0%), Hispanics (4.0%), and non-Hispanic persons of other races (4.3%) were significantly more likely to report major depression than non-Hispanic whites (3.1%). Persons with less than a high school diploma (6.7%) and high school graduates (4.0%) were more likely to report major depression than those with at least some college (2.5%). Patterns of prevalence for "other depression" generally were similar to those for major depression, with some notable exceptions. Among age groups, "other depression" was highest (8.1%) among persons aged 18--24 years (Table 1).
The age-standardized prevalence of major depression, "other depression," and any current depression also varied by state and territory. The estimates for major depression ranged from 1.5% in North Dakota to 5.3% in Mississippi and West Virginia (Table 2). Estimates of "other depression" were highest in Puerto Rico (10.2%), Mississippi (9.5%), and West Virginia (9.0%) and lowest in North Dakota (3.2%), Oregon (3.6%), and Minnesota (3.8%). Estimates for any current depression ranged from 4.8% in North Dakota to 14.8% in Mississippi and was mainly concentrated in the southeastern region of the United States (Figure).
Reported by
O Gonzalez, PhD, JT Berry, PhD, JD, Substance Abuse and Mental Health Svcs Admin. LR McKnight-Eily, PhD, T Strine, PhD, VJ Edwards, PhD, H Lu, MS, JB Croft, PhD, Div of Adult and Community Health, National Center for Chronic Disease Prevention and Health Promotion, CDC.
Editorial Note
Unlike previous epidemiologic studies of depression that have used different methodologies and focused on lifetime or 12-month prevalence of depression (1), the PHQ-8 and BRFSS enabled assessment of current depression (i.e., symptoms occurring during the preceding 2 weeks). However, the distribution of major depression among selected sociodemographic groups in this analysis generally is consistent with previous research indicating that women, younger and middle-aged adults, those who were never married, and persons with less than a high school education were more likely to have met diagnostic criteria for depression during the preceding 12 months (1). Older adults have been found less likely to meet diagnostic criteria, but depression in this population might be underrecognized or underreported (6).
The greater prevalence of depression among women is not fully understood, although potential contributors include different responses to stressful life events, genetic predisposition, and hormonal differences (7). Racial/ethnic differences in depression have not been found consistently; some studies have reported no differences (8), whereas others have found lower rates (1) among racial/ethnic minorities compared with whites. However, this report and other BRFSS-based studies (2) indicate significantly higher rates of current depression among racial/ethnic minorities. This is consistent with the greater risk factors for mental illness that these populations often experience (e.g., social and economic inequality, exposure to racism and discrimination, increased prevalence of some chronic diseases, and less access to care and treatment for mental health and health conditions [8]). Targeted efforts are needed to address racial/ethnic disparities in recognition and treatment of depression (8). In this study, persons without health insurance coverage were more likely to have current depression. Although seeking care for depression might have grown more common, for many, lack of health insurance coverage (or limited mental health coverage) remains a major barrier to care (9).
State and territorial variations in depression prevalence might result from differences in socioeconomic status, prevalence of comorbid mental and physical disorders (particularly chronic conditions), and access to health-care and treatment (e.g., availability of mental health service providers) (2,10). In this study, a greater prevalence of depression was found in southeastern states, where a greater prevalence of chronic conditions associated with depression also has been observed (e.g., obesity and stroke). Depression can lead to chronic diseases, and chronic diseases can exacerbate depressive conditions (3). The variations among states in depression prevalence should be examined further to target prevention and intervention efforts and to allocate mental health treatment resources of the federal government. In addition, the Task Force on Community Preventive Services recommends collaborative care, an approach that facilitates the collaboration of primary-care providers, mental health specialists, and case managers for the management of depressive disorders, on the basis of strong evidence of effectiveness in improving depression outcomes.§
The findings in this report are subject to at least three limitations. First, the increase in the number households with cellular telephones only and the increase in telephone number portability continue to decrease BRFSS response rates, reducing the precision of state estimates and potentially introducing bias; however, in 2009 all states incorporated surveys for cellular telephone households along with landline surveys, which should increase response rates to the survey. Second, institutionalized and homeless persons are not included in BRFSS surveys; their inclusion might have increased depression estimates. Finally, because not all states participated, estimates might not be generalizable to the entire U.S. adult population.
PHQ-8 was added as a component of an optional module in the BRFSS survey in 2006 through an intra-agency agreement with the Substance Abuse and Mental Health Services Agency to determine state-based estimates of depression in adults. These data also allow for examination of comorbid chronic diseases and associated health-risk behaviors among adults with depressive disorders and should be used to help guide state-level chronic disease and mental health programs. The prevalence of depressive disorders should be monitored by state public health departments through surveillance, and at-risk populations should be targeted for intervention.
References
- Kessler RC, Berglund P, Demler O, et al. The epidemiology of major depressive disorder: results from the National Comorbidity Survey Replication (NCS-R). JAMA 2003;289:3095--105.
- Strine TW, Mokdad AH, Balluz LS, et al. Depression and anxiety in the United States: findings from the 2006 Behavioral Risk Factor Surveillance System. Psychiatr Serv 2008;59:1383--90.
- Chapman DP, Perry GS, Strine TW. The vital link between chronic disease and depressive disorders. Prev Chronic Dis 2005;2:A14.
- Kroenke K, Strine TW, Spitzer RL, Williams JB, Berry JT, Mokdad AH. The PHQ-8 as a measure of current depression in the general population. J Affect Disord 2009; 114:163--73.
- American Psychiatric Association. Diagnostic and statistical manual of mental disorders, 4th ed. Washington, DC: American Psychiatric Association; 1994.
- Byers AL, Yaffe K, Covinsky KE, Friedman MB, Bruce ML. High occurrence of mood and anxiety disorders among older adults: the National Comorbidity Survey Replication. Arch Gen Psychiatry 2010;67:489--96.
- National Institute of Mental Health. Women and depression: discovering hope. Bethesda, MD: US Department of Health and Human Services, National Institutes of Health, National Institute of Mental Health; 2009. Available at http://www.nimh.nih.gov/health/publications/women-and-depression-discovering-hope/index.shtml. Accessed September 27, 2010.
- US Department of Health and Human Services, Office of the Surgeon General, Substance Abuse and Mental Health Services Administration. Mental health: culture, race, and ethnicity: a supplement to mental health: a report of the Surgeon General. Rockville, MD: US Department of Health and Human Services, Office of the Surgeon General, Substance Abuse and Mental Health Services Administration; 2001. Available at http://www.surgeongeneral.gov/library/mentalhealth/cre. Accessed September 27, 2010.
- Mojtabai R. Unmet need for treatment of major depression in the United States. Psychiatr Serv 2009;60:297--305.
- Lewis G, Booth M. Regional differences in mental health in Great Britain. J Epidemiol Community Health 1992;46:608--11.
* Additional information available at http://www.cdc.gov/brfss/technical_infodata/surveydata.htm.
† The remaining six criteria were 1) "trouble falling asleep or staying asleep or sleeping too much," 2) "feeling tired or having little energy," 3) "poor appetite or overeating," 4) feeling bad about yourself or that you were a failure or let yourself or your family down," 5) "trouble concentrating on things, such as reading the newspaper or watching television," and 6) "moving or speaking so slowly that other people could have noticed . . . or the opposite: being so fidgety or restless that you were moving around a lot more than usual."
§ Information available at http://www.thecommunityguide.org/mentalhealth/collab-care.html.
What is already known on this topic?
Depression is a common and treatable mental disorder, with an estimated 6.6% of the U.S. adult population (often including persons with chronic conditions or unhealthy behaviors) experiencing a major depressive disorder during a 12-month period.
What does this report add?
In 2006 and 2008, an estimated 9.0% of U.S. adults reported symptoms for current depression (i.e., during the preceding 2 weeks), including 3.4% who reported symptoms for major depression, among 235,067 survey respondents in 45 states, the District of Columbia, and two U.S. territories. By state, estimates for current depression varied widely, ranging from 4.8% in North Dakota to 14.8% in Mississippi.
What are the implications for public health?
States that monitor the prevalence of current depression and major depression can analyze their data by participant characteristics, identify those populations at greatest risk, and target them for interventions.
FIGURE. Age-standardized* percentage of adults meeting criteria for current depression,† by state/territory --- Behavioral Risk Factor Surveillance System, United States, 2006 and 2008§
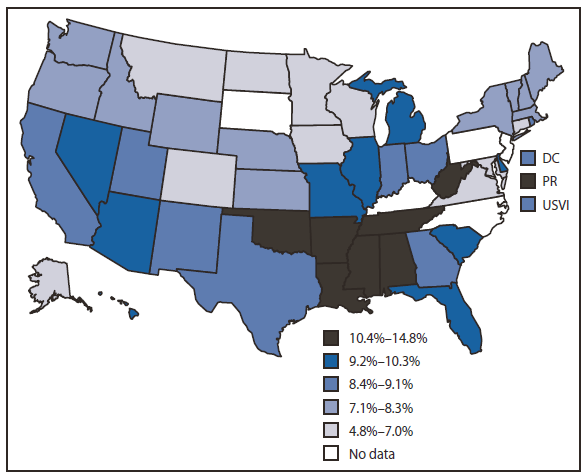
* Age standardized to the 2000 U.S. standard population.
† Based on responses to Patient Health Questionnaire 8.
§ Data presented were collected by 16 states in 2008 and by 29 different states, the District of Columbia, and two territories in 2006. Five states (Kentucky, New Jersey, North Carolina, Pennsylvania, and South Dakota) did not participate in either year. Nine states (Hawaii, Kansas, Louisiana, Maine, Mississippi, Nebraska, North Dakota, Vermont, and Washington) participated in both years, but only 2008 data were included.
Alternate Text: The figure above is a U.S. map showing the age-standardized percentage of adults meeting criteria for current depression in the United States in 2006 and 2008, by state and territory. Estimates for current depression ranged from 4.8% in North Dakota to 14.8% in Mississippi, and the greatest prevalence was mainly concentrated in the southeastern region of the United States.
Use of trade names and commercial sources is for identification only and does not imply endorsement by the U.S. Department of
Health and Human Services.
References to non-CDC sites on the Internet are
provided as a service to MMWR readers and do not constitute or imply
endorsement of these organizations or their programs by CDC or the U.S.
Department of Health and Human Services. CDC is not responsible for the content
of pages found at these sites. URL addresses listed in MMWR were current as of
the date of publication.
All MMWR HTML versions of articles are electronic conversions from typeset documents.
This conversion might result in character translation or format errors in the HTML version.
Users are referred to the electronic PDF version (http://www.cdc.gov/mmwr)
and/or the original MMWR paper copy for printable versions of official text, figures, and tables.
An original paper copy of this issue can be obtained from the Superintendent of Documents, U.S.
Government Printing Office (GPO), Washington, DC 20402-9371;
telephone: (202) 512-1800. Contact GPO for current prices.
**Questions or messages regarding errors in formatting should be addressed to
mmwrq@cdc.gov.
