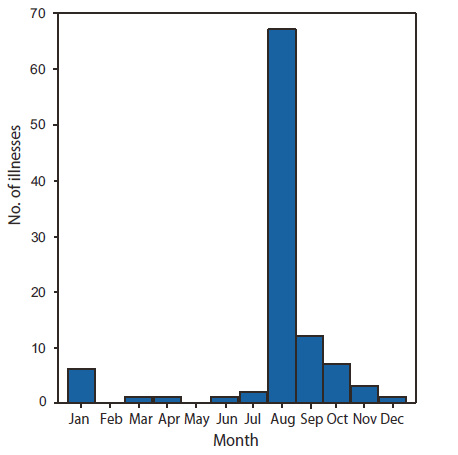
FIGURE. Number (n = 101*) of time-loss heat illnesses † among high school athletes, by month --- National High School Sports-Related Injury Surveillance Study,§ United States, 2005--2009
Persons using assistive technology might not be able to fully access information in this file. For assistance, please send e-mail to: mmwrq@cdc.gov. Type 508 Accommodation and the title of the report in the subject line of e-mail.
Heat Illness Among High School Athletes --- United States, 2005--2009
Heat illness during practice or competition is a leading cause of death and disability among U.S. high school athletes (1). An estimated 7.5 million students participate in high school sports annually (2). To examine the incidence and characteristics of heat illness among high school athletes, CDC analyzed data from the National High School Sports-Related Injury Surveillance Study for the period 2005--2009, which includes the 2005--06, 2006--07, 2007--08 and 2008--09 school years. During 2005--2009, the 100 schools sampled reported a total of 118 heat illnesses among high school athletes resulting in ≥1 days of time lost from athletic activity (i.e., time-loss heat illness), a rate of 1.6 per 100,000 athlete-exposures and an average of 29.5 time-loss heat illnesses per school year. The average corresponds to a weighted average annual estimate of 9,237 illnesses nationwide. The highest rate of time-loss heat illness was among football players, 4.5 per 100,000 athlete-exposures, a rate 10 times higher than the average rate (0.4) for the eight other sports. Time-loss heat illnesses occurred most frequently during August (66.3%) and while practicing or playing football (70.7%). No deaths were reported. Consistent with guidelines from the National Athletic Trainers' Association (NATA) (3), to reduce the risk for heat illness, high school athletic programs should implement heat-acclimatization guidelines (e.g., set limits on summer practice duration and intensity). All athletes, coaches, athletic trainers, and parents/guardians should be aware of the risk factors for heat illness, follow recommended strategies, and be prepared to respond quickly to symptoms of illness. Coaches also should continue to stress to their athletes the importance of maintaining proper hydration before, during, and after sports activities.
The High School Sports-Related Injury Surveillance Study (4), conducted by the Center for Injury Research and Policy at Nationwide Children's Hospital in Columbus, Ohio, has been described in detail previously (5). Each summer, study staff members e-mail all NATA-affiliated certified athletic trainers who have an e-mail address on file with NATA and invite their school to participate in the study. During 2005--2009 the number of certified athletic trainers receiving e-mails was as follows: (2005--06) 4,120; (2006--07) 3,378; (2007--08) 3,755; and (2008--09) 4,496. NATA-affiliated certified athletic trainers, who are trained in illness and injury prevention, assessment, and care, provide services to approximately 42% of the 18,753 public and private high schools in the United States (NATA, unpublished data, 2010). Following the e-mail invitation, interested schools that return a permission form signed by the principal, athletic director, and one certified athletic trainer are categorized into eight strata based on school enrollment (≤1,000 students or >1,000) and U.S. Census geographic location. Subsequently, 12 or 13 schools are chosen randomly from each of the eight strata to constitute a 100-school sample.
During the school year, study staff members e-mail participating certified athletic trainers weekly to remind them to enter their school's injury and exposure data into an online surveillance system. Data are collected on nine sports: football, wrestling, soccer, baseball, and basketball (for boys); and volleyball, soccer, basketball, and softball (for girls). For each illness or injury, the certified athletic trainer is asked to submit a detailed illness/injury report that collects data including the athlete's age, height and weight; illness setting (practice or competition); diagnosis as reported by athletic trainer; number of hours illness occurred after practice began*; and amount of time lost from athletic activity. Data such as height and weight often are measured by the certified athletic trainer but occasionally are self-reported by the athlete. Detailed exposure data, such as ambient temperature, relative humidity, or specific type of heat illness (e.g., heat cramps or heat exhaustion) are not collected. Certified athletic trainers with missing or incomplete reports are e-mailed monthly by study staff members and asked to update information; those not responding to e-mail requests are telephoned and assessed for their willingness to continue participation. During 2005--2009, 90% of the schools reported during all study weeks. Recent internal validity checks in a convenience sample of eight participating schools yielded 100% sensitivity and 99.6% specificity during the reported weeks.
Time-loss heat illness was defined as dehydration or heat exhaustion/heat stroke that 1) resulted from participation in a school-sanctioned practice or competition, 2) was assessed by a medical professional (with or without treatment), and 3) resulted in ≥1 days of time loss from athletic activity. If an athlete sustained a heat illness and returned or was cleared to return to practice or competition the next day, the heat illness was not reportable. Exposures to sports activities were measured by "athlete-exposures." One athlete-exposure was defined as one athlete participating in one practice or one competition. Rates per 100,000 athlete exposures were calculated based on the actual number of time-loss heat illnesses reported by the schools.
Each case of time-loss heat illness was assigned a sample weight on the basis of the inverse of the school selection probability, using stratifications based on school enrollment and U.S. Census geographic location. These weights were summed to provide national estimates of time-loss heat illness, from which average annual estimates were calculated. Confidence intervals were calculated by use of a direct variance estimation procedure that accounted for the sample weights and the complex sample design. Finally, although heat illness might have a geographic distribution, this study was designed to provide national estimates only.
During 2005--2009, a total of 118 time-loss heat illnesses (an average of 29.5 per school year) were reported by the 100 participating schools in the nine sports studied. These data correspond to an estimated average annual number of 9,237 (95% confidence interval [CI] = 8,357--10,116) time-loss heat illnesses nationwide. The majority of time-loss heat illnesses occurred among high school football players (70.7%), who sustained an estimated average annual 6,529 (CI = 5,794--7,264) time-loss heat illnesses. Time-loss heat illness among high school athletes occurred most frequently in August (66.3%) (Figure), the month when most schools begin preseason sports training.
The highest rate of time-loss heat illness was among football players, 4.5 per 100,000 athlete-exposures (Table 1), a rate 10 times higher than the average rate (0.4) for the eight other sports. Football time-loss heat illness rates were similar in practice (4.4) and competition (4.7) (Table 1); 76.7% occurred during preseason (Table 2). Although football practice and competition had similar rates, because more time (including preseason) is spent practicing, 83.6% of all football time-loss heat illnesses occurred during practice. Football time-loss heat illnesses during practice usually occurred 1--2 hours (46.6%) or >2 hours (37.2%) after practice had begun. The majority of illnesses (58.2%) occurred among varsity football players and among juniors (35.6%) or seniors (28.3%). Affected football players commonly had a body mass index† categorized as overweight (37.1%) or obese (27.6%). The majority of football players (63.1%) returned to play 1--2 days after illness onset.
Reported by
J Gilchrist, MD, Div of Unintentional Injury Prevention; T Haileyesus, MS, Office of Statistics and Programming, National Center for Injury Prevention and Control; M Murphy, PhD, Health Studies Br, National Center for Environmental Health, CDC. RD Comstock, PhD, Center for Injury Research and Policy, Nationwide Children's Hospital and Ohio State Univ; C Collins, MA, N McIlvain, Center for Injury Research and Policy, Nationwide Children's Hospital, Columbus, Ohio. E Yard, PhD, EIS Officer, CDC.
Editorial Note
This analysis is the first to report national estimates for time-loss heat illness among high school athletes. The findings in this report indicate that time-loss heat illness occurred most frequently among football players (4.5 time-loss heat illnesses per 100,000 athlete-exposures) and during August (66.3%). The findings are consistent with previous studies reporting that football players accounted for 5.3% of all nonfatal heat-related visits to emergency departments (6) and that 88% of football heat illnesses occurred in August (7). This study found that 64.7% of football players sustaining a heat illness were either overweight or obese. Obesity has been shown to be a risk factor for heat illness because fat decreases heat loss; a previous study reported that 47.1% of all high school football players were overweight or obese (8). In the absence of prompt intervention, heat illness can result in permanent morbidity (e.g., neurologic, cardiac, renal, gastrointestinal, hematologic, or muscle dysfunction) or mortality. These results support the existing NATA recommendations to continue emphasis of appropriate primary and secondary prevention strategies.
All heat illnesses in high school athletes are preventable. Since 1995, according to an annual survey of catastrophic football injuries, 31 high school football players have died from heat stroke.§ One component of primary prevention is the implementation of acclimatization periods to prepare participants for strenuous activity in warm or humid weather. Acclimatization is particularly important during preseason football practices, which typically occur during the hottest and most humid period of summer and when participants are least physically fit. Current NATA recommendations suggest implementation of a 14-day acclimatization period for all warm weather conditioning, with practice frequency, duration, and intensity as well as protective equipment usage increased gradually (3,9). Another primary prevention strategy is educating participants regarding heat-related illness and the importance of proper hydration before, during, and after strenuous activity (3). According to NATA, fluid replacement should approximate sweat and urine losses so that athletes lose no more than 2% body weight per day; on average, this equates to consuming 200--300 mL fluid every 10--20 minutes during exercise (10).
Ambient temperature, relative humidity, wind speed, and solar radiant heat all affect risk for heat illness (3). For example, although NATA guidelines suggest that a temperature of 90° at 20% humidity could be suitable for conducting football practice with full protective gear, a temperature of 90° at 80% humidity could create a dangerous environment for which activity and equipment use should be limited (3). Thus, NATA recommends that coaches and athletic administrators monitor ambient temperature and relative humidity and be prepared to implement appropriate activity restrictions (3).
When a participant shows signs of heat illness, secondary prevention is crucial to prevent progression. Any person exhibiting nausea, vomiting, headache, dizziness, or mental status change should be immediately evaluated for potential heat exhaustion or heat stroke by a health professional (3). In mild cases of heat illness (e.g., dehydration or heat cramps), simple interventions that include removal from activity and rehydration can be sufficient. However, more advanced conditions, such as heat exhaustion or heat stroke, require aggressive interventions such as cold water immersion and chilled intravenous fluids to lower core body temperature as rapidly as possible (3,10).
The findings in this report are subject to at least one limitation. These results are an underestimate of the actual magnitude of heat illness among high school athletes because only heat illnesses resulting in ≥1 days time loss were reportable, only nine sports were assessed, and only schools with an NATA-affiliated certified athletic trainer were included.
If left untreated, heat illness can progress to heat stroke and result in permanent illness or death; thus, prevention is critical. Athletes, coaches, athletic trainers, and parents/guardians should be aware of the hazards and risk factors, follow recommended prevention strategies, and be prepared to respond quickly. CDC is developing an Internet-based course for coaches and others associated with high school athletics to help prevent, recognize, and respond to heat-related illness among student athletes.
References
- Mueller FO, Cantu RC. Catastrophic sports injury research: twenty-sixth annual report. Chapel Hill, NC: University of North Carolina; 2008. Available at http://www.unc.edu/depts/nccsi/AllSport.pdf. Accessed August 13, 2010.
- National Federation of State High School Associations. Participation survey results. Indianapolis, IN: National Federation of State High School Associations; 2010. Available at http://www.nfhs.org/participation. Accessed August 13, 2010.
- Binkley HM, Beckett J, Casa DJ, Kleiner DM, Plummer PE. National Athletic Trainers' Association position statement: exertional heat illnesses. J Athl Train 2002;37:329--43.
- CDC. Sports-related injuries among high school athletes---United States, 2005--06 school year. MMWR 2006;55:1037--40.
- Collins CL, McIlvain NM, Yard EE, Comstock RD. National High School Sports-Related Injury Surveillance Study---2008--09 school year. Columbus, OH: Nationwide Children's Hospital; 2009. Available at http://injuryresearch.net/resources/1/rio/2008-09highschool%20riosummaryreport.pdf. Accessed August 13, 2010.
- Sanchez CA, Thomas KE, Malilay J, Annest JL. Nonfatal natural and environmental injuries treated in emergency departments, United States, 2001--2004. Fam Community Health 2010;33:3--10.
- Cooper ER, Ferrara MS, Broglio SP. Exertional heat illness and environmental conditions during a single football season in the southeast. J Athl Train 2006;41:332--6.
- Choate N, Forster C, Almquist J, Olsen C, Poth M. The prevalence of overweight in participants in high school extramural sports. J Adolesc Health 2007;40:283--5.
- Casa DJ, Csillan D. Preseason heat-acclimatization guidelines for secondary school athletics. J Athl Train 2009;44:332--3.
- Casa DJ, Armstrong LE, Hillman SK, Montain SJ, Reiff RV, et al. National Athletic Trainers' Association position statement: fluid replacement for athletes. J Athl Train 2000;35:212--24.
* Participants were given the following options: <0.5 hour, 0.5--1 hour, 1--2 hours, and >2 hours.
† Body mass index (BMI) = weight (kg) / [height (m2)]. BMI classifications: <18.5 underweight, 18.5--24.9 normal weight, 25--29.9 overweight, ≥30 obese.
§ Available at http://www.unc.edu/depts/nccsi/2009AnnualFootball.pdf.
What is already known on this topic?
Heat illness during practice or competition is a leading cause of death and disability among U.S. high school athletes.
What is added by this report?
An estimated average annual number of 9,237 time-loss heat illnesses occur among U.S. high school athletes, most commonly during preseason football practice.
What are the implications for public health practice?
To reduce the risk for heat illness, high school athletic programs should follow National Athletic Trainers Association recommendations, such as implementing preseason heat-acclimatization guidelines and encouraging proper hydration before, during, and after sports activity.
* Excludes 17 cases with missing dates.
† Defined as dehydration or heat exhaustion/heat stroke that 1) resulted from participation in a school-sanctioned practice or competition, 2) was assessed by a medical professional (with or without treatment), and 3) resulted in ≥1 days of time loss from athletic activity.
§ Data based on reports from a 100-school sample.
Alternate Text: The figure above shows the month in which 101 cases of time-loss heat illness occurred, as reported by the National High School Sports-Related Injury Surveillance Study during 2005–2009. Seventeen additional cases were excluded because of missing dates. The majority (66.3%) of cases occurred in August.
Use of trade names and commercial sources is for identification only and does not imply endorsement by the U.S. Department of
Health and Human Services.
References to non-CDC sites on the Internet are
provided as a service to MMWR readers and do not constitute or imply
endorsement of these organizations or their programs by CDC or the U.S.
Department of Health and Human Services. CDC is not responsible for the content
of pages found at these sites. URL addresses listed in MMWR were current as of
the date of publication.
All MMWR HTML versions of articles are electronic conversions from typeset documents.
This conversion might result in character translation or format errors in the HTML version.
Users are referred to the electronic PDF version (http://www.cdc.gov/mmwr)
and/or the original MMWR paper copy for printable versions of official text, figures, and tables.
An original paper copy of this issue can be obtained from the Superintendent of Documents, U.S.
Government Printing Office (GPO), Washington, DC 20402-9371;
telephone: (202) 512-1800. Contact GPO for current prices.
**Questions or messages regarding errors in formatting should be addressed to
mmwrq@cdc.gov.
