Persons using assistive technology might not be able to fully access information in this file. For assistance, please send e-mail to: mmwrq@cdc.gov. Type 508 Accommodation and the title of the report in the subject line of e-mail.
Expanded HIV Testing and Trends in Diagnoses of HIV Infection --- District of Columbia, 2004--2008
In the District of Columbia (DC), the human immunodeficiency virus (HIV) case rate is nearly 10 times the U.S. rate and higher than comparable U.S. cities, such as Baltimore, Philadelphia, New York City, Detroit, and Chicago (1,2). In June 2006, the DC Department of Health (DCDOH) began implementing CDC's 2006 recommendations for routine, voluntary HIV screening in health-care settings (3). To describe recent trends in HIV disease and testing, CDC and DCDOH analyzed DC HIV case surveillance data, HIV testing data, and data from the Behavioral Risk Factor Surveillance System (BRFSS) (4). This report summarizes the results of that analysis, which indicated that the rate of newly diagnosed acquired immunodeficiency syndrome (AIDS) cases decreased consistently, from 164 cases per 100,000 in 2004 to 137 in 2007 and 107 in 2008. Among newly diagnosed AIDS cases, the number and rate were higher among blacks/African Americans compared with whites and Hispanics/Latinos. During 2005--2007, BRFSS results showed a significant increase in the proportion of the population that had been tested for HIV within the past 12 months, from 15% to 19%. Although the causes of the improvement in these indicators are unknown and cannot be linked to any specific intervention, they suggest improvements in the delivery of HIV testing and linkage to care services in DC. To address continuing racial disparities, DCDOH has increased HIV education and prevention efforts through enhanced collaborations, working with DC residents as spokespersons for local marketing campaigns and creating toolkits for health-care providers to expand HIV testing and linkage to care (5).
In 2006, CDC revised its HIV testing recommendations to include implementation of routine, voluntary HIV testing in health-care settings for all persons aged 13--64 years (3). To implement these recommendations, DCDOH engaged multiple community-based and clinical providers throughout DC to perform rapid HIV screening, launched extensive social marketing campaigns to educate DC residents and providers about routine HIV testing, and trained providers to facilitate immediate linkage to care among those testing HIV-positive (5).
To describe recent trends in HIV disease and testing in DC, DCDOH used several indicators, including 1) AIDS diagnoses, 2) the proportion of persons entering HIV care within 3 months of diagnosis, 3) client-level data on publicly funded HIV testing data, collected through the Program Evaluation and Monitoring System (PEMS), and 4) the prevalence of self-reported HIV testing among participants in the 2005 and 2007 BRFSS. AIDS diagnosis currently is the best indicator for the status of the HIV epidemic in DC. Since 1981, DCDOH has required that all laboratories and health-care providers report confirmed cases of AIDS by name, including HIV-related laboratory data and clinical diagnostic information (6). In 2001, DC added code-based HIV reporting. Only in November 2006 did DC begin integrated, confidential, named-based HIV and AIDS reporting, and no name-based HIV diagnosis data are yet available.
DCDOH used HIV case surveillance data for residents of DC reported to DCDOH through December 31, 2009, to determine the number and percentage of adolescents and adults aged >12 years newly diagnosed with AIDS during 2004--2008, overall and by race/ethnicity (black/African American, Hispanic/Latino, and white) and sex.* Data are reported through 2008, the most recent year for which data are available, and are not adjusted for reporting delays. Cell sizes of five or fewer persons were not reported in accordance with DCDOH practice. Rates were calculated using DC population estimates from U.S. Census data.† Estimated annual percentage changes (EAPCs) in new AIDS diagnoses were calculated using Poisson regression, with p<0.05 indicating significance.
The proportion of cases that had a CD4 count within 3 months of a new HIV diagnosis was used as an indicator of entry to HIV care. Since the start of AIDS reporting, DCDOH has received laboratory reports of CD4+ cell counts, and in more recent years, HIV viral load tests, and has matched these reports to HIV case surveillance data.§ In accordance with national recommendations (7), DCDOH recommends that the first visit to a health-care provider be within 3 months of HIV diagnosis.
DCDOH used client-level data on publicly funded HIV testing data, collected through the Program Evaluation and Monitoring System (PEMS), to calculate the number and percentage of tests conducted during 2004--2008 by race/ethnicity and year of test (8). These tests are paid for by CDC and administered throughout DC at both medical and nonmedical sites. Data are collected on all persons tested, inclusive of client demographics, testing site, HIV test results, and referrals. In addition, data from the 2005 and 2007 BRFSS (4), a telephone survey on health behaviors among DC residents, were analyzed to evaluate the impact of increased testing efforts at a population level; sampling-weighted frequencies and percentages were used to describe testing by race/ethnicity. Logistic regression was performed to evaluate the difference in proportions in 2005 compared with 2007, with p<0.05 indicating significance. For 2005 and 2007, the Council of American Survey and Research Organizations (CASRO) response rate was 44.7% and 38.6%, and the cooperation rate was 75% and 67%, respectively.¶
During 2004--2008, a total of 3,312 new AIDS cases were diagnosed among blacks/African Americans, Hispanics/Latinos, and whites in DC. Blacks/African Americans accounted for the highest proportion of diagnoses overall (86%) and for 82% and 94% of diagnoses among males and females, respectively (Table 1). During this period, the overall number and rate of newly diagnosed AIDS cases decreased 35%, from 164 cases per 100,000 to 107 cases per 100,000 (EAPC = -9.2; p<0.001). The decrease was 58% among Hispanics/Latinos (EAPC = -17.8; p<0.001), 32% among blacks/African Americans (EAPC = -7.1; p=0.002), and 23% among whites (EAPC = -6.9; p<0.001).
The overall proportion of persons newly diagnosed with HIV who had a CD4 count within 3 months of diagnosis increased, from 62% in 2004 to 64% in 2008 (p=0.006). The only significant increase in this proportion by racial/ethnic group was observed among blacks/African Americans, from 60% in 2004 to 63% in 2008 (p=0.009).
During 2004--2008, the number of publicly funded HIV tests in DC increased by 335% (from 16,748 tests in 2004 to 72,864 in 2008) among community-based and clinical providers, including a 415% increase among blacks/African Americans (from 10,924 in 2004 to 56,278 in 2008) (Figure). The number of persons testing positive increased by 353%, from 246 in 2004 to 1,115 in 2008. The proportion of persons testing positive in 2004 and 2005 was 1.5% and 1.8%, respectively. This proportion peaked in 2006 at 2.5%, and then decreased to 1.4% and 1.7% in 2007 and 2008, respectively.
During 2005--2007, the overall proportion of persons self-reporting tests for HIV within the past 12 months increased, from 14.9% in 2005 to 18.7% in 2007 (p<0.001). The highest overall testing proportions and the largest increases in these testing indicators were among blacks/African Americans (Table 2).
Reported by
T West-Ojo, MSPH, R Samala, MPH, A Griffin, MSPH, N Rocha, S Hader, MD, District of Columbia Dept of Health. AD Castel, MD, M Befus, George Washington Univ School of Public Health and Health Svcs. MY Sutton, MD, L Willis, PhD, HI Hall, PhD, Y Lanier, PhD, TH Sanchez, DVM, A Satcher Johnson, MPH, PH Kilmarx, MD, Div of HIV/AIDS Prevention, National Center for HIV, Viral Hepatitis, STD, and TB Prevention, CDC.
Editorial Note
This report indicates several favorable trends in indicators of the HIV epidemic in DC for 2004--2008. Although an analysis such as the one presented in this report cannot definitively link trends to specific interventions, these trends might be related to a comprehensive prevention, care, and treatment portfolio implemented by DCDOH in 2006 to address the HIV epidemic. In addition, in June 2006 (in anticipation of the September 2006 publication of CDC's recommendations for routine HIV screening in health-care settings [3]), DCDOH launched a citywide initiative to increase HIV testing and treatment programs. After the interventions, more than a threefold increase occurred in the number of publicly funded HIV tests conducted by community-based and clinical providers, and a 26% increase occurred in the proportion of persons who had been tested within the past 12 months.
Other favorable trends occurred during 2004--2008. DC residents with HIV had small but statistically significant increases in CD4 counts within 3 months of diagnosis, suggesting improvements in early linkage to care. Also, fewer AIDS diagnoses occurred over time. Like the other favorable trends, these cannot be attributed definitively to specific interventions, but they might indicate some success in DCDOH efforts to engage local providers through increased HIV education and social marketing campaigns.
Only a minimal increase occurred in the proportion of newly diagnosed HIV-infected persons being linked to care within 3 months of diagnosis. Efforts are ongoing to improve community and clinical linkages that promote HIV care and treatment and support appointments being made within 72 hours of a new HIV diagnosis (5). Also, a recent analysis indicated that during 2004--2008, HIV-infected DC residents were being diagnosed at earlier stages of HIV disease, as indicated by higher CD4 counts at diagnosis and a decreasing proportion of late testers (i.e., HIV diagnosis occurring within 12 months of AIDS diagnosis) among AIDS cases (9).
The burden of disease among blacks/African Americans in DC is especially high. In 2008, blacks/African Americans represented 55% of DC's population, but accounted for 78% of those living with HIV infection and 86% of newly diagnosed AIDS cases (1).** The HIV prevalence among blacks/African Americans in DC was 4.7% (1).
The findings in this report are subject to at least four limitations. First, DC transitioned from a code-based system of reporting HIV cases to confidential, name-based reporting in late 2006. DCDOH estimates that 5% of the cases reported before 2006 were duplicate cases (1). Second, delays in HIV and AIDS case reporting have been observed in DC. DCDOH expects that the number of cases diagnosed in 2008 will continue to increase as new reports of cases are received. Third, HIV testing data reflect the number of tests conducted and cannot be used to infer the number of persons tested in DC, because a person could be tested more than once in a single year. Finally, sampling bias is possible with BRFSS data because it is a telephone survey and the sampling frame includes only those adults with landline telephones; the growing population of persons with only cellular telephones has not yet been sampled through BRFSS in DC.
Research exploring sociodemographic factors in areas of high AIDS and high poverty rates in DC, which occur disproportionately among blacks/African Americans, suggest that lack of knowledge of one's HIV status and partners' HIV status, and missed opportunities to diagnose HIV in routine clinical settings, are contributing factors to the HIV epidemic among blacks/African Americans in DC (2,10). This report suggests that ongoing and increased HIV testing and efforts to ensure linkage to care are warranted.
References
- Government of the District of Columbia Department of Health. HIV/AIDS, hepatitis, STD, and TB epidemiology annual report: 2009 update. Washington, DC: Government of the District of Columbia Department of Health; 2010. Available at http://dchealth.dc.gov/doh/frames.asp?doc=/doh/lib/doh/services/administration_offices/hiv_aids/pdf/annual_report_hahsta_march_2010.pdf. Accessed June 17, 2010.
- Magnus M, Kuo I, Shelley K, et al. Risk factors driving the emergence of a generalized heterosexual HIV epidemic in Washington, District of Columbia networks at risk. AIDS 2009;23:1277--84.
- CDC. Revised recommendations for HIV testing of adults, adolescents, and pregnant women in health-care settings. MMWR 2006;55(No. RR-14).
- CDC. About the BRFSS: turning information into public health. Available at http://www.cdc.gov/brfss/about.htm. Accessed June 17, 2010.
- Greenberg AE, Hader SL, Masur H, et al. Fighting HIV/AIDS in Washington, DC. Health Affairs 2009;28:1677--87.
- Government of the District of Columbia Department of Health. District of Columbia HIV-AIDS reporting requirements (effective November 17, 2006). Washington, DC: Government of the District of Columbia Department of Health; 2006. Available at http://doh.dc.gov/doh/frames.asp?doc=/doh/lib/doh/services/administration_offices/hiv_aids/pdf/dc_hivaids_reporting_final_rulemaking_11_17_06.pdf. Accessed June 17, 2010.
- Panel on Antiretroviral Guidelines for Adults and Adolescents. Guidelines for the use of antiretroviral agents in HIV-1-infected adults and adolescents. Washington, DC: US Department of Health and Human Services; 2009. Available at http://www.aidsinfo.nih.gov/contentfiles/adultandadolescentgl.pdf. Accessed June 17, 2010.
- Thomas CW, Smith BD, Wright-DeAgüero L. The Program Evaluation and Monitoring System: a key source of data for monitoring evidence--based HIV prevention program processes and outcomes. AIDS Educ Prev 2006;18(Suppl A):74--80.
- Castel A, Samala R, Griffin A, et al. Monitoring the impact of expanded HIV testing in the District of Columbia using population-based HIV/AIDS surveillance data. Proceedings from the 17th Conference on Retroviruses and Opportunistic Infections [oral presentation], San Francisco, CA; February 17, 2010. Available at http://retroconference.org/2010/abstracts/38192.htm. Accessed June 23, 2010.
- Marks G, Crepaz N, Janssen RS. Estimating sexual transmission of HIV from persons aware and unaware that they are infected with the virus in the USA. AIDS 2006;20:1447--50.
* Newly diagnosed cases are those that have not been previously reported to the DCDOH HIV/AIDS surveillance system. They do not necessarily reflect newly infected or incident cases of HIV infection.
† Available at http://www.census.gov/popest/estbygeo.html.
§ Lower CD4 counts indicate more immune suppression and potentially more advanced HIV disease, with a CD4 count <200 cells/µL indicating advanced HIV disease. CD4 counts and viral load tests typically are only conducted after an HIV diagnosis has been made and a patient begins seeing a health-care provider for HIV care.
¶ The CASRO response rate is the percentage of persons who completed interviews among all eligible persons, including those who were not successfully contacted. The cooperation rate is the percentage of persons who completed interviews among all eligible persons who were contacted. The BRFSS cooperation rate is an outcome rate with the number of completes in the numerator and the number of eligible respondents who are capable of completing the survey in the denominator. Question asked for BRFSS 2005 and 2007: "Have you ever been tested for HIV?"
** Based on U.S. Census data, available at http://www.census.gov/popest/estbygeo.html.
What is already known on this topic?
Blacks/African Americans are disproportionately affected by the HIV epidemic in the District of Columbia (DC).
What is added by this report?
Starting in 2006, the DC Department of Health expanded HIV testing and linkage to care by increasing education and social marketing efforts with local health-care providers; by 2008, increases were observed in DC residents who were tested for HIV within the past 12 months, and fewer AIDS diagnoses occurred over time.
What are the implications for public health practice?
Increased prevention efforts with social marketing and HIV education, as well as expanded HIV testing and linkage to care, might counter this epidemic and decrease racial/ethnic HIV disease disparities in DC.
FIGURE. Number of publicly funded HIV tests among adults and adolescents,* by race/ethnicity --- District of Columbia, 2004--2008
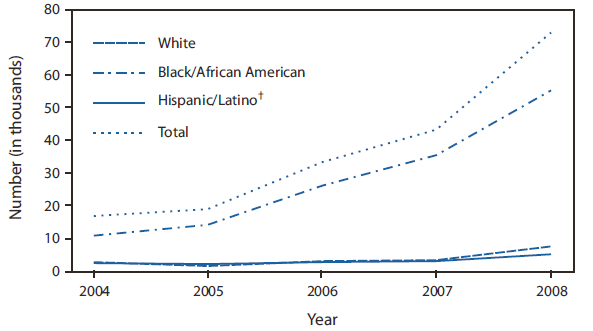
* Persons aged >12 years.
† Hispanics/Latinos might be of any race.
Alternate Text: The figure above shows the number of publicly funded HIV tests among adults and adolescents, by race/ethnicity, for the District of Columbia during 2004-2008. During 2004-2008, the number of publicly funded HIV tests in DC increased by 335% (from 16,748 tests in 2004 to 72,864 in 2008) among community-based and clinical providers, including a 415% increase of HIV tests among blacks/African Americans (from 10,924 in 2004 to 56,278 in 2008).
Use of trade names and commercial sources is for identification only and does not imply endorsement by the U.S. Department of
Health and Human Services.
References to non-CDC sites on the Internet are
provided as a service to MMWR readers and do not constitute or imply
endorsement of these organizations or their programs by CDC or the U.S.
Department of Health and Human Services. CDC is not responsible for the content
of pages found at these sites. URL addresses listed in MMWR were current as of
the date of publication.
All MMWR HTML versions of articles are electronic conversions from typeset documents.
This conversion might result in character translation or format errors in the HTML version.
Users are referred to the electronic PDF version (http://www.cdc.gov/mmwr)
and/or the original MMWR paper copy for printable versions of official text, figures, and tables.
An original paper copy of this issue can be obtained from the Superintendent of Documents, U.S.
Government Printing Office (GPO), Washington, DC 20402-9371;
telephone: (202) 512-1800. Contact GPO for current prices.
**Questions or messages regarding errors in formatting should be addressed to
mmwrq@cdc.gov.
