Persons using assistive technology might not be able to fully access information in this file. For assistance, please send e-mail to: mmwrq@cdc.gov. Type 508 Accommodation and the title of the report in the subject line of e-mail.
Perceived Health Needs and Receipt of Services During Pregnancy --- Oklahoma and South Carolina, 2004--2007
Prenatal care visits present an opportunity for health-care providers to offer services recommended by professional societies and educate women regarding behaviors and exposures that might affect their pregnancies. To determine whether women who identified a need for a service during pregnancy received that service, CDC analyzed 2004--2007 data (the most recent available) from the Pregnancy Risk Assessment Monitoring System (PRAMS) for Oklahoma and South Carolina, the only two states to include questions on the topic on their PRAMS questionnaires. This report summarizes the results of that analysis, which indicated substantial differences between perceived need and receipt of 1) assistance in reducing violence in the home, 2) counseling information for family or personal problems, 3) help to quit smoking, 4) help with an alcohol or drug problem, and 5) dental care. In South Carolina and Oklahoma, respectively, 1.7% and 2.9% of pregnant women stated a need for help to reduce violence in the home. Of those, only 12.8% and 21.0% reported receiving that help. In South Carolina and Oklahoma, respectively, 7.4% and 12.6% of pregnant women stated a need for help to quit smoking during pregnancy; of those, only 29.1% and 30.4% reported receiving that help. Adherence by health-care providers to established guidance for treating pregnant women might help reduce the differences between perceived need and receipt of services. Additional research to identify obstacles to receipt of services might enable state programs to further narrow these differences.
PRAMS is a population-based surveillance system that collects data on a wide range of maternal behaviors and experiences before, during, and after pregnancy. PRAMS surveys currently are conducted in 37 states and New York City. Each month, participating sites select a stratified random sample of 100--300 women with recent live births from birth certificate records. A questionnaire is mailed to the women 2--6 months after delivery. The participating sites use a standard core PRAMS questionnaire, to which they can add questions. Women receive up to three questionnaire mailings, and nonresponders receive follow-up telephone calls.
CDC analyzed PRAMS data collected from 7,824 respondents in Oklahoma and 5,474 respondents in South Carolina during 2004--2007; survey response rates ranged from 71% to 80% for Oklahoma and from 68% to 72% for South Carolina. For South Carolina, the 2006 data represented births only from April through September.
Oklahoma and South Carolina are the only two states to add PRAMS questions regarding the self-identified need for selected health services during pregnancy and the subsequent receipt of those services. Regarding needed services, all participants were asked, "During your most recent pregnancy, did you feel you needed any of the following services?" Five services with response choices of "yes" or "no" were listed in both state's surveys: help to reduce violence in your home, counseling information for family or personal problems, help to quit smoking, help with an alcohol or drug problem, and help with or information about breastfeeding. Two additional services were listed in the Oklahoma survey only: dental care and nutrition services (i.e., food stamps; Women, Infants, and Children program; or money to buy food). Two additional services also were listed in the South Carolina survey only: parenting classes and childbirth classes. Regarding receipt of services, all participants also were asked, "During your most recent pregnancy, did you receive any of the following services?" The same services were listed.
Data were weighted in each state to account for complex survey design, nonresponse, and noncoverage. The statistical significance of differences was determined using a chi-square test, with significance determined at p<0.05.
Characteristics of survey participants in Oklahoma and South Carolina during 2004--2007 relating to total number of live births and Medicaid payment for prenatal-care were similar (Table 1). However, the weighted percentages of the participant groups by race/ethnicity, age, education level, marital status, and prenatal care initiation differed significantly. For example, in Oklahoma, 67.3% of participants were non-Hispanic white, 8.3% were non-Hispanic black, 12.8% were Hispanic, and 11.7% were of other races. In contrast, in South Carolina, 56.7% of participants were non-Hispanic white, 31.8% were non-Hispanic black, 8.8% were Hispanic, and 2.6% were of other races (Table 1).
In Oklahoma, the needs most commonly reported were for dental care (50.1%), nutrition assistance (48.0%), and help with or information about breastfeeding (30.0%) (Figure). In South Carolina, the needs most commonly reported were for help with or information about breastfeeding (35.3%), childbirth classes (27.6%), and parenting classes (17.7%) (Figure).
In both states, substantial differences were observed between the percentages of women who perceived needs for services and the percentages of that group who received those services. In Oklahoma and South Carolina, the widest differences were regarding help to reduce violence in the home. Of the 2.9% of women in Oklahoma and 1.7% of women in South Carolina who identified that need during pregnancy, 21.0% and 12.8% reported receiving the service, respectively. Among women who said they needed services in Oklahoma, 27.4% reported receiving counseling information for family or personal problems; 30.4% received help to quit smoking; 34.8% received help with an alcohol or drug problem; and 38.2% received dental care (Table 2). In South Carolina, after help to reduce violence in the home, the widest differences were for help to quit smoking (29.1%) and getting counseling information for family or personal problems (30.0%) (Table 2). Among services included in the surveys of both states, the narrowest difference was observed regarding help with information about breastfeeding. In Oklahoma, 82.4%, and in South Carolina, 79.8%, of those who perceived a need for breastfeeding help received the service.
Reported by
S Dooley, MS, A Lincoln, MSW, MSPH, Oklahoma State Dept of Health. M Smith, MSPH, South Carolina Dept of Health and Environmental Control. ME O'Neil, MPH, IB Ahluwalia, PhD, DV D'Angelo, MPH, B Morrow, MA, Div of Reproductive Health, National Center for Chronic Disease Prevention and Health Promotion, CDC.
Editorial Note
The findings in this report identify differences between the perceived needs and receipt of certain health services to fill those needs by pregnant women in Oklahoma and South Carolina, despite established guidance for providers to offer these supportive services. For example, only 30.4% of women in Oklahoma who perceived a need during pregnancy for help to quit smoking, and 29.1% of women in South Carolina, received that help. Nationally, an estimated 14% of women smoke during pregnancy, a behavior associated with intrauterine growth restriction, spontaneous abortion, low birth weight, and preterm delivery (1). The American College of Obstetricians and Gynecologists (ACOG) recommends that physicians screen and counsel pregnant women regarding smoking cessation; ACOG has found that 46% of women who smoked before pregnancy quit during pregnancy (2).
The findings show that only 34.8% of women in Oklahoma and 35.8% of women in South Carolina who perceived a need for help with an alcohol or drug problem received that help. A joint statement by ACOG and the American Academy of Pediatrics advises physicians to screen for alcohol use during pregnancy because prenatal exposure to alcohol is a leading preventable cause of fetal neurodevelopmental disorders (3). ACOG also recommends screening for illicit drug use and provides physicians with tools to identify and treat drug abuse (3).
The data also show that only 21.0% and 12.8% of postpartum women in Oklahoma and South Carolina, respectively, who felt a need for help during pregnancy in reducing violence in their home received that help. The prevalence of women in Oklahoma and South Carolina reporting intimate partner violence during pregnancy was 4.4% and 2.7%, respectively, in 2007 (4). The American College of Nurse-Midwives (ACNM) recommends that health-care providers attempt to identify intimate partner violence and provide information on resources available to women (5).
The most commonly reported need in Oklahoma was dental care, a need perceived by 50.1% of pregnant women, but a service received by only 38.2% of those who cited the need. The American Academy of Periodontology recommends women visit dentists for care during their pregnancy (6). However, a survey of obstetrician-gynecologists found that 38% did not advise their patients to seek dental care, and 77% reported their patients had declined dental services because they were pregnant, despite evidence showing that receipt of oral health care during pregnancy is safe (7).
An encouraging finding is that, in both Oklahoma and South Carolina, approximately 80% of women who perceived a need for breastfeeding support received it. ACOG and ACNM recommend that health-care professionals, hospitals, and employers support women who choose to breastfeed their infants (8,9). Breastfeeding initiation rates increased nationally from 26.5% in the 1970s to 74.2% in 2005 (10). This gain can, in part, be attributed to an increased number of health-care providers educating women on breastfeeding, lactation support, breastfeeding accommodations in the workplace, and legislation that has created a more supportive environment for breastfeeding women (10).
The findings in this report are subject to at least three limitations. First, the results apply only to women who delivered live-born infants and not to all women who were pregnant. Second, contextual information regarding the services was not collected, such as information that might indicate the degree to which women sought the needed services or why they were not able to obtain them (e.g., lack of dental care coverage). Finally, all PRAMS data are self-reported and subject to recall bias if women did not accurately remember what needs they had and services they received during pregnancy.
The PRAMS surveillance system was established to provide state-level data on women's health before, during, and after pregnancy to help health agencies and researchers monitor trends in maternal and infant health indicators. Other states might consider collecting information on women's perceived need and receipt of services during pregnancy. Continued use of PRAMS data to monitor access to services is important for evaluating and setting priorities for future initiatives to address issues important to women and their families.
Acknowledgments
This report is based, in part, on contributions by K Helms, M Smith, K Wilkerson, South Carolina PRAMS, and S Dooley, A Lincoln, and W Thomas, Oklahoma PRAMS).
References
- CDC. Trends in smoking before, during, and after pregnancy---Pregnancy Risk Assessment Monitoring System (PRAMS), United States, 31 sites, 2000--2005. Surveillance Summaries. May 29, 2009. MMWR 2009;58(No. SS-4).
- American College of Obstetricians and Gynecologists. ACOG committee opinion no. 316: smoking cessation during pregnancy. Obstet Gynecol 2005;106:883--8.
- American College of Obstetricians and Gynecologists. ACOG committee opinion no. 422: at-risk drinking and illicit drug use: ethical issues in obstetric and gynecologic practice. Obstet Gynecol 2008;112:1449--60.
- CDC. CPONDER---CDC's PRAMS on-line data for epidemiologic research. Available at http://www.cdc.gov/prams/cponder.htm. Accessed November 18, 2009.
- American College of Nurse-Midwives. Position statement: violence against women. Silver Spring, MD: American College of Nurse-Midwives; 2003. Available at http://www.midwife.org/sitefiles/position/violence_against_women_05.pdf. Accessed June 11, 2010.
- American Academy of Periodontology. American Academy of Periodontology statement regarding periodontal management of the pregnant patient. J Periodontol 2004;75:495.
- Morgan MA, Crall J, Goldenberg RL, Schulkin J. Oral health during pregnancy. J Matern Fetal Neonatal Med 2009;22:733--9.
- American College of Obstetricians and Gynecologists. ACOG committee opinion no. 361: breastfeeding: maternal and infant aspects. Obstet Gynecol 2007;109(2 Pt 1):479--80.
- American College of Nurse-Midwives. Position statement: breastfeeding. Silver Spring, MD: American College of Nurse-Midwives; 2003. Available at http://www.midwife.org/sitefiles/position/breastfeeding_05.pdf. Accessed June 11, 2010.
- Grummer-Strawn LM, Shealy KR. Progress in protecting, promoting, and supporting breastfeeding: 1984--2009. Breastfeed Med 2009;4(Suppl 1):S31--9.
What is already known on this topic?
Established guidance is available for health-care providers regarding key services for pregnant and postpartum women.
What is added by this report?
In Oklahoma and South Carolina, substantial differences were identified between the perceived needs of pregnant women for certain key services and receipt of those services.
What are the implications for public health practice?
Adherence by health-care providers to established guidance for treating pregnant women might help reduce the differences between perceived need and receipt of services; additional research at the state level might identify reasons why more pregnant women do not receive services after identifying needs.
FIGURE. Percentage of women with recent live births who felt a need for selected health services during pregnancy, by type of service* and receipt status --- Oklahoma and South Carolina, Pregnancy Risk Assessment Monitoring System, 2004--2007
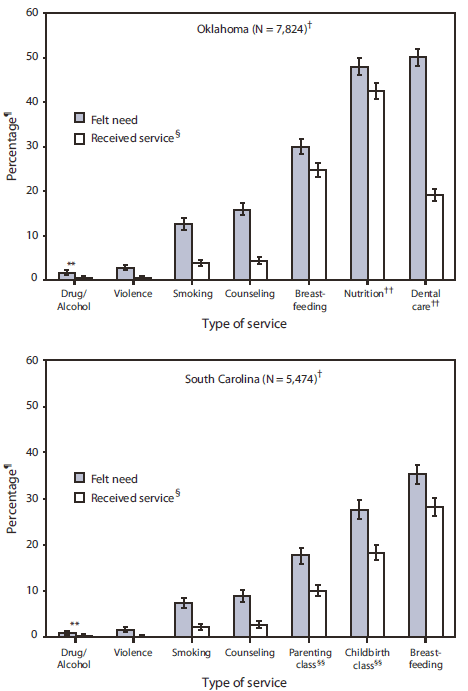
* Help with an alcohol or drug problem, help to reduce violence in the home, help to quit smoking, counseling for family or personal problems, help with or information about breastfeeding, nutrition services, dental care, parenting classes, and childbirth classes.
† Unweighted number of participants.
§ Women who felt a need and also received the service.
¶ Weighted percentage.
** 95% confidence interval.
†† Oklahoma survey only.
§§ South Carolina survey only.
Alternate Text: The figure above shows the percentage of participating women with recent live births who identified a need for selected health services during pregnancy, by type of service and receipt status in Oklahoma and South Carolina from 2004-2007. Source: Pregnancy Risk Assessment Monitoring System.
Use of trade names and commercial sources is for identification only and does not imply endorsement by the U.S. Department of
Health and Human Services.
References to non-CDC sites on the Internet are
provided as a service to MMWR readers and do not constitute or imply
endorsement of these organizations or their programs by CDC or the U.S.
Department of Health and Human Services. CDC is not responsible for the content
of pages found at these sites. URL addresses listed in MMWR were current as of
the date of publication.
All MMWR HTML versions of articles are electronic conversions from typeset documents.
This conversion might result in character translation or format errors in the HTML version.
Users are referred to the electronic PDF version (http://www.cdc.gov/mmwr)
and/or the original MMWR paper copy for printable versions of official text, figures, and tables.
An original paper copy of this issue can be obtained from the Superintendent of Documents, U.S.
Government Printing Office (GPO), Washington, DC 20402-9371;
telephone: (202) 512-1800. Contact GPO for current prices.
**Questions or messages regarding errors in formatting should be addressed to
mmwrq@cdc.gov.
