Persons using assistive technology might not be able to fully access information in this file. For assistance, please send e-mail to: mmwrq@cdc.gov. Type 508 Accommodation and the title of the report in the subject line of e-mail.
QuickStats: Prevalence of Selected Unhealthy Behavior-Related Characteristics Among Adults Aged ≥18 Years, by Poverty Status* --- National Health Interview Survey, United States, 2005--2007†
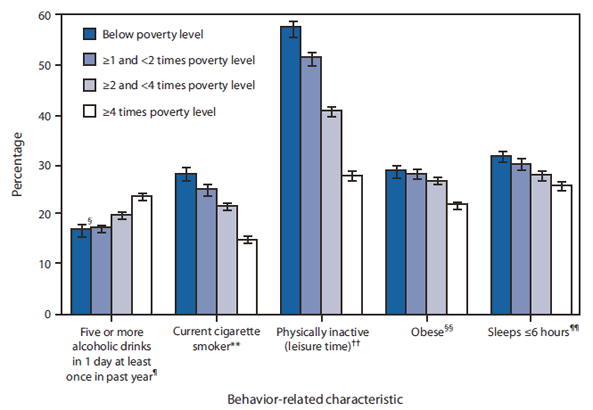
U.S. adults with the lowest family incomes were more likely than adults with the highest family incomes to be current cigarette smokers (28.3% versus 15.1%), to be physically inactive (57.5% versus 27.8%), to be obese (28.8% versus 22.1%), and to sleep ≤6 hours in a 24-hour period (31.7% versus 25.9%). Smoking and physical inactivity showed the steepest declines with increasing income. In contrast, the percentage of adults who had five or more alcoholic drinks in 1 day in the past year was lowest among adults with family incomes below (17.2%) or near the poverty level (17.3%) and highest among adults in the highest family income group (23.6%).
Source: Schoenborn CA, Adams PF. Health behaviors of adults: United States 2005--2007. Vital Health Stat 2010;10(245).
Alternate Text: The figure above shows the prevalence of selected unhealthy behavior-related characteristics among adults aged ≥18 years, by poverty status, in the United States, during 2005-2007. U.S. adults in with the lowest family incomes were more likely than adults with the highest family incomes to be current cigarette smokers (28.3% versus 15.1%), to be physically inactive (57.5% versus 27.8%), to be obese (28.8% versus 22.1%), and to sleep 6 hours or less in a 24-hour period (31.7% versus 25.9%). Smoking and physical inactivity showed the steepest declines with increasing family income. In contrast, the percentage of adults who had five or more alcoholic drinks in 1 day in the past year was lowest among adults with family incomes below (17.2%) or near the poverty level (17.3%) and highest among adults in the highest family income group (23.6%).
Use of trade names and commercial sources is for identification only and does not imply endorsement by the U.S. Department of
Health and Human Services.
References to non-CDC sites on the Internet are
provided as a service to MMWR readers and do not constitute or imply
endorsement of these organizations or their programs by CDC or the U.S.
Department of Health and Human Services. CDC is not responsible for the content
of pages found at these sites. URL addresses listed in MMWR were current as of
the date of publication.
All MMWR HTML versions of articles are electronic conversions from typeset documents.
This conversion might result in character translation or format errors in the HTML version.
Users are referred to the electronic PDF version (http://www.cdc.gov/mmwr)
and/or the original MMWR paper copy for printable versions of official text, figures, and tables.
An original paper copy of this issue can be obtained from the Superintendent of Documents, U.S.
Government Printing Office (GPO), Washington, DC 20402-9371;
telephone: (202) 512-1800. Contact GPO for current prices.
**Questions or messages regarding errors in formatting should be addressed to
mmwrq@cdc.gov.
