|
What is already known on this topic? The 2009 pandemic influenza A (H1N1) virus emerged in the United States in April 2009 and caused substantial disease worldwide. What is added by this report? In recent weeks, declines have been observed in 2009 H1N1 influenza activity; however, rates of influenza-related hospitalizations and deaths among persons aged <65 years during this season have been substantially higher than in recent influenza seasons. What are the implications for public health practice? Epidemiologic data in this report support expanded recommendations by CDC that the influenza A (H1N1) 2009 monovalent vaccine be offered to all persons aged ≥6 months, depending on local availability. |
Persons using assistive technology might not be able to fully access information in this file. For assistance, please send e-mail to: mmwrq@cdc.gov. Type 508 Accommodation and the title of the report in the subject line of e-mail.
Update: Influenza Activity --- United States, August 30, 2009--January 9, 2010
The emergence and spread of the 2009 pandemic influenza A (H1N1) virus (2009 H1N1) resulted in extraordinary influenza activity in the United States throughout the summer and fall months of 2009 (1,2). During this period, influenza activity reached its highest level in the week ending October 24, 2009, with 49 of 50 states reporting geographically widespread disease. As of January 9, 2010, overall influenza activity had declined substantially. Since April 2009, the dominant circulating influenza virus in the United States has been 2009 H1N1. This report summarizes U.S. influenza activity* from August 30, 2009, through January 9, 2010.
Viral Surveillance
During August 30, 2009--January 9, 2010, World Health Organization (WHO) and National Respiratory and Enteric Virus Surveillance System (NREVSS) collaborating laboratories in the United States tested 310,151 respiratory specimens for influenza viruses; 81,179 (26.2%) were positive, 80,951 (99.7%) of those specimens were positive for influenza A, and 228 (0.3%) were positive for influenza B. Of the 61,726 influenza A viruses for which subtyping was performed, 61,332 (99.4%) were 2009 H1N1 viruses. Only 29 viruses (<0.1%) were seasonal influenza A (H1), 52 (<0.1%) were influenza A (H3) viruses, and 313 (0.5%) were influenza A, but could not be subtyped because of specimen quantity or quality.
CDC has antigenically characterized 944 viruses that were 2009 H1N1, one seasonal influenza A (H1N1), seven influenza A (H3N2), and six influenza B viruses collected since September 1, 2009. A total of 942 (99.8%) 2009 H1N1 viruses tested were related to the A/California/7/2009 (H1N1) reference virus selected by WHO as the 2009 H1N1 vaccine virus; only two viruses (0.2%) showed reduced titers with antisera produced against A/California/7/2009.
One seasonal influenza A (H1N1) virus was related to the influenza A (H1N1) component of the 2009--10 Northern Hemisphere influenza vaccine (A/Brisbane/59/2007). The seven influenza A (H3N2) viruses collected during September 22--November 1, 2009, showed reduced titers with antisera produced against A/Brisbane/10/2007, the 2009--10 Northern Hemisphere influenza A (H3N2) vaccine component, and were antigenically related to A/Perth/16/2009, the WHO-recommended influenza A (H3N2) component of the 2010 Southern Hemisphere vaccine formulation. The six influenza B viruses tested belong to the B/Victoria lineage and are related to the influenza vaccine component for the 2009--10 Northern Hemisphere influenza vaccine (B/Brisbane/60/2008).
Antiviral Resistance of Influenza Virus Isolates
CDC conducts surveillance for resistance of circulating influenza viruses to both classes of influenza antiviral medications: adamantanes (amantadine and rimantadine) and neuraminidase inhibitors (zanamivir and oseltamivir). Since September 1, 2009, 39 (1.3%) of 2,926 total 2009 H1N1 viruses tested by neuraminidase inhibition assay and/or by detection of a single known mutation in the virus which confers oseltamivir resistance, H275Y, have shown oseltamivir resistance. This proportion of oseltamivir-resistant 2009 H1N1 viruses might overestimate the prevalence of oseltamivir-resistant 2009 H1N1 viruses in the United States because most of these viruses were tested because of clinical suspicion for oseltamivir resistance. Three additional cases of oseltamivir resistance among 2009 H1N1 viruses have been identified by other laboratories where antiviral resistance testing also is performed; thus, a total of 42 oseltamivir-resistant 2009 H1N1 viruses have been reported to CDC since September 1, 2009.
Since April 2009, a total of 52 oseltamivir-resistant 2009 H1N1 viruses have been detected in patients in the United States. Forty (77%) of the 52 patients had documented exposure to oseltamivir through either treatment or chemoprophylaxis; exposure to oseltamivir in nine (17%) patients has not yet been determined, and three patients (6%) had no known exposure. One seasonal influenza A (H1N1) was tested and was resistant to oseltamivir. One influenza B virus was tested and was not resistant to oseltamivir. None of eight influenza A (H3N2) viruses tested were resistant to oseltamivir. All tested viruses were sensitive to the neuraminidase inhibitor zanamivir. One seasonal influenza A (H1N1) virus was found to be sensitive, and nine (81.8%) of 11 influenza A (H3N2) and 834 (99.6%) of 837 2009 H1N1 virus isolates tested were found to have resistance to the adamantanes (amantadine and rimantadine).
State-Specific Activity Levels
The largest number of states to date reporting widespread activity occurred during the week ending October 24, 2009, when 49 jurisdictions reported widespread activity.† During the week ending January 9, 2010, no jurisdiction reported widespread activity. The early widespread state-specific activity contrasts with the previous three influenza seasons (October to May), when state-specific influenza activity did not reach comparable levels until mid-February or early March.
Outpatient Illness Surveillance
In the week ending October 24, 2009, the weekly percentage of outpatient visits for influenza-like illness (ILI)§ reported by the U.S. Outpatient ILI Surveillance Network (ILINet) reached 7.7%, the highest level to date this influenza season. As of January 9, 2010, ILI activity had decreased to 1.9% (Figure 1). During the previous three influenza seasons, peak ILI activity occurred later in the season and ranged from 3.5% during the week ending February 17 of the 2006--07 season to 6.0% during the week ending February 17 of the 2007--08 season. As of the week ending January 9, one of 10 regions was reporting weekly percentages of outpatient visits for ILI at or above its region-specific baseline. ILI activity was at or above the national baseline of 2.3% during the entire period of November--December 2009.¶
Influenza-Associated Hospitalizations
Laboratory-confirmed influenza-associated hospitalizations are monitored using a population-based surveillance network that includes sites in 10 states in the Emerging Infections Program (EIP) and sites in six additional states added during 2009.** This season, cumulative hospitalization rates have been highest in children aged 0--4 years, and generally rates have declined with age. As of January 9, 2010, cumulative rates of laboratory-confirmed influenza-associated hospitalizations reported for children aged 0--4 years were 5.9 per 10,000 population by EIP and 9.7 per 10,000 population by the new sites (Figure 2). Rates for other age groups were as follows: 5--17 years, 2.5 by EIP and 3.6 by the new sites; 18--49 years, 2.2 by EIP and 1.7 by the new sites; 50--64 years, 2.9 by EIP and 1.8 by the new sites; and ≥65 years, 2.4 by EIP and 1.7 by the new sites. In comparison, EIP cumulative hospitalization rates for the entire October-May influenza reporting seasons of 2006--07, 2007--08, and 2008--09, ranged as follows: ages 0--4 years (2.6 to 4.2), 5--17 years (0.4 to 0.6), 18--49 years (0.3 to 0.7), 50--64 years (0.4 to 1.5), and ≥65 years (1.4 to 7.5) (Figure 2).
In response to the emergence of 2009 H1N1 viruses, the Council of State and Territorial Epidemiologists (CSTE) instituted reporting of 2009 H1N1-confirmed hospitalizations and deaths to CDC. On August 30, CDC and CSTE instituted modified case definitions for aggregate reporting of influenza-associated hospitalizations and deaths. This cumulative jurisdiction-level reporting is referred to as the Aggregate Hospitalization and Death Reporting Activity (AHDRA).†† During August 30, 2009--January 9, 2010, a total of 38,454 hospitalizations associated with laboratory-confirmed influenza virus infections were reported to CDC through AHDRA. The median number of states reporting hospitalizations per week through AHDRA was 33 (range: 25--35).
Pneumonia and Influenza-Related Mortality
Pneumonia and influenza-associated deaths are monitored by the 122 Cities Mortality Reporting System and AHDRA. For the week ending January 9, pneumonia or influenza was reported as an underlying or contributing cause of death for 7.3% of all deaths reported through the 122 Cities Mortality Reporting System, below the week-specific epidemic threshold of 7.6%§§ (Figure 3). The longest period that pneumonia and influenza-related mortality was above the epidemic threshold was for 11 consecutive weeks from the week ending October 3, 2009, to the week ending December 12, 2009. The highest level of pneumonia and influenza-related mortality was 8.1% for the week ending November 21, 2009. In contrast, peak pneumonia and influenza-associated mortality did not occur until later in the three previous seasons, peaking at 7.7% during the week ending February 24, 2007, during the 2006--07 influenza season and at 9.1% in the week ending February 16, 2008, during the 2007--08 season.
During August 30--January 9, a total of 1,779 deaths associated with laboratory-confirmed influenza virus infections were reported to CDC through AHDRA. The 1,779 laboratory-confirmed deaths are in addition to the 593 laboratory-confirmed deaths from 2009 H1N1 that were reported to CDC from April through August 30, 2009. Since August 30, cumulative deaths associated with laboratory-confirmed 2009 H1N1 infection per 100,000 population were 0.31 for persons aged 0--4 years, 0.26 for 5--18 years, 0.38 for 19--24 years, 0.60 for 25--49 years, 1.03 for 50--64 years, and 0.65 for ≥65 years. For the period August 30--January 9, the median number of states reporting laboratory-confirmed deaths per week through AHDRA was 34 (range: 23--38).
Influenza-Associated Pediatric Mortality
CDC has received 236 reports of pediatric deaths associated with laboratory-confirmed influenza infection that occurred and were reported since August 30, 2009, the start of the 2009--10 influenza season (Figure 4). A total of 195 (83%) cases were associated with laboratory-confirmed 2009 H1N1 virus. Forty pediatric deaths were associated with an influenza A infection for which the subtype was undetermined but likely was 2009 H1N1 based on the predominance of this virus among those circulating. One death was associated with an influenza B virus infection (Figure 4).
Of the 236 pediatric deaths reported occurring since August 30, a total of 43 (18.2%) were among children aged <2 years, 26 (11.0%) were among children aged 2--4 years, 87 (36.9%) were among children aged 5--11 years, and 80 (33.9%) were among children aged 12--17 years. Since the week ending May 2, CDC has received 255 reports of pediatric deaths associated with laboratory-confirmed 2009 H1N1 virus. During the 2005--06, 2006--07, and 2007--08 influenza seasons, the mean number of reported pediatric influenza deaths was 74.
Reported by
WHO Collaborating Center for Surveillance, Epidemiology, and Control of Influenza. L Brammer, MPH, S Epperson, MPH, L Blanton, MPH, T Wallis, MS, A Fiore, MD, L Gubareva, PhD, J Bresee, MD, L Kamimoto, MD, X Xu, MD, A Klimov, PhD, N Cox, PhD, Influenza Div; L Finelli, DrPH, National Center for Immunization and Respiratory Diseases; S Graitcer, MD, EIS Officer, CDC.
Editorial Note
As of January 9, 2010, the vast majority of influenza activity this season had been from 2009 H1N1. Activity was highest during the week ending October 24, 2009, and has since declined. The number of influenza-associated pediatric deaths reported to date for the 2009--10 season (236) is more than three times the average number (74) reported for the 2005--06, 2006--07, and 2007--08 influenza seasons. Resistance to antiviral neuraminidase inhibitors has been low among the 2009 H1N1 viruses, and the vast majority of 2009 H1N1 viruses tested remain related to the A/California/7/2009 (H1N1) reference virus selected by WHO as the 2009 H1N1 vaccine virus.
January and February are months during which seasonal influenza activity usually increases; thus, increased influenza activity from 2009 H1N1 viruses, seasonal influenza viruses, or both might occur in the remainder of the influenza season. In all three 20th century influenza pandemics (in 1918, 1957, and 1968), multiple waves of influenza activity were observed (3). The 2009 H1N1 virus is likely to continue to circulate through the winter months, resulting in more cases, hospitalizations, and deaths. Although limited supplies of influenza A (H1N1) 2009 monovalent vaccine had previously necessitated prioritizing vaccination among certain groups, approximately 130 million doses have been shipped since the vaccine was released, and most jurisdictions are encouraging vaccination of all persons aged ≥6 months (4). The 2009 H1N1-related morbidity and mortality described in this report point to the importance of a continued focus on vaccination, both among persons in the initial target groups as well as the rest of the population.
As the season progresses, public health officials should maintain the ability to detect changes in influenza activity. Testing, including subtyping of influenza A viruses to detect both pandemic and seasonal influenza strains, should continue for all hospitalized and severely ill patients, including patients aged ≥65 years. Timely reporting of all pediatric deaths associated with laboratory-confirmed influenza remains essential to detecting changes in severity of disease among children (includeing reporting no cases). Continued reporting of ILI through ILINet also will be important to tracking changes in influenza activity. Using previously established reporting channels, health-care providers should continue reporting to local or state health departments any particularly severe or unusual influenza cases or any cases among health-care workers and persons at risk for severe complications from influenza (e.g., pregnant women and immunocompromised persons). Institutional closings or clusters of influenza infections in prisons, schools, colleges, and long-term care facilities also should be reported through state and local health departments. In addition, any adverse reactions to influenza vaccines should continue to be reported via the Vaccine Adverse Event Reporting System (http://vaers.hhs.gov/index), and any adverse events after use of antivirals should be reported to MedWatch (http://www.fda.gov/safety/medwatch). Changes in the geographic spread, type, and severity of the circulating influenza viruses will continue to be monitored with updates reported weekly in the online national influenza surveillance summary, FluView.¶¶ Additional information regarding prevention and treatment of the 2009 pandemic influenza A (H1N1) is also available online.***
Acknowledgments
This report is based, in part, on data contributed by participating state and territorial health departments and state public health laboratories, World Health Organization collaborating laboratories, National Respiratory and Enteric Virus Surveillance System collaborating laboratories, the U.S. Outpatient ILI Surveillance Network, the Emerging Infections Program, the Aggregate Hospitalization and Death Reporting Activity, the Influenza Associated Pediatric Mortality Surveillance System, and the 122 Cities Mortality Reporting System.
References
- CDC. Swine influenza A (H1N1) infection in two children---southern California, March--April 2009. MMWR 2009;58:400--2.
- CDC. Update: influenza activity---United States, August 30--October 31, 2009. MMWR 2009;58:1236--41.
- Miller MA, Viboud C, Balinska M, Simonsen L. The signature features of influenza pandemics---implications for policy. N Eng J Med 2009;360:2595--8.
- CDC. Use of influenza A (H1N1) 2009 monovalent vaccine---recommendations of the Advisory Committee on Immunization Practices (ACIP), 2009. MMWR 2009;58(No. RR-10).
* The CDC influenza surveillance system collects five categories of information from eight data sources: 1) viral surveillance (World Health Organization collaborating U.S. laboratories, the National Respiratory and Enteric Virus Surveillance System, and novel influenza A virus case reporting), 2) outpatient illness surveillance (U.S. Outpatient ILI Surveillance Network), 3) mortality (122 Cities Mortality Reporting System and influenza-associated pediatric mortality reports), 4) hospitalizations (Emerging Infections Program) and 5) summary of geographic spread of influenza (state and territorial epidemiologist reports).
† Levels of activity are 1) no activity; 2) sporadic: isolated laboratory-confirmed influenza cases or a laboratory-confirmed outbreak in one institution, with no increase in influenza-like illness (ILI) activity; 3) local: increased ILI, or at least two institutional outbreaks (ILI or laboratory-confirmed influenza) in one region with recent laboratory evidence of influenza in that region; virus activity no greater than sporadic in other regions; 4) regional: increased ILI activity or institutional outbreaks (ILI or laboratory-confirmed influenza) in at least two but less than half of the regions in the state with recent laboratory evidence of influenza in those regions; and 5) widespread: increased ILI activity or institutional outbreaks (ILI or laboratory-confirmed influenza) in at least half the regions in the state with recent laboratory evidence of influenza in the state.
§ Defined as a temperature of ≥100.0°F (≥37.8°C), oral or equivalent, and cough and/or sore throat, in the absence of a known cause other than influenza.
¶ The national and regional baselines are the mean percentage of visits for ILI during noninfluenza weeks for the previous three seasons plus two standard deviations. A noninfluenza week is a week during which <10% of specimens tested positive for influenza. National and regional percentages of patient visits for ILI are weighted on the basis of state population. Use of the national baseline for regional data is not appropriate.
** EIP currently conducts surveillance for laboratory-confirmed, influenza-related hospitalizations in 61 counties and Baltimore, Maryland. The EIP catchment area includes 13 metropolitan areas located in 10 states. Beginning in September 2009, new EIP sites covering 40 counties in six states began reporting influenza-related hospitalization surveillance. Hospital laboratory, admission, and discharge databases, and infection-control logs are reviewed to identify persons with a positive influenza test (i.e., viral culture, direct fluorescent antibody assays, reverse transcription--polymerase chain reaction, serology, or a commercial rapid antigen test) from testing conducted as part of their routine care.
†† States report weekly to the CDC either 1) laboratory-confirmed influenza hospitalizations and deaths or 2) pneumonia and influenza syndrome-based cases of hospitalization and death resulting from all types or subtypes of influenza. Although only the laboratory- confirmed cases are included in this Report, CDC continues to analyze data both from laboratory-confirmed and syndromic hospitalizations and deaths. Additional information is available at http://www.cdc.gov/h1n1flu/reportingqa.htm#reportingofflu.
§§ The seasonal baseline proportion of pneumonia and influenza deaths is projected using a robust regression procedure in which a periodic regression model is applied to the observed percentage of deaths from pneumonia and influenza that were reported by the 122 Cities Mortality Reporting System during the preceding 5 years. The epidemic threshold is 1.645 standard deviations above the seasonal baseline.
¶¶ Available at http://www.cdc.gov/flu/weekly.
*** Available at http://www.cdc.gov/h1n1flu.
FIGURE 1. Percentage of visits for influenza-like illness (ILI) reported by the U.S. Outpatient Influenza-Like Illness Surveillance Network (ILINet), by surveillance week --- United States, 2006--07, 2007--08, 2008--09, and 2009--10* influenza seasons
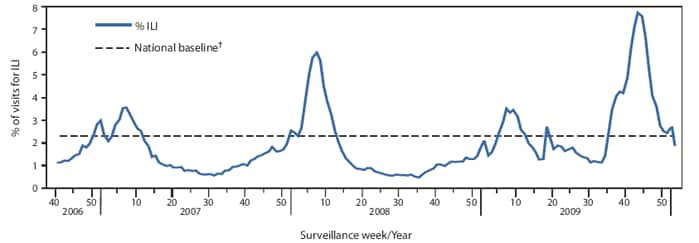
* Through January 9, 2010.
† The national baseline is the mean percentage of visits for ILI during noninfluenza weeks for the previous three seasons plus two standard deviations. A noninfluenza week is a week during which <10% of specimens tested positive for influenza. Use of the national baseline for regional data is not appropriate.
Alternative Text: The figure above shows the percentage of visits for influenza-like illness (ILI) reported by the U.S. Outpatient Influenza-like Illness Surveillance Network (ILINet), by surveillance week in the United States for the 2006-07, 2007-08, 2008-09, and 2009-10 influenza seasons. In the week ending October 24, 2009, the weekly percentage of outpatient visits for ILI reported by the U.S. Outpatient ILINet reached 7.7%, the highest level to date this influenza season and a level higher than the three preceding seasons. After peaking, the ILI level decreased to 1.9% in the week ending January 9, 2010.
FIGURE 2. Number of laboratory-confirmed influenza-associated hospitalizations and cumulative hospitalization rates per 10,000 population, by age group and surveillance week --- Emerging Infections Program (EIP) and new sites,* 2006--07, 2007--08, 2008--09,† and 2009--10§ U.S. influenza seasons
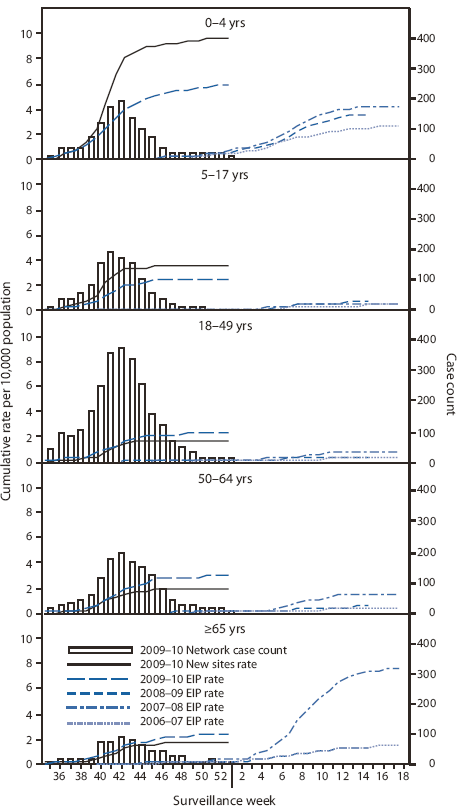
* In 2009, new sites in six additional states were added to the sites in the 10 states already participating in EIP. During September 1, 2009--January 9, 2010, total influenza-associated hospitalization rates were reported for EIP and the new sites for all types of influenza, including influenza A, influenza B, and 2009 pandemic influenza A (H1N1).
† Ending April 14, 2009, with reports of cases of 2009 H1N1.
§ Through January 9, 2010.
Alternative Text: The figure above shows the number of 2009-10 laboratory-confirmed influenza-associated hospitalizations and cumulative hospitalization rates per 10,000 population, by age group and surveillance week from Emerging Infections Program (EIP), and new sites for the 2006-07, 2007-08, 2008-09,† and 2009-10§ influenza seasons. As of January 9, 2010, cumulative rates of laboratory-confirmed influenza-associated hospitalizations reported for children aged 0-4 years were 5.9 per 10,000 population by EIP and 9.7 per 10,000 population by the new sites.
FIGURE 3. Percentage of all deaths attributed to pneumonia and influenza (P&I), by surveillance week and year --- 122 Cities Mortality Reporting Sytem, United States, 2006--2010
* The epidemic threshold is 1.645 standard deviations above the seasonal baseline.
† The seasonal baseline is projected using a robust regression procedure that applies a periodic regression model to the observed percentage of deaths from P&I during the preceding 5 years.
Alternative Text: The figure above shows the percentage of all deaths attributed to pneumonia and influenza (P&I), by surveillance week and year for 122 U.S. cities from 2006-2010 from the Mortality Reporting System. For the week ending January 9, pneumonia or influenza was reported as an underlying or contributing cause of death for 7.3% of all deaths reported through the 122 Cities Mortality Reporting System, below the week-specific epidemic threshold of 7.6%.
FIGURE 4. Number of influenza-associated pediatric deaths, by week of death --- United States, 2006--07, 2007--08, 2008--09, and 2009--10* influenza seasons
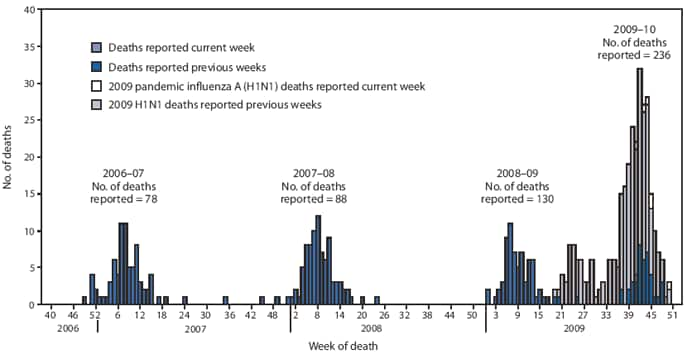
* Through January 9, 2010.
Alternative Text: The figure above shows the number of influenza-associated pediatric deaths, by week of death in the United States for the 2006-07, 2007-08, 2008-09, and 2009-10 influenza seasons. CDC has received 236 reports of pediatric deaths associated with laboratory-confirmed influenza infection that occurred and were reporting since August 30, 2009.
Use of trade names and commercial sources is for identification only and does not imply endorsement by the U.S. Department of
Health and Human Services.
References to non-CDC sites on the Internet are
provided as a service to MMWR readers and do not constitute or imply
endorsement of these organizations or their programs by CDC or the U.S.
Department of Health and Human Services. CDC is not responsible for the content
of pages found at these sites. URL addresses listed in MMWR were current as of
the date of publication.
All MMWR HTML versions of articles are electronic conversions from typeset documents.
This conversion might result in character translation or format errors in the HTML version.
Users are referred to the electronic PDF version (http://www.cdc.gov/mmwr)
and/or the original MMWR paper copy for printable versions of official text, figures, and tables.
An original paper copy of this issue can be obtained from the Superintendent of Documents, U.S.
Government Printing Office (GPO), Washington, DC 20402-9371;
telephone: (202) 512-1800. Contact GPO for current prices.
**Questions or messages regarding errors in formatting should be addressed to
mmwrq@cdc.gov.
