Persons using assistive technology might not be able to fully access information in this file. For assistance, please send e-mail to: mmwrq@cdc.gov. Type 508 Accommodation and the title of the report in the subject line of e-mail.
Drowsy Driving — 19 States and the District of Columbia, 2009–2010
According to the National Highway Traffic Safety Administration (NHTSA), 2.5% of fatal motor vehicle crashes (approximately 730 in 2009) and 2.0% of all crashes with nonfatal injuries (approximately 30,000 in 2009) involve drowsy driving (1). However, although data collection methods make it challenging to estimate the number of crashes that involve drowsy drivers, some modeling studies have estimated that 15% to 33% of fatal crashes might involve drowsy drivers (2,3). Fatalities and injuries are more likely in motor vehicle crashes that involve drowsy driving compared with non-drowsy driving crashes (1,4). To assess the state-level self-reported prevalence of falling asleep while driving, CDC analyzed data from a set of questions about insufficient sleep administered through the Behavioral Risk Factor Surveillance System (BRFSS) during 2009–2010. Among 147,076 respondents in 19 states and the District of Columbia (DC),* 4.2% reported having fallen asleep while driving at least one time during the previous 30 days. Reports of falling asleep while driving were more common among adults who reported usually sleeping ≤6 hours per day, snoring, or unintentionally falling asleep during the day compared with other adults who did not report these characteristics. Drivers should avoid driving while drowsy and learn the warning signs of drowsy driving.
BRFSS is a state-based, random-digit–dialed telephone survey of noninstitutionalized adults aged ≥18 years that is administered by state health departments each year in collaboration with CDC. Based on Council of American Survey and Research Organizations (CASRO) guidelines, response rates† for the states that used the optional sleep questions during 2009–2010 had a median of 52.1% and ranged from 39.1% (Oregon in 2010) to 68.8% (Nebraska in 2010).
Respondents were asked, "During the past 30 days, have you ever nodded off or fallen asleep, even just for a brief moment, while driving?" Drowsy driving was defined as those with an affirmative response, whereas no drowsy driving included those who responded "no," "don't drive," "don't have a license," or "don't know/not sure." Respondents also were asked, "On average, how many hours of sleep do you get in a 24-hour period?" "Do you snore?" "During the past 30 days, for about how many days have you felt you did not get enough rest or sleep?" and "During the past 30 days, for about how many days did you find yourself unintentionally falling asleep during the day?" Age-adjusted prevalence of falling asleep while driving and 95% confidence intervals (CIs) were calculated by state, and by selected sociodemographic and other sleep-related characteristics. For comparisons of prevalence between subgroups, statistical significance (p<0.05) was determined by using t-tests. All indicated differences between subgroups are statistically significant.
Among 147,076 respondents, 4.2% (unadjusted prevalence = 4.1%) reported having fallen asleep while driving during the previous 30 days (Table 1). Men were more likely to report drowsy driving than women (5.3% versus 3.2%). Drowsy driving prevalence decreased with age, from >4.9% among adults aged 18–44 years to 1.7% among those aged ≥65 years. Non-Hispanic whites were less likely to report drowsy driving than other racial/ethnic groups (3.2% versus 6.1% for non-Hispanic blacks, 5.9% for Hispanics, and 6.0% for persons of other race/ethnicity). Retired respondents (1.0%), students or homemakers (2.1%), and unemployed respondents (3.1%) were less likely to report drowsy driving than those who were employed (5.1%) or unable to work (6.1%). Educational attainment was not associated with drowsy driving. Among the states that used the sleep module, drowsy driving prevalence ranged from 2.5% in Oregon to 6.1% in Texas.
Drowsy driving was associated with other sleep-related characteristics. Adults who reported frequent insufficient sleep, a daily sleep duration of ≤6 hours, snoring, or unintentionally falling asleep during the day reported drowsy driving more frequently than those who did not report those characteristics (Table 2). Short sleep duration (≤6 hours) and snoring, suggestive of obstructive sleep apnea, each were related independently to drowsy driving (Figure).
Reported by
Anne G. Wheaton, PhD, Daniel P. Chapman, PhD, Letitia R. Presley-Cantrell, PhD, Janet B. Croft, PhD, Div of Population Health, National Center for Chronic Disease Prevention and Health Promotion; Douglas R. Roehler, MPH, Div of Unintentional Injury Prevention, National Center for Injury Prevention and Control, CDC. Corresponding contributor: Anne G. Wheaton, awheaton@cdc.gov, 770-488-5362.
Editorial Note
In 2006, the Institute of Medicine released a report emphasizing the public health importance of sleep and including a discussion of drowsy driving.§ As a result of increased attention to the consequences of insufficient sleep, Healthy People 2020 added a set of sleep health objectives, including one to reduce the rate of motor vehicle crashes caused by drowsy driving.¶
Previous surveys have addressed the topic of drowsy driving, but this report presents the findings from the largest number of U.S. survey respondents to date. The finding that 4% of respondents reported falling asleep while driving during the previous month agrees with previous smaller studies. In a survey of 4,010 drivers sponsored by NHTSA, 4.2% reported falling asleep while driving during the past month, and 11% reported this experience in the past year (5). The corresponding results from a survey of 2,000 U.S. residents sponsored by the AAA Foundation for Traffic Safety in 2010 were identical (4% and 11%) (3).
Although it is clear that falling asleep while driving is dangerous, drowsiness impairs driving skills even if drivers manage to stay awake. Drowsiness slows reaction time, makes drivers less attentive, and impairs decision-making skills (6), all of which can contribute to motor vehicle crashes. Sleep-related crashes are more likely to happen at night or during the midafternoon, when drivers are more likely to be sleepy (4,7). These crashes often involve a single vehicle going off the road, with no evidence of braking or other attempt to prevent the crash (4). But sleep-related crashes also make up a disproportionate portion of rear-end and head-on collisions (7). Importantly, drowsy driving crashes are more likely to result in injuries and fatalities than non-drowsy driving crashes (4).
The findings in this report are subject to at least four limitations. First, only data from households with landline telephones were analyzed. Second, estimates of falling asleep while driving are based on self-report, likely resulting in underestimates. Previous studies have shown that persons often are not aware that they have fallen asleep (8). Third, data were not collected for all states and might not be generalizable to the rest of the United States. In addition, response rates for the states that used the optional sleep module during 2009–2010 were relatively low, ranging from 39.1% to 68.8% (median: 52.1%). Finally, BRFSS does not survey persons aged <18 years, thereby excluding young drivers, who might be at increased risk for drowsy driving (4).
The best way to prevent drowsy driving is to recognize and address the conditions that lead to sleepiness. Those at increased risk for drowsy driving include commercial drivers, persons who work at night or long shifts, drivers with untreated sleep disorders, drivers who use sedating medications, and anyone who does not get adequate sleep (9). Drivers should ensure that they get enough sleep (7–9 hours), seek treatment for sleep disorders, and refrain from alcohol use before driving. In their guide for employers of shift workers (i.e., anyone who works beyond the typical workday, including night shift, rotating shift, or long shift workers), NHTSA suggests that employers consider providing alternate transportation home for employees or allowing naps at work.** However, once on the road, it is also important to recognize the symptoms of drowsiness and act appropriately, by pulling over to rest until fully rested or by changing drivers. Techniques to stay awake while driving, such as turning up the radio, opening the window, and turning up the air conditioner, have not been found to be effective (10). Warning signs of drowsy driving include frequent yawning or blinking, difficulty remembering the past few miles driven, missing exits, drifting from one's lane, or hitting a rumble strip.†† The only safe thing for drivers to do if they start to feel tired while driving is to get off the road and rest until no longer drowsy. In addition, continued research into and development of improved drowsy driving countermeasures is warranted, as outlined in a report from the National Center on Sleep Disorders Research/NHTSA Expert Panel on Driver Fatigue and Sleepiness.§§ Better methods to estimate the number of crashes caused by drowsy driving will improve surveillance for this problem and increase the capacity to identify effective interventions.
References
- National Highway Traffic Safety Administration. Traffic safety facts crash stats: drowsy driving. Washington, DC: US Department of Transportation, National Highway Traffic Safety Administration; 2011. Available at http://www-nrd.nhtsa.dot.gov/pubs/811449.pdf. Accessed December 19, 2012.
- Masten SV, Stutts JC, Martell CA. Predicting daytime and nighttime drowsy driving crashes based on crash characteristic models. 50th Annual Proceedings of the Association for the Advancement of Automotive Medicine; Chicago, IL; October 2006.
- Tefft BC, AAA Foundation for Traffic Safety. Asleep at the wheel: the prevalence and impact of drowsy driving. Washington, DC: AAA Foundation for Traffic Safety; 2010. Available at http://www.aaafoundation.org/pdf/2010drowsydrivingreport.pdf. Accessed December 19, 2012.
- Pack AI, Pack AM, Rodgman E, Cucchiara A, Dinges DF, Schwab CW. Characteristics of crashes attributed to the driver having fallen asleep. Accid Anal Prev 1995;27:769–75.
- Royal D. National survey of distracted and drowsy driving attitudes and behavior, 2002. Volume I: findings report. Washington, DC: The Gallup Organization; 2003. Available at http://www.nhtsa.gov/people/injury/drowsy_driving1/survey-distractive03/technical_page1.htm. Accessed December 19, 2012.
- Jackson ML, Croft RJ, Kennedy GA, Owens K, Howard ME. Cognitive components of simulated driving performance: sleep loss effects and predictors. Accid Anal Prev 2013;50:438–44.
- Knipling RR, Wang J-S. National Highway Traffic Safety Administration. Crashes and fatalities related to driver drowsiness/fatigue. Washington, DC: US Department of Transportation, National Highway Traffic Safety Administration; 1994. Available at http://ntl.bts.gov/lib/jpodocs/repts_te/1004.pdf. Accessed January 2, 2013.
- Gastaut H, Broughton RJ. A clinical and polygraphic study of episodic phenomena during sleep. Rec Adv Biol Psychiatry 1965;7:197–222.
- Stutts JC, Wilkins JW, Scott Osberg J, Vaughn BV. Driver risk factors for sleep-related crashes. Accid Anal Prev 2003;35:321–31.
- NCSDR/NHTSA Expert Panel on Driver Fatigue and Sleepiness. Drowsy driving and automobile crashes. Washington, DC: National Highway Traffic Safety Administration; 1998. Available at http://www.nhtsa.gov/people/injury/drowsy_driving1/drowsy.html#ncsdr/nhtsa. Accessed December 21, 2012.
* Arkansas (2010), California (2009, 2010), Connecticut (2010), Delaware (2010), Georgia (2009), Hawaii (2009, 2010), Illinois (2009), Kansas (2009, 2010), Louisiana (2009), Maryland (2009, 2010), Michigan (2010), Minnesota (2009, 2010), Missouri (2010), Nebraska (2009, 2010), Nevada (2010), New York (2009), Oregon (2010), Texas (2009), and Wyoming (2009). DC used the module in 2010.
† The percentage of persons who completed interviews among all eligible persons, including those potential respondents for whom eligibility was not established.
§ Available at http://books.nap.edu/catalog.php?record_id=11617.
¶ Information available at http://www.healthypeople.gov/2020/topicsobjectives2020/objectiveslist.aspx?topicid=38.
** Available at http://www.nhtsa.gov/people/injury/drowsy_driving1/human/drows_driving/resource/resource.html.
†† Information available at http://drowsydriving.org/about/warning-signs.
§§ Available at http://www.nhtsa.gov/people/injury/drowsy_driving1/drowsy.html.
What is already known on this topic?
Drowsy driving is an important contributor to motor vehicle crashes and fatalities. Techniques to stay awake while driving, such as turning up the radio, opening the window, and turning up the air conditioner, have not been found to be effective. Warning signs of drowsy driving include frequent yawning or blinking, difficulty remembering the past few miles driven, missing exits, drifting from one's lane, or hitting a rumble strip.
What is added by this report?
Overall prevalence of self-reported falling asleep while driving during the previous 30 days was 4.2%. State-level prevalence ranged from 2.5% in Oregon to 6.1% in Texas. Persons who reported snoring or usually sleeping ≤6 hours per day were more likely to report falling asleep while driving.
What are the implications for public health practice?
Improved surveillance and more research will be needed to improve sleep health among U.S. adults and reduce the prevalence drowsy driving. Public health workers should educate themselves and their communities on the substantial impact that insufficient sleep and sleep disorders have on the ability to drive safely. Physicians can advise patients on lifestyle changes to improve sleep and refer patients with more serious sleep problems to a sleep specialist.
FIGURE. Age-adjusted* prevalence of falling asleep while driving during the preceding 30 days, by usual sleep duration and snoring — Behavioral Risk Factor Surveillance System, 19 states and the District of Columbia, 2009–2010
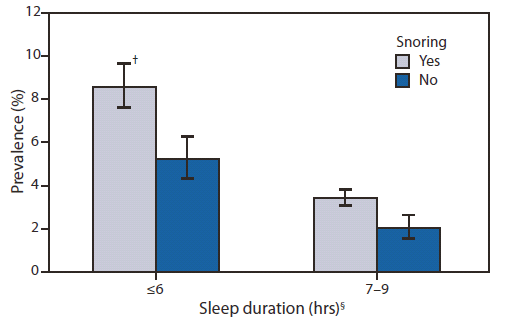
* Age adjusted to the 2000 projected U.S. population.
† 95% confidence interval.
§ Estimates for sleep duration ≥10 hours were not reliable because of small cell size; relative standard error >0.3.
Alternate Text: The figure above shows age-adjusted prevalence of falling asleep while driving during the preceding 30 days, by usual sleep duration and snoring, for 19 states and the District of Columbia during 2009-2010. Drowsy driving was associated with other sleep-related characteristics. Adults who reported frequent insufficient sleep, a daily sleep duration of ≤6 hours, snoring, or unintentionally falling asleep during the day reported drowsy driving more frequently than those who did not report those characteristics. Short sleep duration (≤6 hours) and snoring, sug¬gestive of obstructive sleep apnea, each were related independently to drowsy driving.
Use of trade names and commercial sources is for identification only and does not imply endorsement by the U.S. Department of
Health and Human Services.
References to non-CDC sites on the Internet are
provided as a service to MMWR readers and do not constitute or imply
endorsement of these organizations or their programs by CDC or the U.S.
Department of Health and Human Services. CDC is not responsible for the content
of pages found at these sites. URL addresses listed in MMWR were current as of
the date of publication.
All MMWR HTML versions of articles are electronic conversions from typeset documents.
This conversion might result in character translation or format errors in the HTML version.
Users are referred to the electronic PDF version (http://www.cdc.gov/mmwr)
and/or the original MMWR paper copy for printable versions of official text, figures, and tables.
An original paper copy of this issue can be obtained from the Superintendent of Documents, U.S.
Government Printing Office (GPO), Washington, DC 20402-9371;
telephone: (202) 512-1800. Contact GPO for current prices.
**Questions or messages regarding errors in formatting should be addressed to
mmwrq@cdc.gov.
