FIGURE 1. Annual incidence* of cases of West Nile virus neuroinvasive disease† --- ArboNET, United States, 1999--2009§
Persons using assistive technology might not be able to fully access information in this file. For assistance, please send e-mail to: mmwrq@cdc.gov. Type 508 Accommodation and the title of the report in the subject line of e-mail.
West Nile Virus Activity --- United States, 2009
West Nile virus (WNV) was first detected in the Western Hemisphere in 1999 in New York City and has since caused seasonal epidemics of febrile illness and neurologic disease across the United States, where it is now the leading cause of arboviral encephalitis (1). This report updates a previous report (2) and summarizes WNV activity in the United States reported to CDC in 2009. A total of 38 states and the District of Columbia (DC) reported 720 cases of WNV disease. Of these, 33 states and DC reported 386 cases of WNV neuroinvasive disease, for an incidence of 0.13 per 100,000 population. The five states with the highest incidence of WNV neuroinvasive disease were Mississippi (1.05 per 100,000), South Dakota (0.74), Wyoming (0.73), Colorado (0.72), and Nebraska (0.61). Neuroinvasive disease incidence increased with increasing age, with the highest incidence among persons aged ≥70 years. A total of 33 WNV deaths were reported, 32 from neuroinvasive disease. Calculating from the number of neuroinvasive disease cases and projections from 1999 serosurvey data, CDC estimated that 54,000 persons were infected with WNV in 2009, of whom 10,000 developed nonneuroinvasive WNV disease. The continuing disease burden caused by WNV affirms the need for ongoing surveillance, mosquito control, promotion of personal protection from mosquito bites, and research into additional prevention strategies.
WNV is a nationally notifiable disease. Data are reported to CDC through ArboNET, an Internet-based arbovirus surveillance system managed by state health departments and CDC (2). Using standard case definitions,* human WNV disease cases are classified as WNV neuroinvasive disease (e.g., meningitis, encephalitis, or acute flaccid paralysis) or WNV nonneuroinvasive disease (e.g., acute systemic febrile illness that often includes headache, myalgia, or arthralgia). Nonneuroinvasive disease reporting varies greatly by jurisdiction, depending on disease awareness, health-care--seeking behaviors, and testing practices. Therefore, this report focuses on WNV neuroinvasive disease cases, which are thought to be identified and reported more consistently because of the severity of the illness. In addition to human disease cases, ArboNET captures data on presumptively viremic blood donors (PVDs), veterinary cases, and WNV infections in sentinel animals (most commonly chickens), dead birds, and mosquitoes. Not all jurisdictions conduct nonhuman surveillance.
Human Surveillance
During 2009, a total of 720 cases of WNV disease were reported from 262 counties in 38 states and DC. Of these 720 cases, 386 (54%) were reported as WNV neuroinvasive disease and 334 (46%) as nonneuroinvasive disease. A total of 116 PVDs, identified through routine screening of the blood supply, also were reported. Of these PVDs, 92 (79%) were asymptomatic, 23 (20%) developed nonneuroinvasive disease, and one (1%) subsequently developed neuroinvasive disease. PVDs who developed symptomatic disease were included in disease case counts.
The 386 reported cases of neuroinvasive disease represented a rate of 0.13 per 100,000 population in the United States, based on July 1, 2009 U.S. Census population estimates (Figure 1). States reporting the most WNV neuroinvasive disease cases were Texas with 93 (24% of U.S. cases) and California with 67 (17%). Washington, which reported only two neuroinvasive disease cases in 2008, reported 26 (7%) cases in 2009. The five states with the highest incidence were Mississippi (31 cases, 1.05 cases per 100,000 residents), South Dakota (six cases, 0.74), Wyoming (four cases, 0.73), Colorado (36 cases, 0.72), and Nebraska (11 cases, 0.61) (Figure 2). WNV neuroinvasive disease peaked in the United States during mid-August, and 352 (91%) of the 386 cases were reported during July--September. This seasonality was consistent with trends observed over the preceding 10 years (2).
Of the 386 neuroinvasive disease cases, 226 (59%) occurred in males. The median age of patients was 60 years (range: 2--91 years), with increasing incidence among persons in older age groups (Figure 3). Overall, 368 (95%) patients with neuroinvasive disease were hospitalized, and 32 (8.3%) died (median age: 72 years; range: 19--89 years). A total of 229 (59%) neuroinvasive disease cases were classified as encephalitis, 117 (30%) as meningitis, and 40 (10%) as acute flaccid paralysis; 27 (68%) of the 40 cases classified as acute flaccid paralysis had coincident encephalitis or meningitis.
Serologic surveys indicate that for every case of WNV neuroinvasive disease there are approximately 140 infections and approximately 20% of infected persons develop nonneuroinvasive disease (3). Using the 386 reported neuroinvasive disease cases, CDC estimated that 54,000 infections and 10,000 cases of WNV nonneuroinvasive disease occurred in the United States in 2009. Only 334 nonneuroinvasive disease cases were reported to ArboNET in 2009, representing approximately 3% of the estimated number.
Animal Surveillance
Of 298 reported veterinary cases of WNV disease, 275 (92%) occurred in equines and 23 (8%) occurred in other species: squirrels, 13; canines, eight; camelids, one; and deer, one. The equine cases were reported from 168 counties in 36 states, with 72 (26%) reported from Washington. The number of reported WNV-infected equines peaked during the first week of September.
In 2009, a total of 759 dead WNV-infected birds were reported from 141 counties in 25 states and the District of Columbia; California reported 515 (68%) dead birds. Of the 141 counties reporting WNV-infected birds, 92 (65%) counties in 19 states reported infected dead birds but no human disease cases. The number of reported WNV-infected birds peaked during the first week of September. Corvids (e.g., crows, jays, and magpies), which are targeted for surveillance by most states, accounted for 534 (70%) of the birds. Since 1999, WNV infection has been reported in 328 avian species, including two species, MacGillivray's warbler and tricolored blackbird, in which WNV was identified for the first time during 2009.
Mosquito Surveillance
In 2009, a total of 6,646 mosquito pools† from 351 counties in 40 states and DC were reported as testing positive for WNV. Among the WNV-positive pools, 4,987 (75%) had species of Culex mosquitoes thought to be the principal vectors of WNV (e.g., Culex pipiens, Culex quinquefasciatus, Culex restuans, Culex salinarius, and Culex tarsalis). Unidentified or other species of Culex mosquitoes made up 1,488 (22%) pools, and non-Culex mosquito species (e.g., Aedes sp., Anopheles sp., Coquillettidia perturbans, Culiseta sp., Mansonia titillans, Psorophora columbiae, and Uranotaenia sapphirina) made up 171 (3%) pools. Data from 2009 also included the first report of WNV infection in Aedes epactius, which was collected in Texas. The number of reported WNV-infected mosquito pools peaked during mid-August.
Reported by
NP Lindsey, MS, JA Lehman, AL Greiner, JE Staples, MD, N Komar, ScD, E Zielinski-Gutierrez, DrPh, RS Nasci, PhD, M Fischer, MD, Arboviral Diseases Br, Div of Vector-Borne Diseases, National Center for Emerging and Zoonotic Infectious Diseases, CDC.
Editorial Note
Since introduced into the United States in 1999, WNV has become the leading cause of arboviral encephalitis in the country. However, in 2009, the reported incidence of WNV neuroinvasive disease in the United States was 0.13 per 100,000 population, the lowest recorded since 2001 (2). During 2004--2007, WNV had appeared to reach a stable incidence of approximately 0.4 per 100,000, but incidence dropped to 0.2 per 100,000 in 2008 (2) and continued to decline in 2009. This trend might be attributed to variation in populations of vectors and vertebrate hosts, accumulation of immunity in avian amplifying hosts, human behavior (e.g., use of repellents and protective clothing), community-level interventions, reporting practices, or environmental factors (e.g., temperature and rainfall) (4,5).
In 2009, evidence of WNV human disease again was detected in all geographic regions of the continental United States. The highest incidence of WNV neuroinvasive disease continued to occur mainly in the west-central United States, likely because of the high efficiency of Cx. tarsalis as a WNV vector. Mississippi (31 cases, 1.05 cases per 100,000) continued to be among those states with the highest incidence of WNV neuroinvasive disease. Arizona, which had the second highest incidence of WNV neuroinvasive disease in 2008 (62 cases, 1.0 per 100,000), reported an 81% decrease in cases with 12 cases and an incidence of only 0.18 per 100,000 in 2009 (1). After reporting its first two neuroinvasive disease cases in 2008, Washington reported the seventh highest state incidence in 2009 (26 cases, 0.39 per 100,000). These findings illustrate the wide annual variability and focality of WNV transmission.
The findings in this report are subject to at least two limitations. First, ArboNET is a passive surveillance system that depends on clinicians to consider the diagnosis of an arboviral disease, obtain the appropriate diagnostic test, and report any positive results. Diagnosis and reporting likely are incomplete, leading to underestimation of the true incidence of disease. Second, arboviral surveillance programs, testing capacity, and reporting can vary by county, state, or region, affecting incidence estimates.
In the absence of an effective human vaccine, prevention of WNV disease depends on community-level mosquito control and promotion of personal protective measures. Such measures include use of mosquito repellents, barrier protection (e.g., long-sleeved shirts, long pants, and socks), avoiding outdoor exposure, or using personal protection from dusk to dawn. Household measures, such as window screens and covering or draining peridomestic water-holding containers can further decrease the risk for WNV exposure.
Additional information on prevention of WNV infection is available from CDC at http://www.cdc.gov/ncidod/dvbid/westnile/index.htm. An overview of current year WNV transmission activity is available at http://diseasemaps.usgs.gov/wnv_us_human.html.
Acknowledgments
This report is based, in part, on data provided by ArboNET surveillance coordinators in local and state health departments and ArboNET technical staff, Div of Vector-Borne Diseases, National Center for Emerging and Zoonotic Infectious Diseases, CDC.
References
- Reimann CA, Hayes EB, DiGuiseppi C, et al. Epidemiology of neuroinvasive arboviral disease in the United States, 1999--2007. Am J Trop Med Hyg 2008;79:974--9.
- CDC. Surveillance for human West Nile virus disease---United States, 1999--2008. Surveillance Summaries, April 2, 2010.MMWR 2010;59(No. SS-2).
- Mostashari F, Bunning ML, Kitsutani PT, et al. Epidemic West Nile encephalitis, New York, 1999: results of a household-based seroepidemiological survey. Lancet 2001;358:261--4.
- Komar N. West Nile virus: epidemiology and ecology in North America. Adv Virus Res 2003;61:185--234.
- Hayes EB, Komar N, Nasci RS, Montgomery SP, O'Leary DR, Campbell GL. Epidemiology and transmission dynamics of West Nile virus disease. Emerg Infect Dis 2005;11:1167--73.
* Available at http://www.cdc.gov/ncphi/disss/nndss/casedef/arboviral_current.htm.
† A sample of mosquitoes (usually no more than 50) of the same species and sex, collected within a defined sampling area and period.
What is already known on this topic?
Since introduced into the United States in 1999, West Nile virus (WNV) has become the leading cause of arboviral encephalitis in the country.
What is added by this report?
In 2009, 386 cases of WNV neuroinvasive disease were reported in the United States, or 0.13 cases per 100,000 population, the lowest incidence recorded since 2001; however, CDC also estimated that 54,000 persons were infected with WNV in 2009, including 10,000 with nonneuroinvasive WNV disease.
What are the implications for public health practice?
The continuing disease burden caused by WNV affirms the need for ongoing surveillance, mosquito control, promotion of personal protection from mosquito bites, and research into additional prevention strategies.
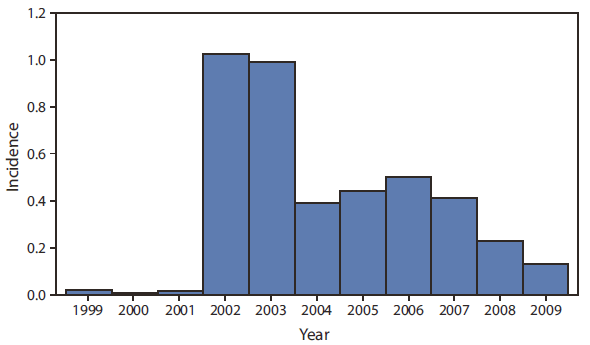
* Per 100,000 population, based on July 1 U.S. Census estimates for each year.
† Meningitis, encephalitis, or acute flaccid paralysis.
§ N = 12,208 during 1999--2009; N = 386 in 2009
Alternate Text: The figure above shows the annual incidence of cases (N = 12,208) of West Nile virus neuroinvasive disease in the United States during 1999-2009. In 2009, the 386 reported cases of neuroinvasive disease represented a rate of 0.13 per 100,000 population.
FIGURE 2. Incidence* of cases (N = 386) of West Nile virus neuroinvasive disease† --- ArboNET, United States, 2009
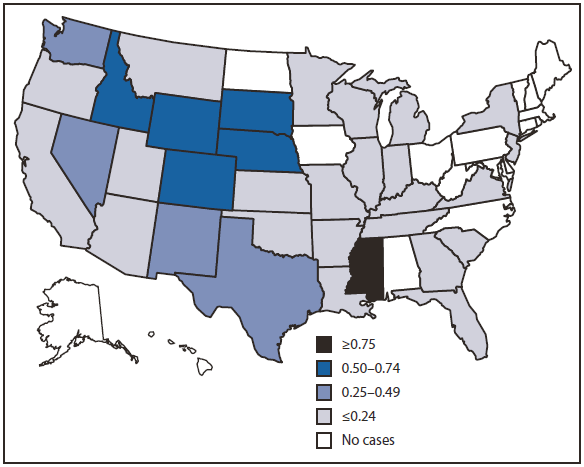
* Per 100,000 population, based on July 1, 2009 U.S. Census estimates.
† Meningitis, encephalitis, or acute flaccid paralysis.
Alternate Text: The figure above shows the incidence of cases (N = 386) of West Nile virus neuroinvasive disease in the United States for 2009. States reporting the most cases were Texas with 93 (24% of U.S. cases) and California with 67 (17%). Washington, which reported only two neuroinvasive disease cases in 2008, reported 26 (7%) cases in 2009. The five states with the highest incidence were Mississippi (31 cases, 1.05 cases per 100,000 residents), South Dakota (six cases, 0.74), Wyoming (four cases, 0.73), Colorado (36 cases, 0.72), and Nebraska (11 cases, 0.61).
FIGURE 3. Incidence* of cases (N = 386) of West Nile virus neuroinvasive disease,† by age group --- ArboNET, United States, 2009
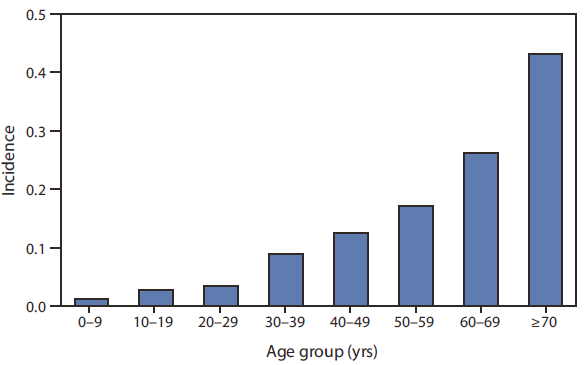
* Per 100,000 population, based on July 1, 2009 U.S. Census estimates.
† Meningitis, encephalitis, or acute flaccid paralysis.
Alternate Text: The figure above shows the incidence of cases of West Nile virus neuroinvasive disease, by age group in the United States for 2009. Of the 386 neuroinvasive disease cases, 226 (59%) occurred in males. The median age of patients was 60 years (range: 2-91 years), with increasing incidence among persons in older age groups.
Use of trade names and commercial sources is for identification only and does not imply endorsement by the U.S. Department of
Health and Human Services.
References to non-CDC sites on the Internet are
provided as a service to MMWR readers and do not constitute or imply
endorsement of these organizations or their programs by CDC or the U.S.
Department of Health and Human Services. CDC is not responsible for the content
of pages found at these sites. URL addresses listed in MMWR were current as of
the date of publication.
All MMWR HTML versions of articles are electronic conversions from typeset documents.
This conversion might result in character translation or format errors in the HTML version.
Users are referred to the electronic PDF version (http://www.cdc.gov/mmwr)
and/or the original MMWR paper copy for printable versions of official text, figures, and tables.
An original paper copy of this issue can be obtained from the Superintendent of Documents, U.S.
Government Printing Office (GPO), Washington, DC 20402-9371;
telephone: (202) 512-1800. Contact GPO for current prices.
**Questions or messages regarding errors in formatting should be addressed to
mmwrq@cdc.gov.
