
The HPV test and the Pap test can help prevent cervical cancer or find it early.

Screening tests and the HPV vaccine can help prevent cervical cancer.

Two tests can help find changes that could become precancer or cervical cancer.

The latest federal data on cervical cancer cases and deaths.
Featured topics

AMIGAS is a program that promotes cervical cancer screening among Hispanic women and Latinas.
The Face Your Health program encourages African American women to get screened for cervical cancer.
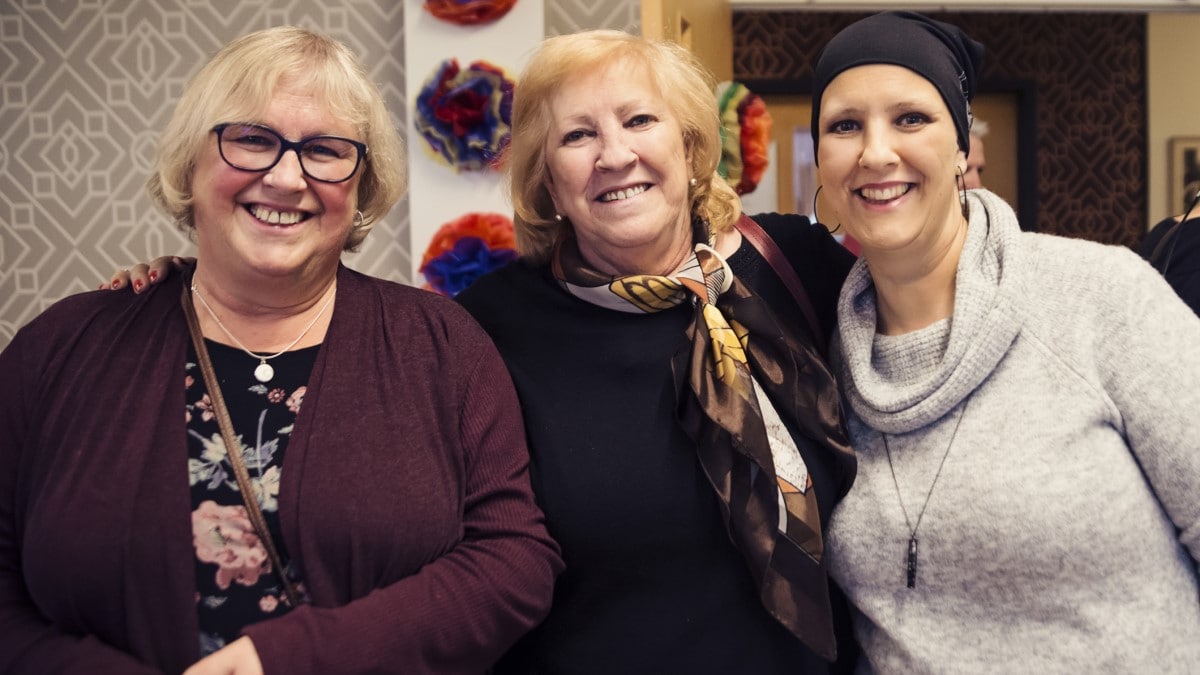
Women from across the country have shared their personal screening and survivor stories.