
Understand why breastfeeding is important and introduce the data.

2018–2019 National Vital Statistics System data to identify locations for focused interventions.

Public opinion surveys and data about breastfeeding.
For Professionals

Learn more about the breastfeeding rates survey.
How state and local organizations can achieve continuity of care for breastfeeding mothers.
Learn about the Maternity Practices in Infant Nutrition and Care (mPINC™) Survey.
Featured

Studies on breastfeeding and infant feeding practices.

Find information, potential activities, resources, and tools to help with your breastfeeding work.

Learn more about guidelines and recommendations on breastfeeding and infant feeding.
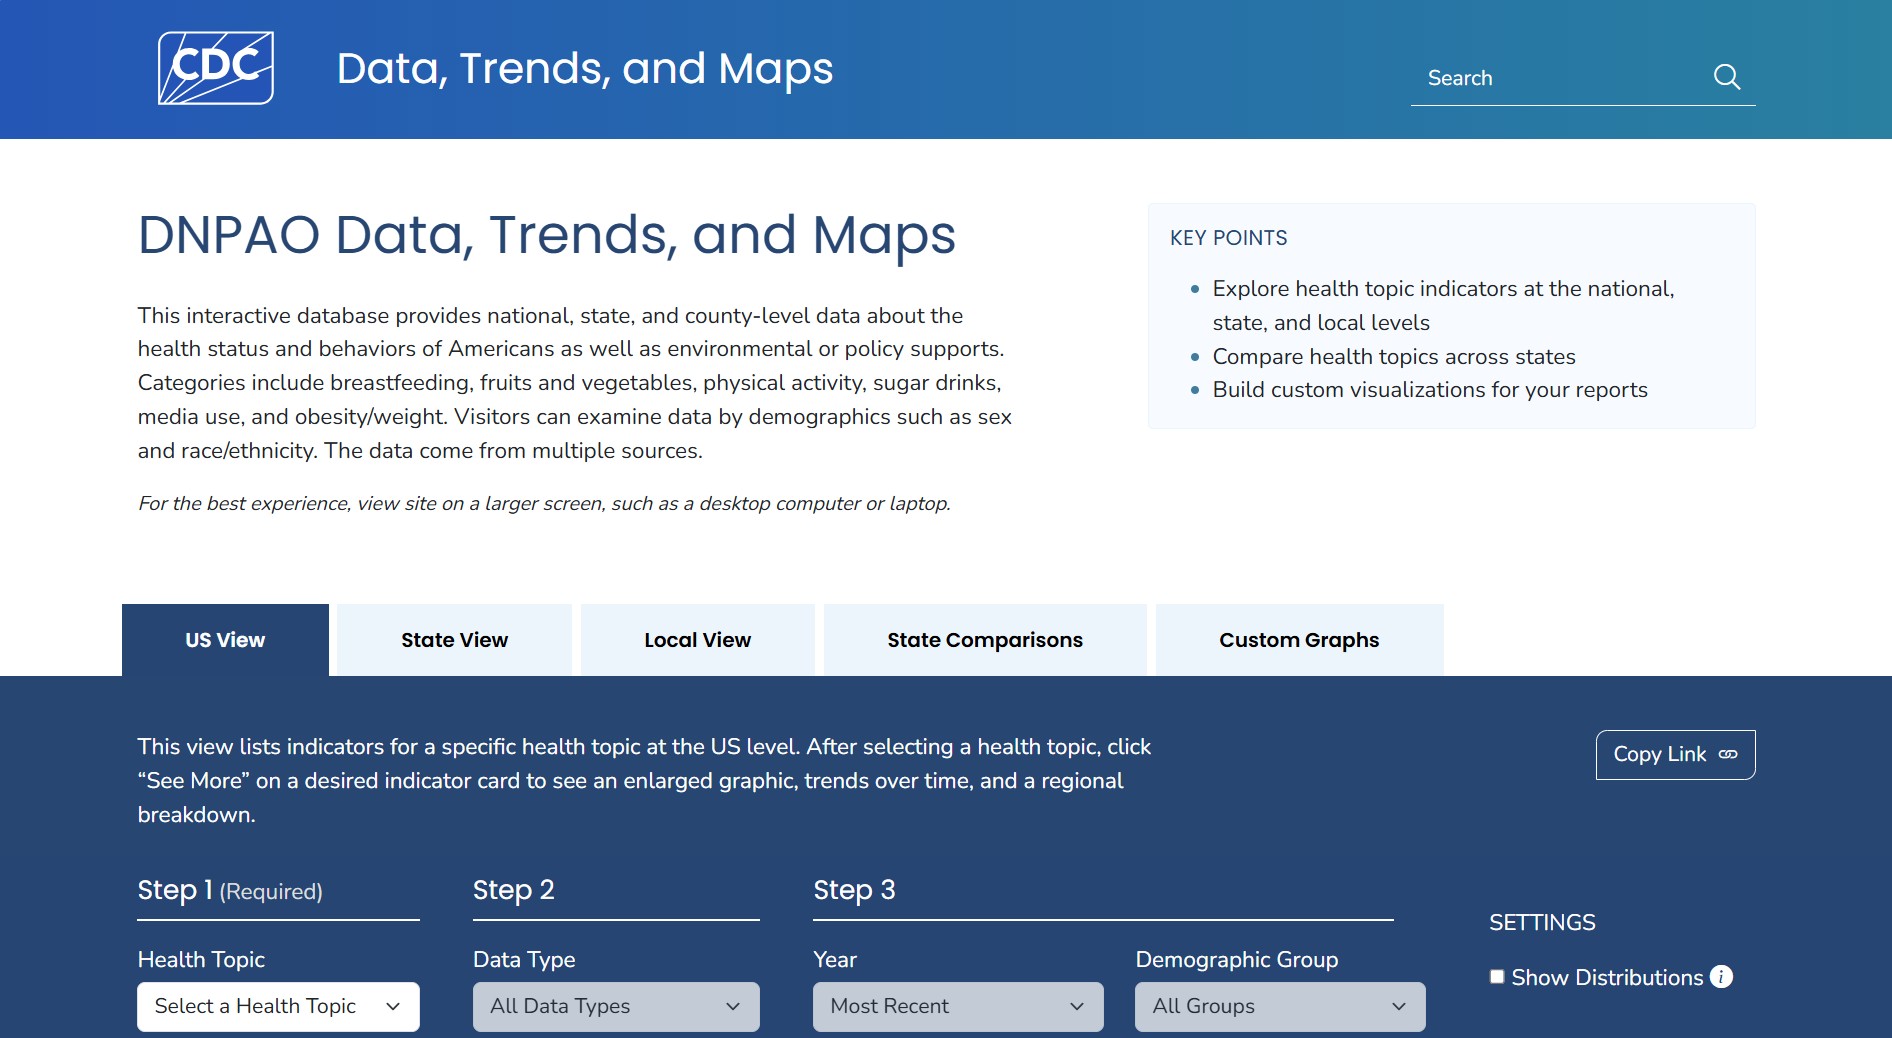
DNPAO's Data, Trends, and Maps of national and state health status and behaviors.
The Maternity Practices in Infant Nutrition & Care (mPINC™) Ten Steps Assessment Tool.

How environmental exposures, diet, and medical conditions affect breastfeeding.