Persons using assistive technology might not be able to fully access information in this file. For assistance, please send e-mail to: mmwrq@cdc.gov. Type 508 Accommodation and the title of the report in the subject line of e-mail.
Interim Adjusted Estimates of Seasonal Influenza Vaccine Effectiveness — United States, February 2013
Early influenza activity during the 2012–13 season (1) enabled estimation of the unadjusted effectiveness of the seasonal influenza vaccine (2). This report presents updated adjusted estimates based on 2,697 children and adults enrolled in the U.S. Influenza Vaccine Effectiveness (Flu VE) Network during December 3, 2012–January 19, 2013. During this period, overall vaccine effectiveness (VE) (adjusted for age, site, race/ethnicity, self-rated health, and days from illness onset to enrollment) against influenza A and B virus infections associated with medically attended acute respiratory illness was 56%, similar to the earlier interim estimate (62%) (2). VE was estimated as 47% against influenza A (H3N2) virus infections and 67% against B virus infections. When stratified by age group, the point estimates for VE against influenza A (H3N2) and B infections were largely consistent across age groups, with the exception that lower VE against influenza A (H3N2) was observed among adults aged ≥65 years. These adjusted VE estimates indicate that vaccination with the 2012–13 influenza season vaccine reduced the risk for outpatient medical visits resulting from influenza by approximately one half to two thirds for most persons, although VE was lower and not statistically significant among older adults. Antiviral medications should be used as recommended for treatment of suspected influenza in certain patients, including those aged ≥65 years, regardless of their influenza vaccination status.
Details of the VE network design, sites, and enrollment procedures have been described previously (2,3). In this report, patients aged ≥6 months seeking outpatient medical care for an acute respiratory illness with cough, within 7 days of illness onset, were enrolled at five study sites.* Consenting participants completed an enrollment interview. Nasal and oropharyngeal swabs were combined and tested using CDC's real-time reverse transcription–polymerase chain reaction (rRT-PCR) protocol. Participants were considered vaccinated if they had received ≥1 dose of any seasonal influenza vaccine ≥14 days before illness onset, according to medical records and registries (at Texas, Washington, and Wisconsin sites) or self-report (at Michigan and Pennsylvania sites).
Of the 2,697 children and adults enrolled during December 3, 2012–January 19, 2013, a total of 1,115 (41%) tested positive for influenza virus by rRT-PCR (Figure). The proportion of patients with influenza differed by study site, sex, age group, race/ethnicity, self-rated health status, and interval from illness onset to enrollment (Table 1). The proportion vaccinated ranged from 36% to 54% across sites and also differed by sex, age group, race/ethnicity, and self-rated health status (Table 1).
Among the patients with influenza, 32% had been administered the 2012–13 seasonal influenza vaccine, compared with 50% of the influenza-negative controls (Table 2). For all persons with medically attended acute respiratory illness, the overall VE (adjusted for age group, study site, race/ethnicity, self-rated health status, and days from illness onset to enrollment) against influenza A and B virus infections was 56% (95% confidence interval [CI] = 47%–63%) (Table 2). Significant VE against influenza A and B viruses was observed among persons in all age groups, except for adults aged ≥65 years.
Among the 751 infections with influenza A viruses, 560 (75%) had been subtyped; 546 (98%) of the infections were caused by influenza A (H3N2) viruses (Table 1). The adjusted VE for all ages against influenza A (H3N2) virus infection was 47% (CI = 35%–58%) (Table 2). The adjusted, age-stratified VE point estimates were 58% for persons aged 6 months–17 years, 46% for persons aged 18–49 years, 50% for persons aged 50–64 years, and 9% for persons aged ≥65 years (Table 2).
A total of 366 (33%) of the 1,115 cases had infections caused by influenza B viruses (Table 1). The adjusted VE estimate for all ages against influenza B was 67% (51%–78%) (Table 2). The adjusted VE point estimates against influenza B ranged from 64% to 75% across age groups.
Reported by
Lisa Jackson, MD, Michael L. Jackson, PhD, C. Hallie Phillips, MEd, Joyce Benoit, Group Health Research Institute, Seattle, Washington. Edward A. Belongia, MD, Deanna Cole, Sarah Kopitzke, MS, Tamara A. Kronenwetter Koepel, Huong Q. McLean, PhD, Jennifer K. Meece, PhD, Sandra K. Strey, Maria E. Sundaram, MSPH, Mary Vandermause, Marshfield Clinic Research Foundation, Marshfield, Wisconsin. Manjusha Gaglani, MBBS, Juhee Song, PhD, Lydia Clipper, Dean Kjar, MS, Anne Robertson, Kempapura Murthy, MPH, Melinda Dunnahoo, Stephanie Oliver, MS, Monica Weir, Hope Gonzales, Martha Zayed, Teresa Ponder, JoAnn Nichols, Michael Reis, MD, Cathleen Rivera, MD, David Morgan, MD, Pedro Piedra, MD, Vasanthi Avadhanula, PhD, Scott and White Healthcare, Temple, and Baylor College of Medicine, Houston, Texas. Arnold S. Monto, MD, Suzanne E. Ohmit, DrPH, Joshua G. Petrie, MPH, Emileigh Johnson, Rachel T. Cross, MPH, Casey Martens, Marcus Zervos, MD, Lois Lamerato, PhD, Mary Ann Aubuchon, Gregory G. Wolff, MPH, Univ of Michigan, Ann Arbor, and Henry Ford Health System, Detroit, Michigan. Heather Eng, Mary Patricia Nowalk, PhD, Stephen R. Wisniewski, PhD, Richard K. Zimmerman, MD, Charles R. Rinaldo, Jr, MD, Arlene Bullotta, Joe Suyama, MD, Evelyn Reis, MD, Donald B. Middleton, MD, Rachel Hess, MD, Jonathan M. Raviotta, MPH, Univ of Pittsburgh Schools of the Health Sciences and Univ of Pittsburgh Medical Center, Pittsburgh, Pennsylvania. Mark G. Thompson, PhD, Alicia M. Fry, MD, Swathi N. Thaker, PhD, Jill Ferdinands, PhD, Po-Yung Cheng, PhD, Sarah Spencer, PhD, Erin Burns, MA, LaShondra Berman, MS, Wendy Sessions, MPH, Angie Foust, MS, Joseph Bresee, MD, Nancy Cox, PhD, Influenza Div, CDC. Corresponding contributor: Mark G. Thompson, isq8@cdc.gov, 404-639-0814.
Editorial Note
These updated and age-adjusted VE estimates for the 2012–13 influenza vaccine confirm moderate effectiveness in preventing outpatient medical visits caused by circulating influenza viruses, similar to earlier unadjusted estimates in the United States (2) and to recent interim estimates from Canada and Europe (4,5). Overall, influenza vaccination reduced the risk for medical visits resulting from influenza A and B by 56%, from influenza A (H3N2) by 47%, and from influenza B by 67%. The preventive benefits against influenza B were consistent across age groups. The adjusted VE estimates against influenza A (H3N2) viruses also were largely consistent (46%–58%) for persons aged 6 months–64 years, but the estimate was not significant among persons aged ≥65 years. These VE estimates are not final; an increased sample size and adjustment for additional potential confounders (such as chronic medical conditions and functional status) at the end of the season could change these estimates.
Confirmation of the protective benefits of the 2012–13 influenza vaccine among persons aged 6 months–64 years offers further support for the public health benefit of annual seasonal influenza vaccination and supports the expansion of vaccination, particularly among younger age groups. The nonsignificant adjusted VE of 9% against A (H3N2) among persons aged ≥65 years is similar to the estimate in a recent interim report from Europe (6) and reinforces the need for continued advances in influenza vaccines, especially to increase protective benefits for older adults.
One possible explanation for these findings is that some older adults did not mount an effective immune response to the influenza A (H3N2) component of this season's vaccine. Nonetheless, this finding should not discourage future vaccination by persons aged ≥65 years, who are at greater risk for more severe cases and complications from influenza. Influenza vaccines remain the best preventive tool available, and VE is known to vary by virus type/subtype, age group, season, host immunity, and the outcome measured (7). This study observed a VE point estimate against influenza B (67%) that was much higher than the 9% VE estimate against A (H3N2) among older adults, although the precision of estimates was limited by the small sample. Although some previous studies have shown influenza vaccine benefits for older adults, others have failed to demonstrate statistically significant benefits against specific influenza types or subtypes (7). Variability among studies and across seasons and age groups is to be expected and should not change recommendations for annual vaccination. It is also important to note that the VE estimates in this report are limited to the prevention of outpatient medical visits, rather than more severe illness outcomes, such as hospitalization or death. A previous multiseason study found that the influenza vaccine reduced the risk for influenza-associated hospitalizations among older adults by 61% (CI = 18%–82%) (8). A full evaluation of the VE for older adults this season must await consideration of additional data and outcomes.
Clinicians should maintain a high index of suspicion for influenza infection among persons with acute respiratory illness while influenza activity is ongoing. Early antiviral treatment can reduce influenza-associated illness severity and complications (9); this season, antiviral treatment of elderly adults is especially important.† CDC recommends initiating antiviral medications for patients with suspected influenza, regardless of their influenza vaccination status, if they are aged ≥65 years, or hospitalized, or have progressive or complicated illness, or otherwise are at higher risk for complications from influenza.§ Antiviral treatment can be initiated empirically, preferably within 48 hours after illness onset, and should not be delayed pending confirmatory diagnostic testing nor be dependent upon tests with limited sensitivity (e.g., negative rapid tests). Among hospitalized patients, treatment should be initiated on admission; several studies suggest effectiveness of antiviral treatment even when initiated ≥48 hours after illness onset (9).
The findings in this report are subject to at least four limitations. First, the observational study design has greater potential for confounding and bias relative to randomized clinical trials. Second, although these midseason VE estimates were adjusted for potential confounders identified in previous studies (3), additional factors will be considered in final end-of-season estimates, including health-care–seeking behavior, differences in functional status, and severity of illness, which could influence VE estimates, especially for older adults. Third, no adjustment was made for chronic medical conditions, because of a lack of medical record data for interim analyses; however, VE estimates were adjusted for self-rated health, which is associated with chronic illness and mortality risk (10). Finally, the immunization status of young children (which requires vaccine histories) and vaccine product information (e.g., inactivated compared with live attenuated) also were unavailable for this interim analysis. End-of-season VE estimates could change as additional patient data become available or if circulating viruses or population immunity change over the remainder of the season.
Although imperfect, influenza vaccines remain the best tool currently available for preventing illness from influenza. This report highlights the value of both increasing the use of influenza vaccines, especially among children and young adults, and continuing efforts to develop more effective vaccines and vaccination strategies. Antiviral medications are important for the treatment and control of influenza and should be used as recommended, regardless of patient vaccination status.
Acknowledgments
Erika Kiniry, MPH, Group Health Research Institute, Seattle, Washington. Elizabeth Armagost, Marilyn Bruger, Yvonne Cerné, Anne Edwards, Krista Galpin, William Gillaspie, Jeri Groskinsky, Holly Hamel, Deborah Hilgemann, Deb Johnson, Tara Johnson, Diane Kohnhorst, Madalyn Minervini, Suellyn Murray, Emily Novicki, Maisie Pettinger, Becky Pilsner, DeeAnn Polacek, Theresa Pritzl, Kristina Reisner, Gerri River, Jacklyn Salzwedel, Scott Sandberg, Teresa Schultz, Patrick Stockwell, Jennifer Anderson, Donna David, Phillip Bertz, Lynn Ivacic, Elisha Stefanski, Wayne Frome, Carol Beyer, Ruth Mueller, Bobbi Bradley, MPH, Laurel Verhagen, Marshfield Clinic Research Foundation, Marshfield, Wisconsin. Latoya Allen, Sheila Bracey, Ronald Brand, Ashley Buys, Mary Kate Cartmill, Brianna Costello, Hillary Craddock, Allison Dalgleish, Cyrus Farahani, Lora Girata, Heloise Glenn, Anne Kaniclides, Allison Keshishian, Mark Kolar, Nancy Lasceski, Ryan Malosh, MPH, Paula Miller, Molly Oberdoerster, Oanh Kim Pham, Marisa Richard, Elizabeth Vickers, Univ of Michigan, Ann Arbor, and Henry Ford Health System, Detroit, Michigan. Alan Aspinall, MD, Luis Duran, MPH, Edward Garofolo, MD, Richard Hoffmaster, MD, Philip Iozzi, MD, Thomas Lynch, MD, Krissy Moehling, MPH, Nicolle Nestler, MPH, Edmund M. Ricci, PhD, Sandra Sauereisen, MD, Gregory Smith, MD, Michael Susick, MPH, Leonard Urbanski, MD, Donald S. Burke, MD, Univ of Pittsburgh Schools of the Health Sciences and Univ of Pittsburgh Medical Center, Pittsburgh, Pennsylvania. Jerome Tokars, MD, Emily Eisenberg, Lisa Grohskopf, MD, Douglas Jordan, David Shay, MD, Jessie Clippard, MPH, Influenza Div; Jane Seward, MBBS, Div of Viral Diseases, David Swerdlow, MD, Office of the Director, National Center for Immunization and Respiratory Disease; Sonja S. Hutchins, MD, Office of Minority Health and Health Equity, CDC.
References
- CDC. Fluview. 2012–2013 influenza season week 3 ending January 19, 2013. Atlanta, GA: US Department of Health and Human Services, CDC; 2013. Available at http://www.cdc.gov/flu/weekly/weeklyarchives2012-2013/weekly03.htm.
- CDC. Early estimates of seasonal influenza vaccine effectiveness—United States, January 2013. MMWR 2013;62:32–5.
- Treanor J, Talbot HK, Ohmit SE, et al. Effectiveness of seasonal influenza vaccines in the United States during a season with circulation of all three vaccine strains. Clin Infect Dis 2012;55:951–9.
- McMenamin J, Andrews N, Robertson C, et al. Effectiveness of seasonal 2012/13 vaccine in preventing laboratory-confirmed influenza infection in primary care in the United Kingdom: mid-season analysis 2012/13. Euro Surveill 2013;18(5).
- Skowronski DM, Janjua NZ, De Serres G, et al. Interim estimates of influenza vaccine effectiveness in 2012/13 from Canada's sentinel surveillance network, January 2013. Euro Surveill 2013;18(5).
- Bragstad K, Emborg HD, Kølsen Fischer T, et al. Low vaccine effectiveness against influenza A (H3N2) virus among elderly people in Denmark in 2012/13—a rapid epidemiological and virological assessment. Euro Surveill 2013;18(6).
- Osterholm MT, Kelley NS, Sommer A, Belongia EA. Efficacy and effectiveness of influenza vaccines: a systematic review and meta-analysis. Lancet Infect Dis 2012;12:36–44.
- Talbot HK, Griffin MR, Chen Q, Zhu Y, Williams JV, Edwards KM. Effectiveness of seasonal vaccine in preventing confirmed influenza-associated hospitalizations in community dwelling older adults. J Infect Dis 2011;203:500–8.
- CDC. Antiviral agents for the treatment and chemoprophylaxis of influenza: recommendations of the Advisory Committee on Immunization Practices (ACIP). MMWR 2011;60(No. RR-1).
- Singh-Manoux A, Martikainen P, Ferrie J, Zins M, Marmot M, Goldberg M. What does self rated health measure? Results from the British Whitehall II and French Gazel cohort studies. J Epidemiol Community Health 2006;60:364–72.
* The five network sites and the dates enrollment began were as follows: Group Health Cooperative (Seattle, Washington) (December 26, 2012); the Marshfield Clinic Research Foundation (Marshfield, Wisconsin) (December 17, 2012); the University of Michigan School of Public Health, partnered with the University of Michigan Health System (Ann Arbor, Michigan) (December 17, 2012) and the Henry Ford Health System (Detroit, Michigan) (January 2, 2013); the University of Pittsburgh Schools of the Health Sciences, partnered with the University of Pittsburgh Medical Center (Pittsburgh, Pennsylvania) (December 3, 2012); and Scott and White Healthcare (Temple, Texas) (December 9, 2012).
† A CDC influenza update for geriatricians and other clinicians caring for persons aged ≥65 years is available at http://www.cdc.gov/flu/professionals/2012-2013-guidance-geriatricians.htm.
§ Guidance for clinicians on antiviral use is available at http://www.cdc.gov/flu/professionals/antivirals/summary-clinicians.htm.
What is already known on this topic?
Annual vaccination is the mainstay of influenza prevention, but overall effectiveness of the influenza vaccine is moderate and varies by year, virus type, and population subgroup. Early unadjusted interim estimates of overall vaccine effectiveness (VE) for the 2012–13 season indicated the vaccine was 62% effective among all ages at preventing medically attended, laboratory-confirmed influenza A and B virus infections.
What is added by this report?
This report provides updated and adjusted VE estimates for the 2012–13 influenza season based on data from 2,697 children and adults with acute respiratory illness enrolled in the U.S. Influenza Vaccine Effectiveness (Flu VE) Network during December 3, 2012–January 19, 2013. The overall VE (adjusted for age group, study site, race/ethnicity, self-rated health status, and days from illness onset to enrollment) for all ages at preventing medically attended influenza A and B virus infections was 56% (95% confidence interval = 47%–63%). VE was estimated at 47% against influenza A (H3N2) virus infections and 67% against influenza B virus infections. VE against influenza A (H3N2) was lower and not statistically significant among adults aged ≥65 years.
What are the implications for public health practice?
The 2012–13 seasonal influenza vaccine provides substantial protection for the population overall, which underscores the public health value of vaccination. Nonetheless, some vaccinated persons have become ill with influenza this season, especially among persons aged ≥65 years. Antiviral medications are an important second line of defense against influenza and should be used promptly, as recommended for treatment of suspected influenza in certain patients in high-risk groups, including those aged ≥65 years, regardless of their vaccination status.
FIGURE. Numbers of influenza-positive cases and influenza-negative controls, by surveillance week of illness onset — U.S. Influenza Vaccine Effectiveness Network, United States, December 3, 2012–January 19, 2013
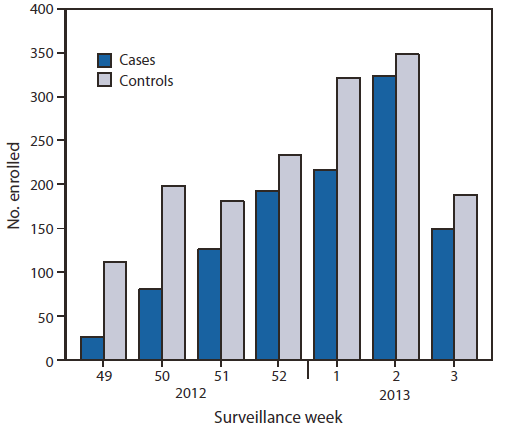
* Week 3 includes only patients with completed laboratory tests and thus does not reflect all enrolled patients during that week across study sites.
Alternate Text: The figure above shows the number of influenza-positive cases and influenza-negative controls, by surveillance week of illness onset in the United States during December 3, 2012- January 19, 2013, according to the U.S. Influenza Vaccine Effectiveness Network. Of the 2,697 children and adults enrolled from December 3, 2012 to January 19, 2013, a total of 1,115 (41%) tested posi¬tive for influenza virus by rRT-PCR.
Use of trade names and commercial sources is for identification only and does not imply endorsement by the U.S. Department of
Health and Human Services.
References to non-CDC sites on the Internet are
provided as a service to MMWR readers and do not constitute or imply
endorsement of these organizations or their programs by CDC or the U.S.
Department of Health and Human Services. CDC is not responsible for the content
of pages found at these sites. URL addresses listed in MMWR were current as of
the date of publication.
All MMWR HTML versions of articles are electronic conversions from typeset documents.
This conversion might result in character translation or format errors in the HTML version.
Users are referred to the electronic PDF version (http://www.cdc.gov/mmwr)
and/or the original MMWR paper copy for printable versions of official text, figures, and tables.
An original paper copy of this issue can be obtained from the Superintendent of Documents, U.S.
Government Printing Office (GPO), Washington, DC 20402-9371;
telephone: (202) 512-1800. Contact GPO for current prices.
**Questions or messages regarding errors in formatting should be addressed to
mmwrq@cdc.gov.
