At a glance
- Spotted fever rickettsiosis (SFR) annual reported cases 2000-2023
- Historical trends of SFR
- Seasonality of SFR
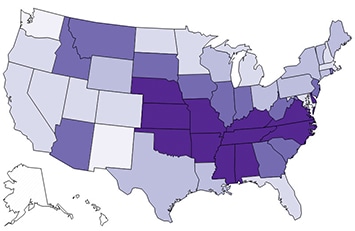
- States reporting SFR
- People at risk of SFR
Data and Statistics
Due to the coronavirus disease 2019 (COVID-19) pandemic, 2019 and 2020 data from some jurisdictions may be incomplete.
Average annual incidence of reported spotted fever rickettsiosis by geography in US 2018
Average annual incidence of reported spotted fever rickettsiosis by geography in US 2019
Average annual incidence of reported spotted fever rickettsiosis by geography in US 2020
Annual reported spotted fever rickettsiosis by geography for 2021
Average annual incidence of reported spotted fever rickettsiosis by geography in US 2018-2022
Average annual incidence of reported spotted fever rickettsiosis by age in US 2018-2022
Reported incidence and case fatality of spotted fever rickettsiosis in the US 1920-2017
Reported cases of spotted fever rickettsiosis in the US 2000-2022
Reported cases of spotted fever rickettsiosis by month of onset US 2018-2022
Number of reported cases of SFR US 2000 to 2023
Average annual incidence of reported SFR by age group 2019 to 2023
Average number of reported cases of SFR by month of onset US 2019 to 2023
Annual incidence of reported SFR geography US 2023