Highlights
- After Hurricane Harvey made landfall in Texas in 2017, biohazard exposure and injuries among residents of affected areas was widespread.
- Texas public health officials used syndromic surveillance to analyze the increase in emergency department (ED) visits by those who evacuated to the Dallas–Fort Worth area.
- Syndromic data analyses demonstrated the importance of planning for medical surge capacity in areas one to four hours outside the disaster area.
Public health problem
Hurricane Harvey made landfall in Texas on Aug. 25, 2017, resulting in 88 fatalities and more than $125 billion in damages to infrastructure. In Houston, flooding created a toxic mix of chemicals, sewage, biohazards, and 8 million cubic yards of garbage. The level of biohazard exposure, as well as injuries from trauma among persons residing in affected areas, was widespread and likely contributed to increases in ED visits in Houston and cities that received persons evacuating from the hurricane.
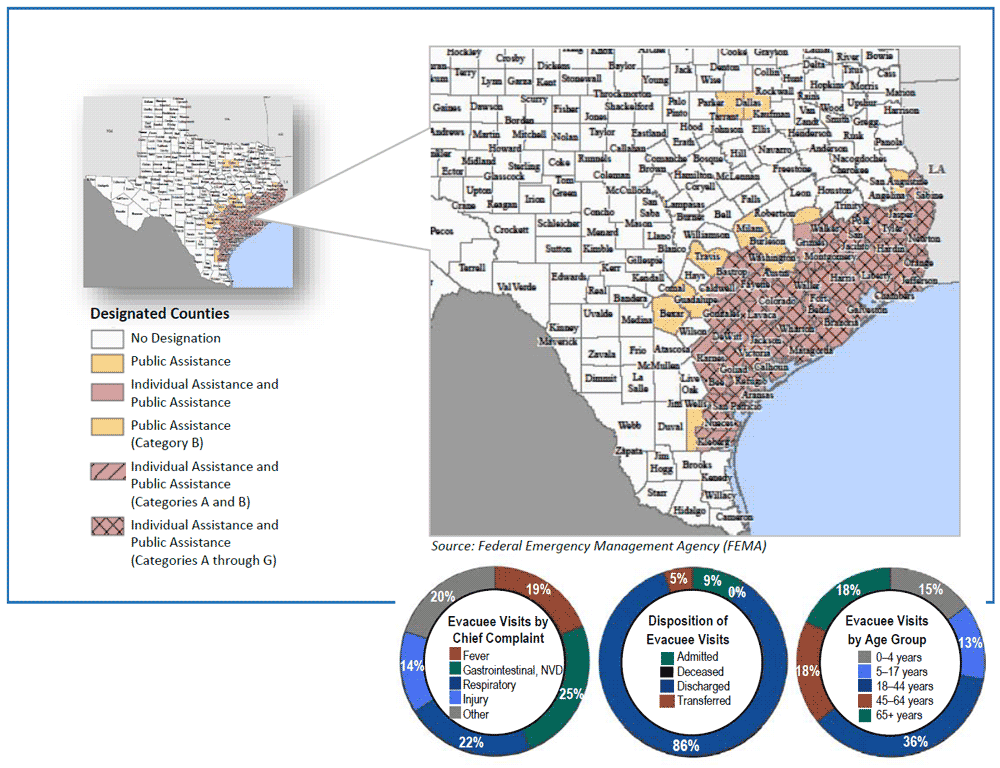
Health scientists with Tarrant County Public Health worked with CDC to investigate the medical surge associated with Hurricane Harvey in Dallas–Fort Worth (DFW) metroplex EDs. Evacuees from 60 Texas counties with disaster declarations (Figure 1) sought care outside the storm impact zone, many in DFW. The health scientists looked at spatial and temporal variation in ED visits to DFW hospitals attributable to the storm.
Actions taken
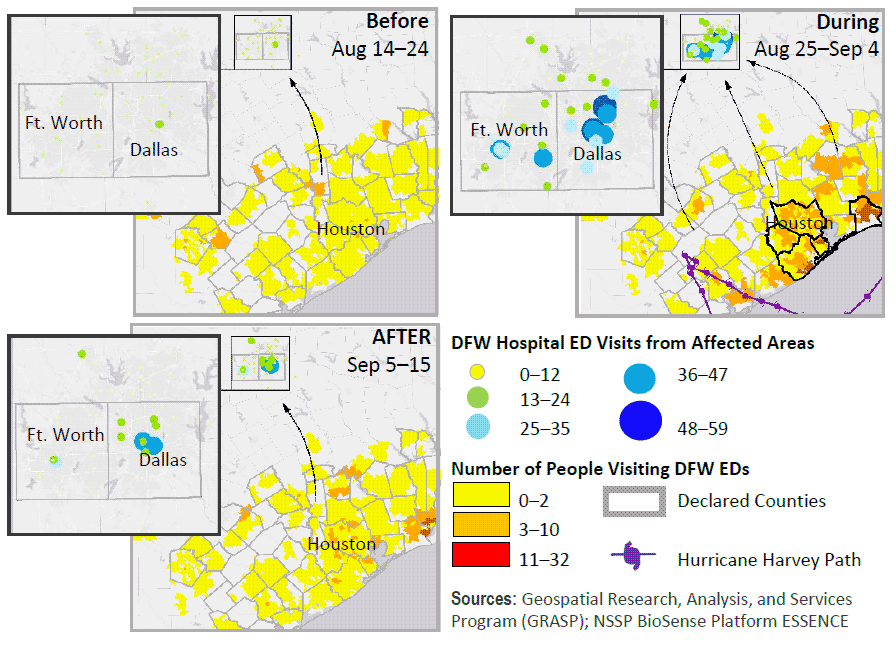
This study used the Texas Health Service Region 2/3 syndromic surveillance data from Aug. 6, 2017, to Sept. 23, 2017, to identify statistically significant surge. Data from three 11-day periods before, during, and after the storm (Figure 2) were visualized to characterize magnitude, duration, and spatial variation of medical surge associated with Hurricane Harvey.
Outcome
Results demonstrate the use of spatial and temporal methods for detecting ED surges associated with disasters. Analysis of syndromic data demonstrated both statistically and visually the expansive use of health care services extending outside the areas most affected by this natural disaster.
Between Aug. 25, 2017, and Sept. 7, 2017, ED visits in the DFW area increased about 4% per day, totaling roughly 4,400 excess visits. Among these excess visits, at least 600 were attributed to evacuees (people from 60 Texas counties with emergency declarations due to Hurricane Harvey). Overall, ED visits by evacuees increased substantially—about 200% per day:
- Approximately 600 excess visits
- Increased visits across all age groups
- 40% of visits from Harris County residents
- 25% of visits for gastrointestinal complaints
- Significant increase in nausea-vomiting-diarrhea (NVD) visits
While most hospitals in the area experienced significant surge, at least 10 hospitals experienced a 600% ED visit surge from evacuees, two of which experienced >1,000% surge.
Note: A poster was presented August 2018 at the Public Health Informatics Conference.
Lessons learned
This study highlights the utility of syndromic surveillance data for conducting timely analyses associated with disasters.
- Disaster preparedness efforts should be coordinated across geographic boundaries to account for population mobility during an event.
- Disaster planning includes the support your health care facility will provide to others. Hospitals within 1 to 4 hours driving distance from major disasters should prepare in advance of the storm for a medical surge.
- Public health agencies should improve surveillance methods to track disaster deaths and injuries associated with evacuees.
- Receiving area health departments should establish disease investigation dashboards. These dashboards could correlate syndromes with notifiable diseases and specific causes (for example, the National Vulnerability Database) to more rapidly react to deaths and injuries.
Resources
Centers for Disease Control and Prevention
Office of Public Health Preparedness and Response
Noelle Molinari, Health Economist, nmolinari@cdc.gov
Tanya LeBlanc, Lead Sr. Health Scientist, tqs3@cdc.gov
Office of Public Health Data, Surveillance, and Technology
Detect and Monitor Division
www.cdc.gov/nssp
CDC/Agency for Toxic Substances and Disease Registry
Office of the Director, Division of Toxicology and Human Health Sciences
Geospatial Research, Analysis, and Services Program (GRASP)
Grete E. Wilt, mlo2@cdc.gov
Erica Elaine Adams, yun2@cdc.gov
The findings and outcomes described in this syndromic success story are those of the authors and do not necessarily represent the official position of the National Syndromic Surveillance Program or the Centers for Disease Control and Prevention.