Purpose
CDC recommends that public health professionals check site volume daily and inspect changes in data quality at least once a week. These tips and tools will help.

ESSENCE helps track changes over time
Data quality is like a box of chocolates: You never know what elements you're going to get. That's why NSSP recommends checking site volume daily and inspecting changes in data quality at least once a week. There are several tools you can use to monitor changes in data quality, including ESSENCE.
ESSENCE is an excellent tool for monitoring changes over time in overall site volume and number and percent of visits with complete and valid values for several data elements (e.g., visit volume, calculated race, calculated ethnicity, age, sex). (Tip: NSSP recommends starting with short periods, such as a week or 10 days, before expanding ESSENCE data quality queries to longer periods.)
ESSENCE lets you create micrograph timeseries that can be stratified across graphs by a data element (e.g., calculated race, age, sex), geography systems (e.g., hospital/facility, county/region), or even medical grouping systems (e.g., ESSENCE syndromes, chief complaint/discharge diagnosis categories).
You can also customize visual aspects of the micrograph panels. For example, you can remove graphs with zero series, add graph titles, specify height and width, and add a "free" y-axis.
ESSENCE versus Data Quality Dashboard
There are key differences in how data quality is measured in ESSENCE and by the Data Quality Dashboard. Understanding this can help you reconcile variations in data quality metrics between the two.
The Data Quality Dashboard uses any messages with non-null element values received during a patient visit to count that data element as "complete." Conversely, ESSENCE applies additional business processing rules (for example: age is sourced from the last message for a visit; chief complaint is sourced from first non-null value for a visit). This may influence what is represented in ESSENCE as complete.
Please visit the Data Dictionary to learn about these processing rules and how they can differ between processed data and ESSENCE. More questions? Please submit a Service Desk ticket.
Data Quality tabs in MyESSENCE
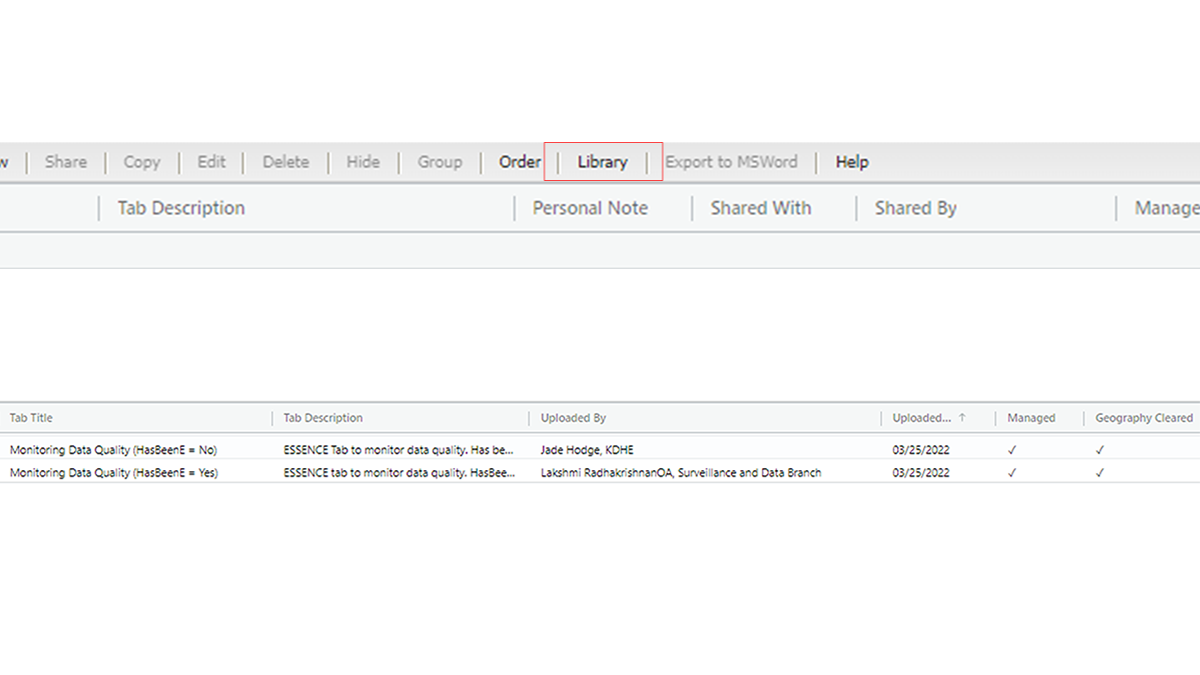
Two tabs are available in the MyESSENCE library for monitoring data quality:
- Monitoring Data Quality (HasBeenE = Yes). This tab is restricted to visits where patients visited the emergency department. Please see the NSSP Data Dictionary to learn more about how HasBeenE is calculated.
- Monitoring Data Quality (HasBeenE = No). This tab is restricted to visits where patients did not visit the emergency department.
Each tab includes micrograph timeseries for monitoring facility-level changes in the percent of visits with incomplete information. For example, if your site appears to be sending visits with incomplete chief complaints, you can look at the micrograph timeseries to see which facility is sending incomplete information, and then follow up:
- Visit volume
- Non-informative discharge diagnosis (DDI = No)
- Non-informative chief complaint (CCI = No)
- Unknown values for age
- Unknown values for sex
- Unknown, not categorized, not reported or null values for calculated race
- Unknown, not categorized, not reported or null values for calculated ethnicity
- Unknown values for patient ZIP code
- Null or blank triage notes original
- Null or blank clinical impression
- Null initial temperature
To access these queries, please go to the MyESSENCE library tab (Figure 1):
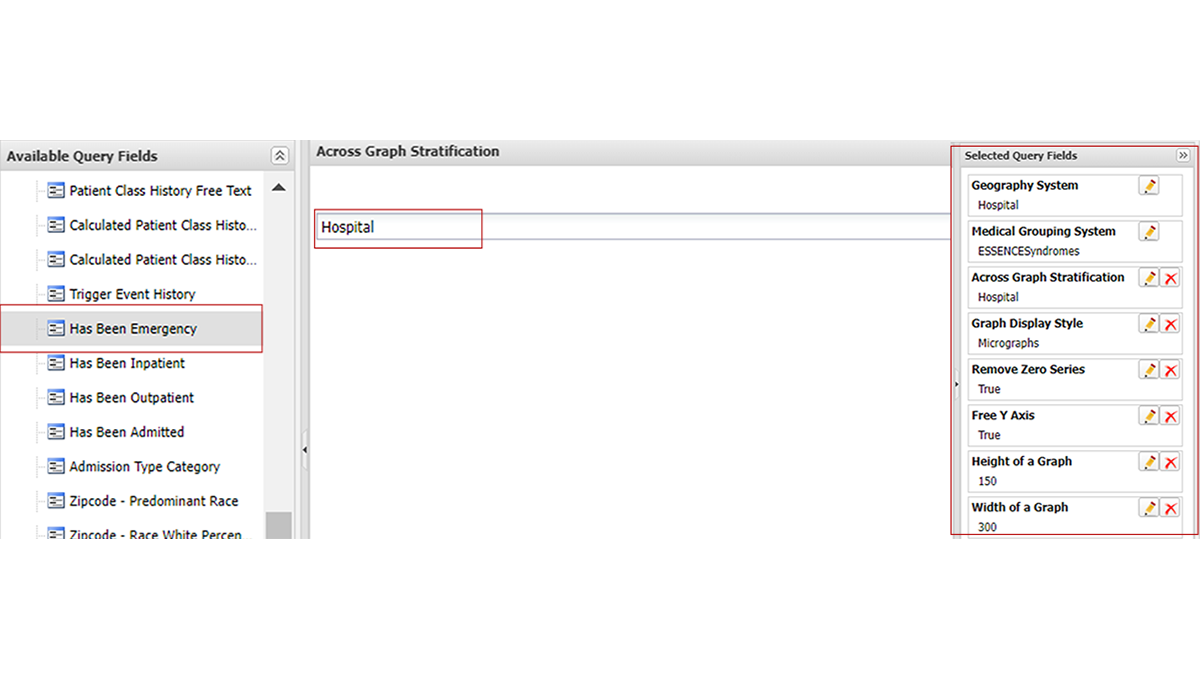
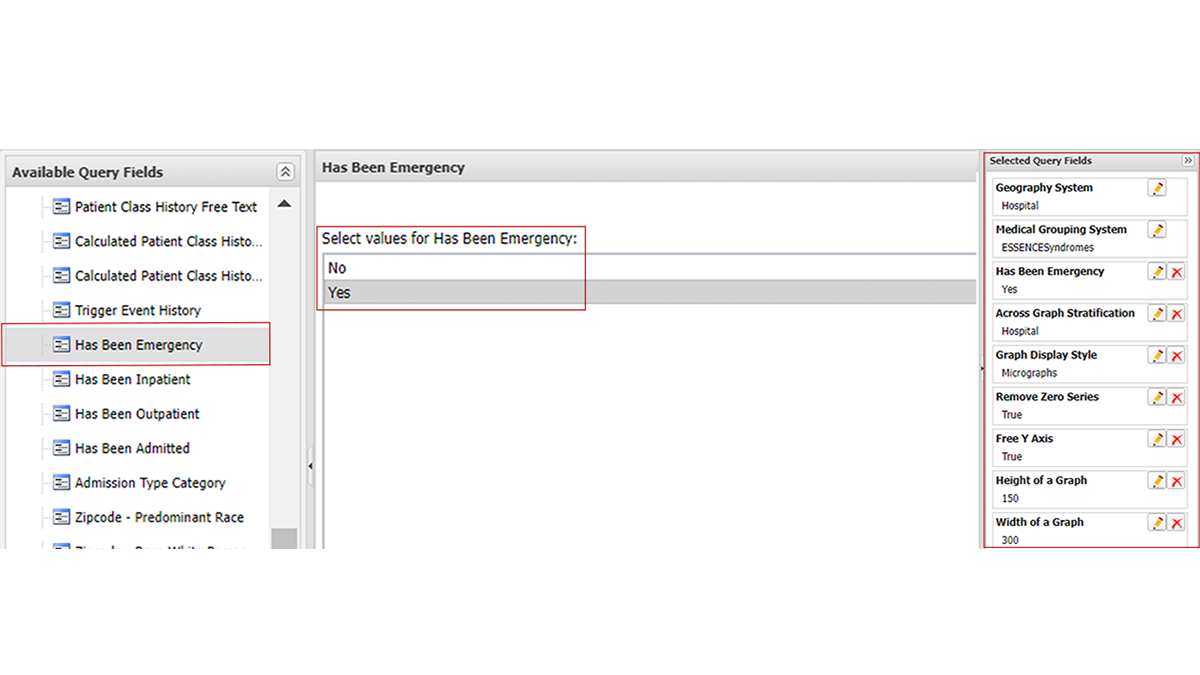
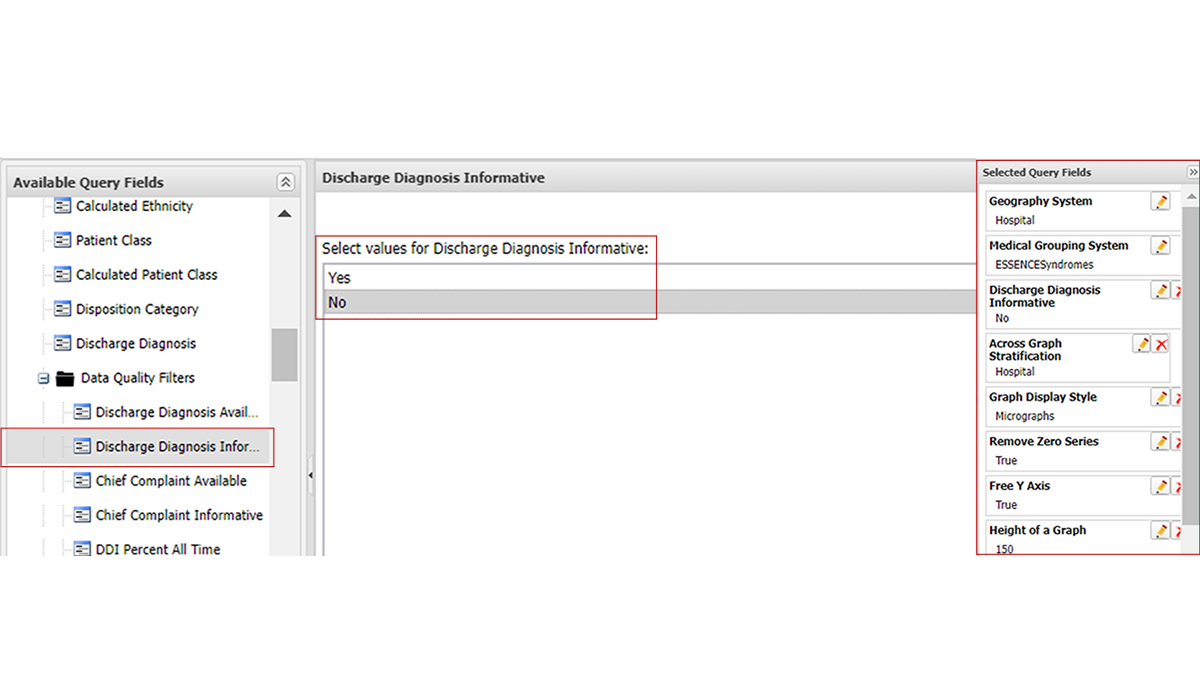
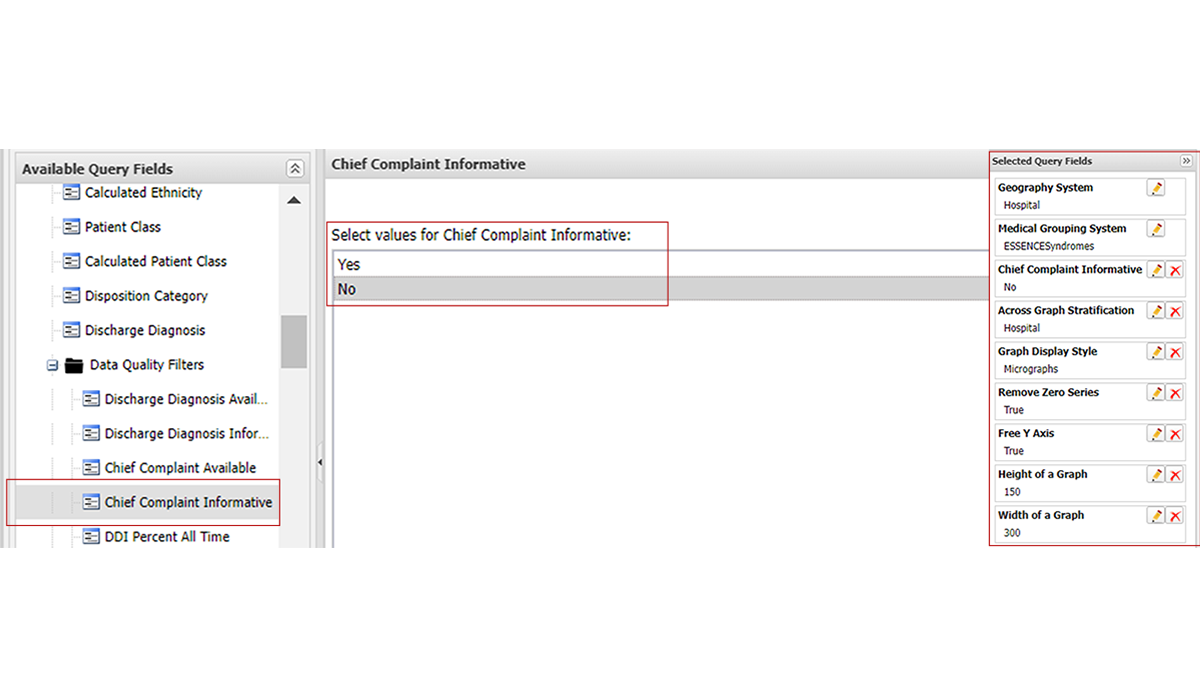
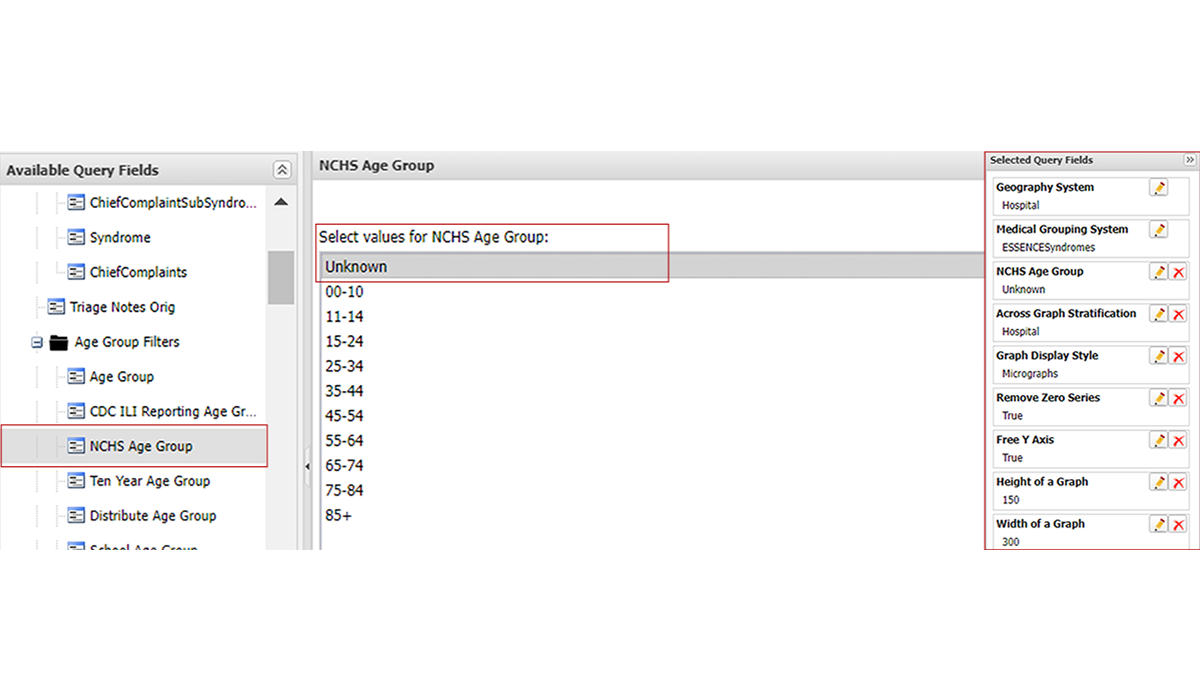
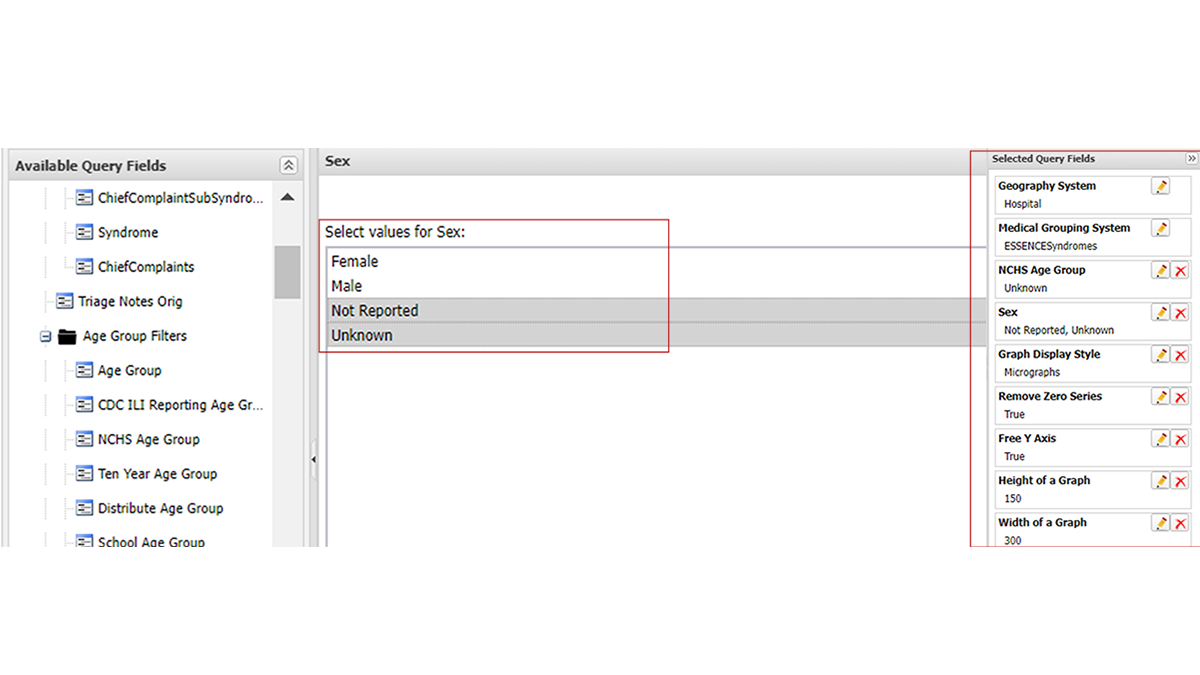
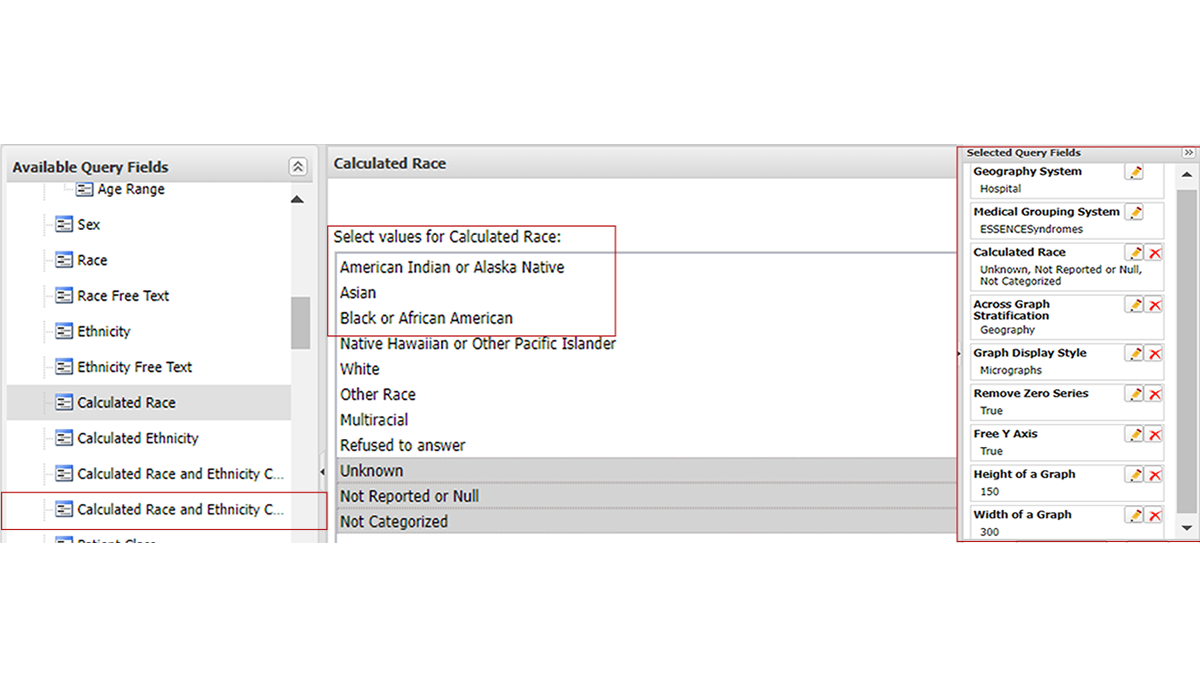
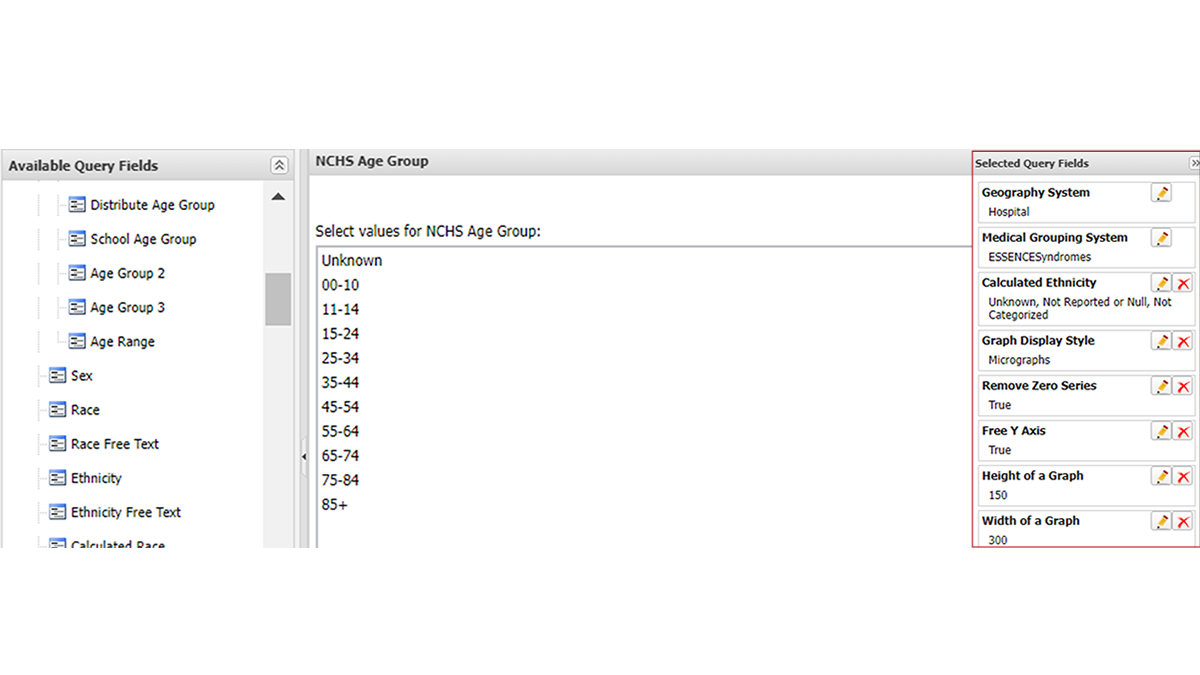
You can also create your own ESSENCE queries to monitor changes in data quality. Here are some screenshots with selected query fields (Figures 2–13).