Unmet Need for Health Care
The content on this page was last updated in June 2023. More recent estimates and visualizations may be available from the NCHS Data Query System.
Access to health care refers to the timely use of personal health services to achieve the best possible health outcomes (1). People may encounter financial and nonfinancial barriers that reduce their access to needed health care. Delayed or failure to receive needed care may result in poorer health outcomes.
Key Findings
Delay or nonreceipt of needed medical care due to cost

The percentage of people of all ages who delayed or did not receive needed medical care due to cost in the past 12 months decreased from 11.4% in 2009 to 7.2% in 2016, and then increased to 8.3% in 2018. In 2019, 8.5% of people delayed or did not receive needed medical care due to cost in the past 12 months. See Featured Charts for additional analyses and Notes for more information about analyzing trends using NHIS data.
SOURCE: National Center for Health Statistics, National Health Interview Survey. See Sources and Definitions, National Health Interview Survey (NHIS) and Health, United States, 2020–2021 Table UnmtNd.
Nonreceipt of needed prescription drugs due to cost

The percentage of people of all ages who did not receive needed prescription drugs due to cost in the past 12 months decreased from 8.4% in 2009 to 5.2% in 2015, and then did not change significantly through 2018 (5.3%). In 2019, 5.6% of people did not receive needed prescription drugs due to cost in the past 12 months.
SOURCE: National Center for Health Statistics, National Health Interview Survey. See Sources and Definitions, National Health Interview Survey (NHIS) and Health, United States, 2020–2021 Table UnmtNd.
Nonreceipt of needed dental care due to cost

The percentage of people aged 2 years and over who did not receive needed dental care in the past 12 months due to cost decreased from 13.3% in 2009 to 8.9% in 2016, and then increased to 9.9% in 2018. In 2019, 14.7% of people aged 2 and over did not receive needed dental care due to cost in the past 12 months. See Featured Charts for additional analyses and Notes for more information about analyzing trends using NHIS data.
SOURCE: National Center for Health Statistics, National Health Interview Survey. See Sources and Definitions, National Health Interview Survey (NHIS) and Health, United States, 2020–2021 Table UnmtNd.
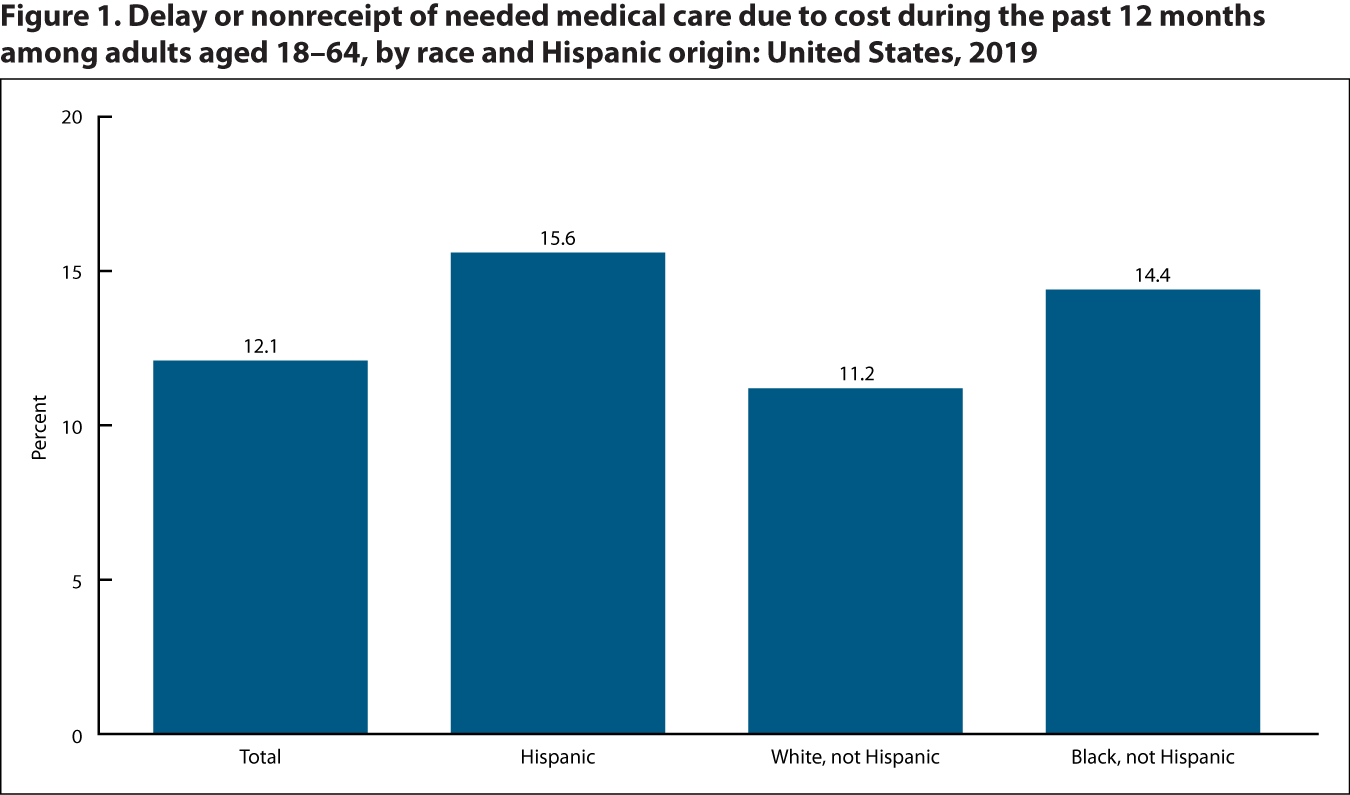
In 2019, unmet need for medical care due to cost in the past year was higher among adults who were non-Hispanic Black and Hispanic than among those who were non-Hispanic White.

SOURCE: National Center for Health Statistics, National Health Interview Survey. See Sources and Definitions, National Health Interview Survey (NHIS) and Health, United States, 2020–2021 Table UnmtNd.
- In 2019, 12.1% of adults aged 18–64 delayed or did not receive needed medical care due to cost in the past 12 months.
- The percentage of adults aged 18–64 who delayed or did not receive medical care due to cost was higher among Hispanic (15.6%) and non-Hispanic Black (14.4%) adults than among non-Hispanic White adults (11.2%).
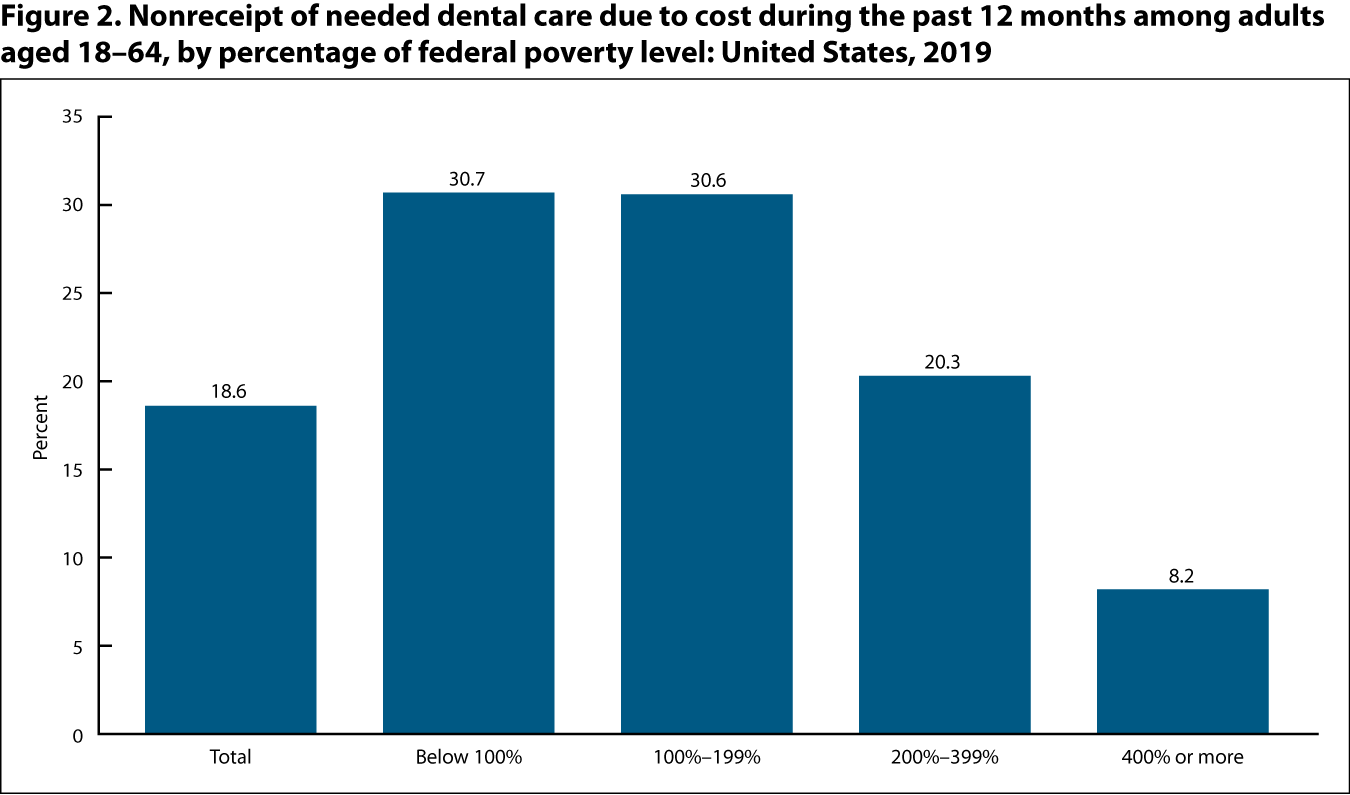
Unmet need for dental care due to cost is most common among adults living below 200% of the federal poverty level (FPL).

SOURCE: National Center for Health Statistics, National Health Interview Survey. See Sources and Definitions, National Health Interview Survey (NHIS) and Health, United States, 2020–2021 Table UnmtNd.
- In 2019, 18.6% of adults aged 18–64 did not receive needed dental care due to cost in the past 12 months.
- The percentage of adults who did not receive needed dental care due to cost was highest for adults living below 100% of FPL (30.7%) and at 100%–199% of FPL (30.6%), followed by those living at 200%–399% of FPL (20.3%) and then those living at 400% or more of FPL (8.2%).
Download the data
Delay or nonreceipt of needed medical care, nonreceipt of needed prescription drugs, and nonreceipt of needed dental care during the past 12 months due to cost, by selected characteristics: United States, selected years 1997–2019
SOURCE: National Center for Health Statistics, National Health Interview Survey.
- Delay or nonreceipt of needed medical care: Based on questions about whether there was any time during the past 12 months when the respondent needed medical care but delayed or did not get it because of the cost. See Sources and Definitions, Unmet need.
- Hispanic origin: People of Hispanic origin may be of any race. See Sources and Definitions, Hispanic origin.
- Nonreceipt of needed dental care: Based on questions about whether there was any time during the past 12 months when the respondent needed dental care but did not get it because of the cost. Estimates are for people aged 2 years and over. See Sources and Definitions, Unmet need.
- Nonreceipt of needed prescription drugs: Based on questions about whether there was any time during the past 12 months when the respondent needed prescription medicine but did not get it because of the cost. See Sources and Definitions, Unmet need.
- Poverty level: Based on family income, size, and composition using U.S. Census Bureau poverty thresholds. Missing family income data are imputed. See Sources and Definitions, Family income; Poverty.
- Race: Estimates are presented according to the 1997 Office of Management and Budget’s “Revisions to the Standards for the Classification of Federal Data on Race and Ethnicity” and are for people who reported only one racial group. See Sources and Definitions, Race.
