Hospitalization
The content on this page was last updated in June 2023. More recent estimates and visualizations may be available from the NCHS Data Query System.
Hospitals and emergency departments are essential sources of care for acute, chronic, and emergency conditions. Hospitalization is one of the most expensive types of health care use, resulting in an average adjusted cost of $14,101 per inpatient stay at community hospitals in 2019 (1). The most frequent diagnoses for hospitalizations are septicemia, heart failure, osteoarthritis, pneumonia, and diabetes mellitus (2).
Key Findings
Hospital stays

The age-adjusted percentage of people aged 1–64 with a hospital stay in the past year decreased from 5.9% in 2009 to 5.1% in 2014 and then did not change significantly through 2018. In 2019, the age-adjusted percentage of people aged 1–64 with a hospital visit in the past year was 5.9%. See Featured Charts for additional analysis and Notes for more information about analyzing trends using NHIS data.
SOURCE: National Center for Health Statistics, National Health Interview Survey. See Sources and Definitions, National Health Interview Survey (NHIS) and Health, United States, 2020–2021 Table HospStay.
Emergency department (ED) visits

The age-adjusted percentage of adults aged 18 and over with one or more ED visits in the past year decreased from 21.4% in 2009 to 18.6% in 2014 and then increased to 21.3% in 2018. In 2019, 21.7% of adults had one or more ED visits in the past year. See Featured Charts for additional analysis and Notes for more information about analyzing trends using NHIS data.
SOURCE: National Center for Health Statistics, National Health Interview Survey. See Sources and Definitions, National Health Interview Survey (NHIS) and Health, United States, 2020–2021 Table EdAd.
Hospital beds
The number of community hospital beds per 1,000 resident population in the United States decreased from 2.6 in 2009 to 2.4 in 2019.
SOURCE: American Hospital Association, Annual Survey of Hospitals. (Copyright 2009 and 2019 American Hospital Association. Reprinted with permission. All rights reserved.) . See Sources and Definitions, National Health Interview Survey (NHIS) and Health, United States, 2020–2021 Table BedComSt.
In 2019, people aged 1–64 years living below 100% of the federal poverty level (FPL) were the most likely to have a hospital stay in the past year compared with those living at higher income levels.
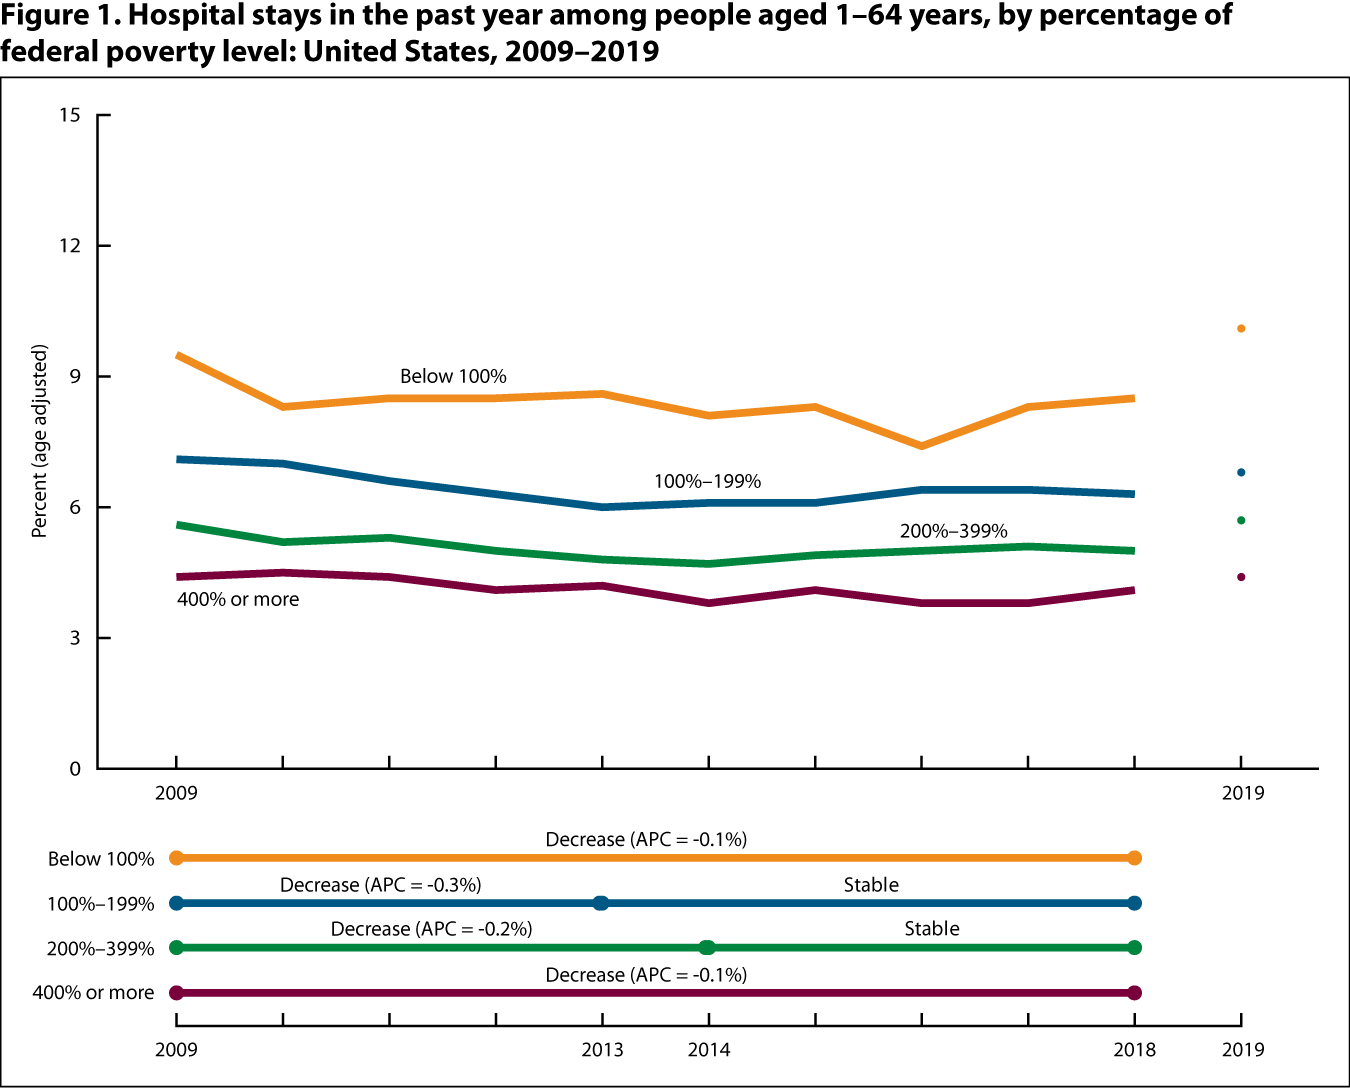
NOTES: APC is annual percent change. “Stable” refers to no statistically significant trend during the period.
SOURCE: National Center for Health Statistics, National Health Interview Survey. See Sources and Definitions, National Health Interview Survey (NHIS) and Health, United States, 2020–2021 Table HospStay.
- From 2009 to 2018, the age-adjusted percentage of people aged 1–64 with a hospital stay in the past year decreased for those living below 100% and those living at 400% or more of FPL.
- From 2009 to 2018, the age-adjusted percentage of people aged 1–64 with a hospital stay in the past year decreased in 2013 and 2014, respectively, for people living at 100%–199% and 200%–399% of FPL and then did not change significantly through 2018.
- In 2019, people aged 1–64 living below 100% of FPL (10.1%, age adjusted) were the most likely to have a hospital stay in the past year, followed by those living at 100%–199% (6.8%, age adjusted) and 200%–399% (5.7%, age adjusted) of FPL. People living at 400% or more of FPL were the least likely to have a hospital stay in the past year (4.4%, age adjusted).
In 2019, adults living below 100% of FPL were the most likely to have an ED visit in the past year compared with those living at higher income levels.
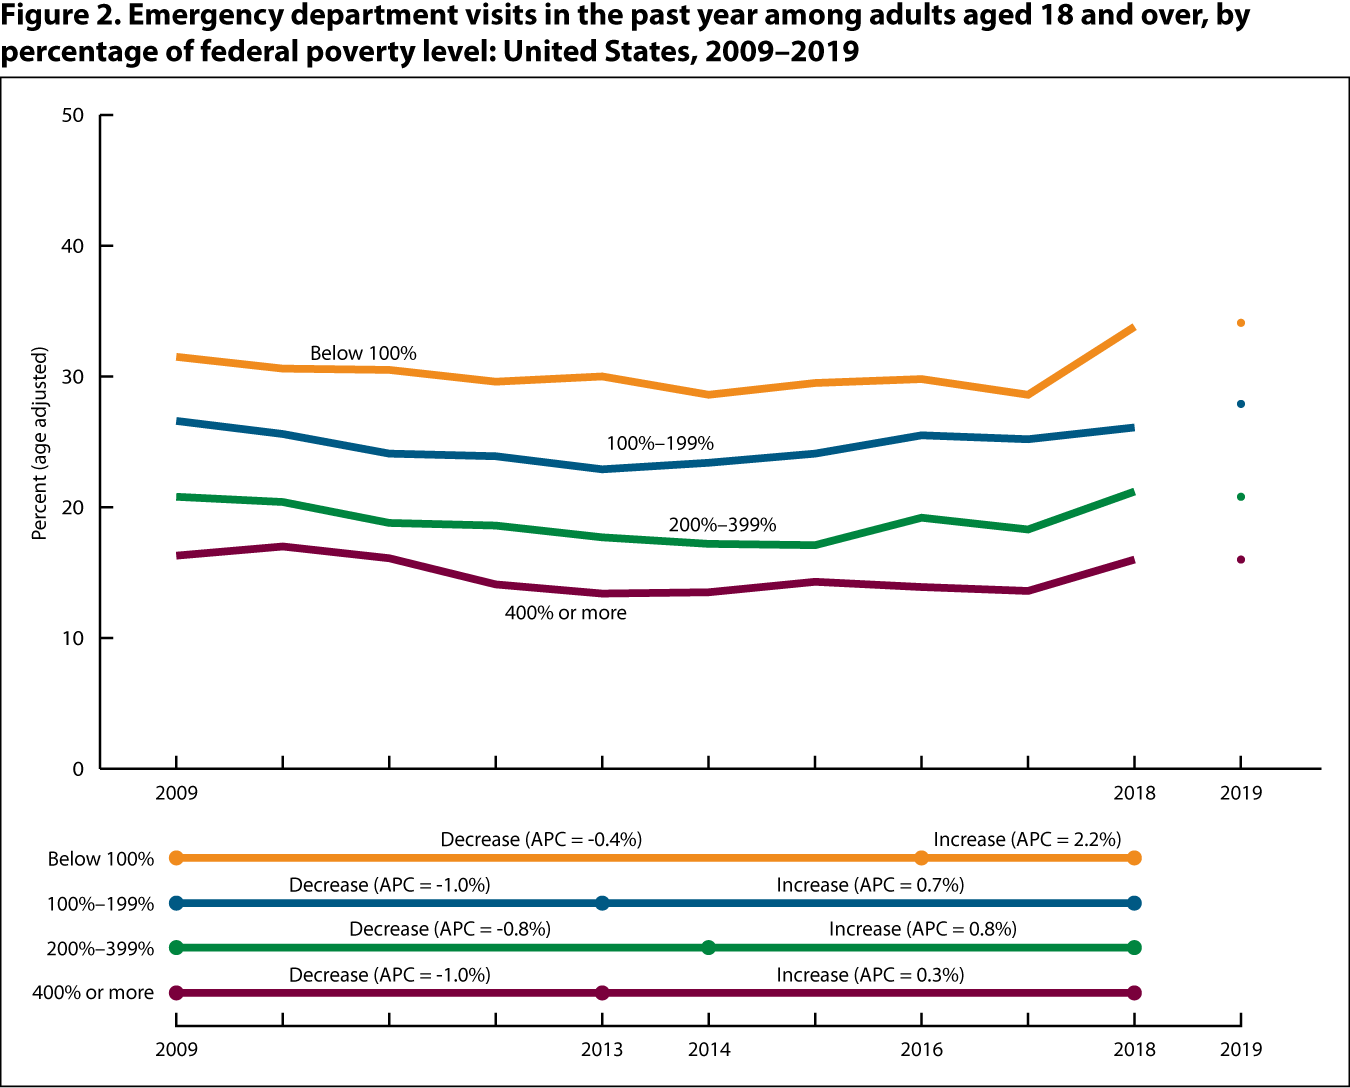
NOTE: APC is annual percent change.
SOURCE: National Center for Health Statistics, National Health Interview Survey. See Sources and Definitions, National Health Interview Survey (NHIS) and Health, United States, 2020–2021 Table EdAd.
- From 2009 to 2018, the age-adjusted percentage of adults with one or more ED visits in the past year decreased initially and then increased through 2018 for those living at each tier of FPL.
- In 2019, adults living below 100% of FPL were the most likely to have an ED visit in the past year (34.1%, age adjusted), followed by those living at 100%–199% (27.9%, age adjusted) and 200%–399% (20.8%, age adjusted) of FPL. Adults living at 400% or more of FPL were the least likely to have an ED visit in the past year (16.0%, age adjusted).
Community hospital beds, by state: United States, selected years 1980–2020
SOURCE: American Hospital Association, Annual Survey of Hospitals.
Hospital admission, average length of stay, outpatient visits, and outpatient surgery, by type of ownership and size of hospital: United States, selected years 1975–2020
SOURCE: American Hospital Association, Annual Survey of Hospitals.
People with hospital stays in the past year, by selected characteristics: United States, selected years 1997–2019
SOURCE: National Center for Health Statistics, National Health Interview Survey.
Emergency department visits within the past 12 months among children under age 18 years, by selected characteristics: United States, selected years 1997–2019
SOURCE: National Center for Health Statistics, National Health Interview Survey.
Emergency department visits within the past 12 months among adults aged 18 and over, by selected characteristics: United States, selected years 1997–2019
SOURCE: National Center for Health Statistics, National Health Interview Survey.
Visits to physician offices and hospital emergency departments, by age, sex, and race: United States, selected years 2000–2018
SOURCE: National Center for Health Statistics, National Ambulatory Medical Care Survey and National Hospital Ambulatory Medical Care Survey.
- Community hospital: According to AHA, community hospitals include all nonfederal, short-term general and special hospitals whose facilities and services are available to the public. See Sources and Definitions, Hospital.
- Emergency department visit: See Sources and Definitions, Emergency department or emergency room visit.
- Hospital stays: Based on a question about whether respondents or their children had any overnight hospital stays in the past year, excluding overnight stays in the emergency room. See Sources and Definitions, Hospital utilization.
- Poverty level: Based on family income, size, and composition using U.S. Census Bureau poverty thresholds. Missing family income data are imputed. See Sources and Definitions, Family income; Poverty.
- American Hospital Association. Table 1. Historical trends in utilization, personnel, and finances for selected years from 1946 through 2019. In: AHA hospital statistics: 2021 edition. Chicago, IL. Health Forum Publishing Company. 2–7. 2021.
- McDermott KW, Roemer M. Most frequent principal diagnoses for inpatient stays in U.S. Hospitals, 2018: Statistical Brief, no 277. In: Healthcare Cost and Utilization Project (HCUP) Statistical Briefs. Rockville, MD: Agency for Healthcare Research and Quality. 2021.