
Human Immunodeficiency Virus (HIV)
The content on this page was last updated in June 2023. More recent estimates and visualizations may be available from the NCHS Data Query System.
Key Findings
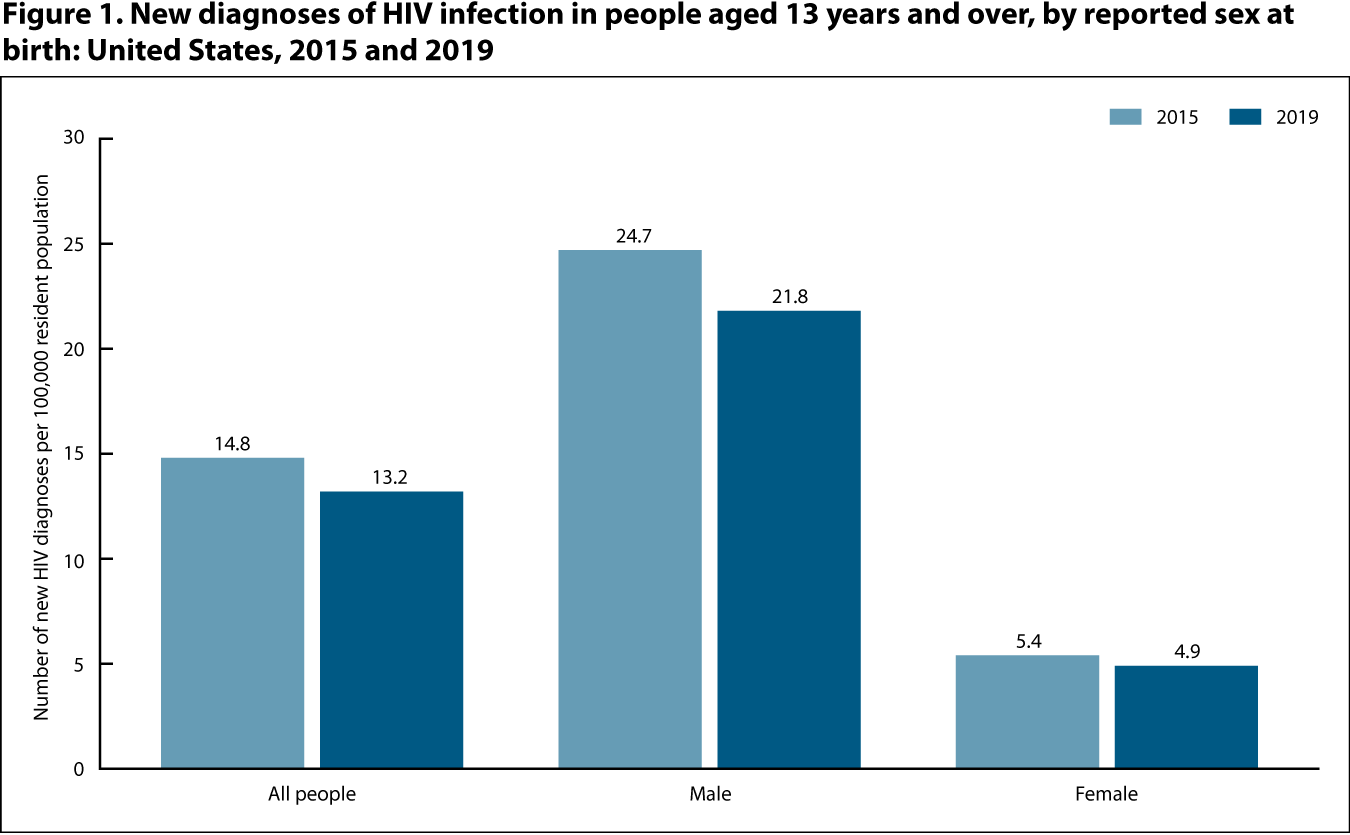
The number of new HIV diagnoses per 100,000 population aged 13 years and over decreased 10.8% from 14.8 in 2015 to 13.2 in 2019. In 2019, 36,337 people aged 13 years and over were newly diagnosed with HIV infection in the United States. See Featured Charts for additional analysis.
SOURCE: Centers for Disease Control and Prevention, National Center for HIV, Viral Hepatitis, STD, and TB Prevention. See Sources and Definitions, National HIV Surveillance System (NHSS) Health, United States, 2020–2021 Table HIV.
In 2019, among those aged 13 years and over, males were four times more likely to be diagnosed with HIV infection than females.
SOURCE: National Center for HIV, Viral Hepatitis, STD, and TB Prevention. See Sources and Definitions, National HIV Surveillance System (NHSS) and Health, United States, 2020–2021 Table HIV.
- Among males aged 13 years and over, the number of new HIV diagnoses per 100,000 population was 11.7% lower in 2019 (21.8) than 2015 (24.7).
- Among females aged 13 years and over, the number of new HIV diagnoses per 100,000 population was 9.3% lower in 2019 (4.9) than 2015 (5.4).
- In both 2015 and 2019, the rate of new HIV diagnoses was more than four times higher for males than for females.
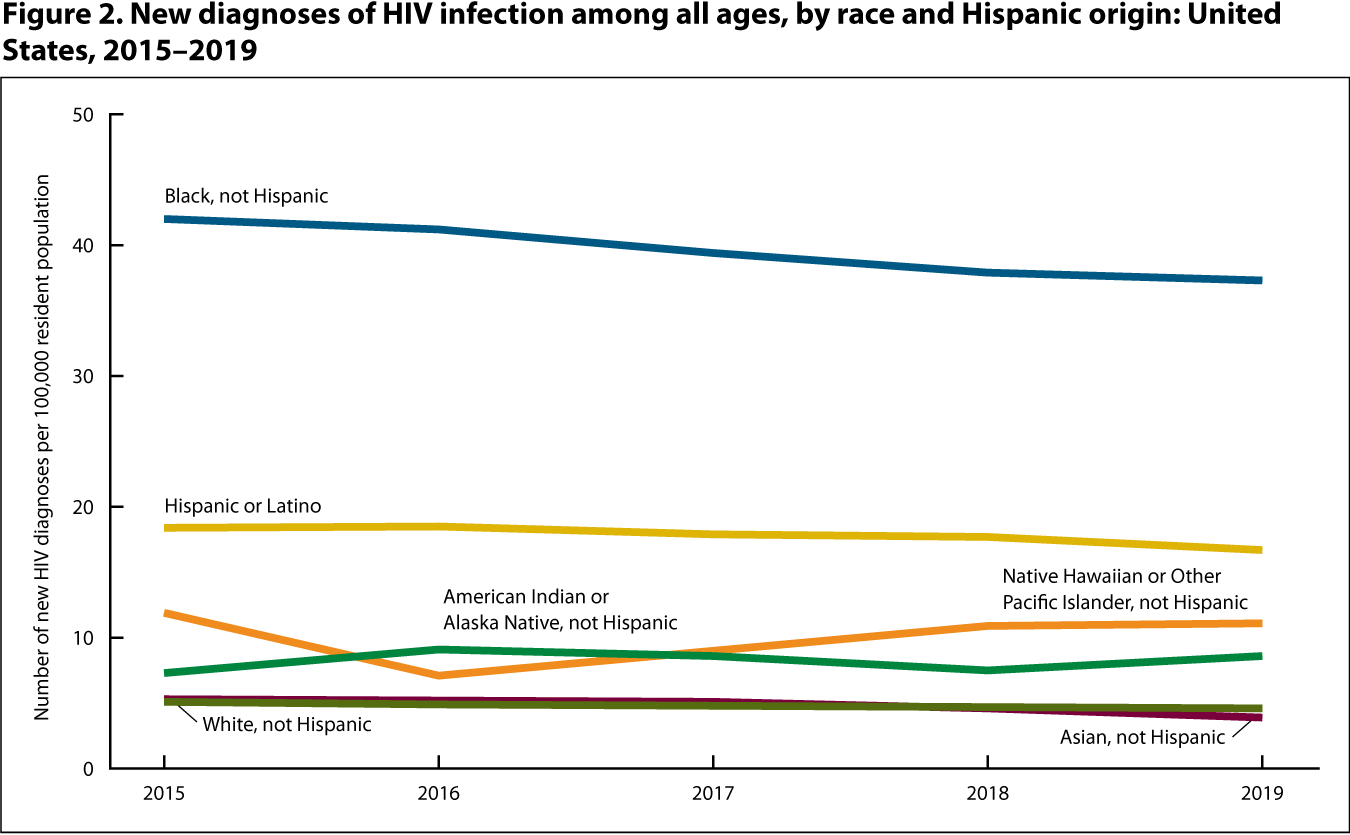
From 2015 to 2019, HIV diagnosis rates were higher for non-Hispanic Black people than any other race and Hispanic-origin group.
SOURCE: National Center for HIV, Viral Hepatitis, STD, and TB Prevention. See Sources and Definitions, National HIV Surveillance System (NHSS) and Health, United States, 2020–2021 Table HIV.
- The rate of new HIV infection diagnoses in non-Hispanic American Indian or Alaska Native people was higher in 2019 than in 2015, while the rates for all other race and Hispanic-origin groups were lower in 2019 than in 2015.
- In 2019, the rate of new HIV infection diagnoses per 100,000 population was highest in non-Hispanic Black people (37.3), followed by Hispanic (16.7), non-Hispanic Native Hawaiian or Other Pacific Islander (11.1), non-Hispanic American Indian or Alaska Native (8.6), and non-Hispanic White (4.6) people. The lowest rate of diagnoses was among non-Hispanic Asian people (3.9).
Download the data
Human immunodeficiency virus (HIV) diagnoses, by year of diagnosis and selected characteristics: United States, 2015–2019
SOURCE: Centers for Disease Control and Prevention, National Center for HIV, Viral Hepatitis, STD, and TP Prevention.
Selected nationally notifiable disease rates and number of new cases: United States, selected years 1950–2019
SOURCE: Centers for Disease Control and Prevention, National Notifiable Diseases Surveillance System and Centers for Disease Control and Prevention, National Center for HIV/AIDS, Viral Hepatitis, STD, and TB Prevention.
- Hispanic origin: People of Hispanic origin may be of any race. See Sources and Definitions, Hispanic origin.
- Human immunodeficiency virus (HIV) infection: A virus that attacks the body’s immune system. A surveillance case for HIV requires two laboratory-confirmed tests. See Sources and Definitions, Human immunodeficiency virus (HIV) disease.
- Race: Estimates are presented according to the 1997 Office of Management and Budget’s “Revisions to the Standards for the Classification of Federal Data on Race and Ethnicity” and are for people who reported only one racial group. See Sources and Definitions, Race.
- U.S. Department of Health and Human Services. Ending the HIV epidemic: About ending the HIV epidemic in the U.S.: Overview. 2021. Available from: https://www.hiv.gov/federal-response/ending-the-hiv-epidemic/overview.
- Centers for Disease Control and Prevention. Diagnoses of HIV infection in the United States and dependent areas, 2019 HIV Surveillance Report 2021. Available from: http://www.cdc.gov/hiv/library/reports/hiv-surveillance.html.