Health Insurance Coverage
The content on this page was last updated in June 2023. More recent estimates and visualizations may be available from the NCHS Data Query System.
Health insurance is a key measure of health care access. Those with health insurance are more likely to have access to health care, a usual source of care, and a recent health care visit than those who are uninsured (1–3).
Key Findings
Uninsured
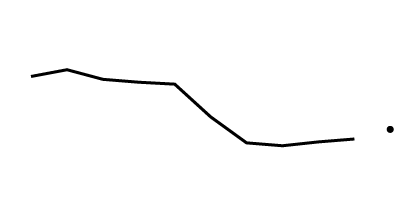
The percentage of people under age 65 who were uninsured decreased from 17.5% in 2009 to 11.0% in 2018. In 2019, 12.0% of people under age 65 were uninsured. See Featured Charts for additional analysis and Notes for more information about analyzing trends using NHIS data.
SOURCE: National Center for Health Statistics, National Health Interview Survey. See Sources and Definitions, National Health Interview Survey (NHIS) and Health, United States, 2020–2021 Table HINone.
Medicaid
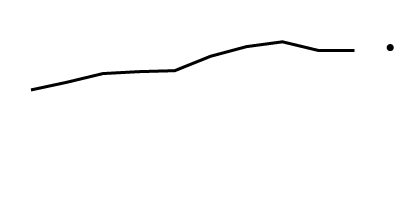
The percentage of people under age 65 who had Medicaid increased from 16.1% in 2009 to 21.1% in 2016 and then decreased to 20.2% in 2018. In 2019, 20.5% of people under age 65 had Medicaid.
SOURCE: National Center for Health Statistics, National Health Interview Survey. See Sources and Definitions, National Health Interview Survey (NHIS) and Health, United States, 2020–2021 Table HIMcaid.
Private health insurance coverage
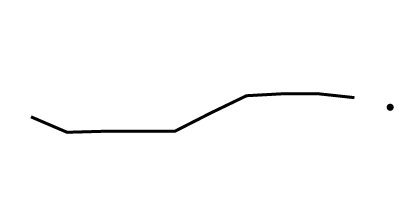
The percentage of people under age 65 who had private health insurance coverage decreased from 63.3% in 2009 to 61.8% in 2011 and then increased to 65.3% in 2018. In 2019, 64.3% of people under age 65 were covered by private health insurance.
SOURCE: National Center for Health Statistics, National Health Interview Survey. See Sources and Definitions, National Health Interview Survey (NHIS) and Health, United States, 2020–2021 Table HIPriv.
Among those under age 65, adults aged 18–44 were the most likely to be uninsured during 2009–2019.
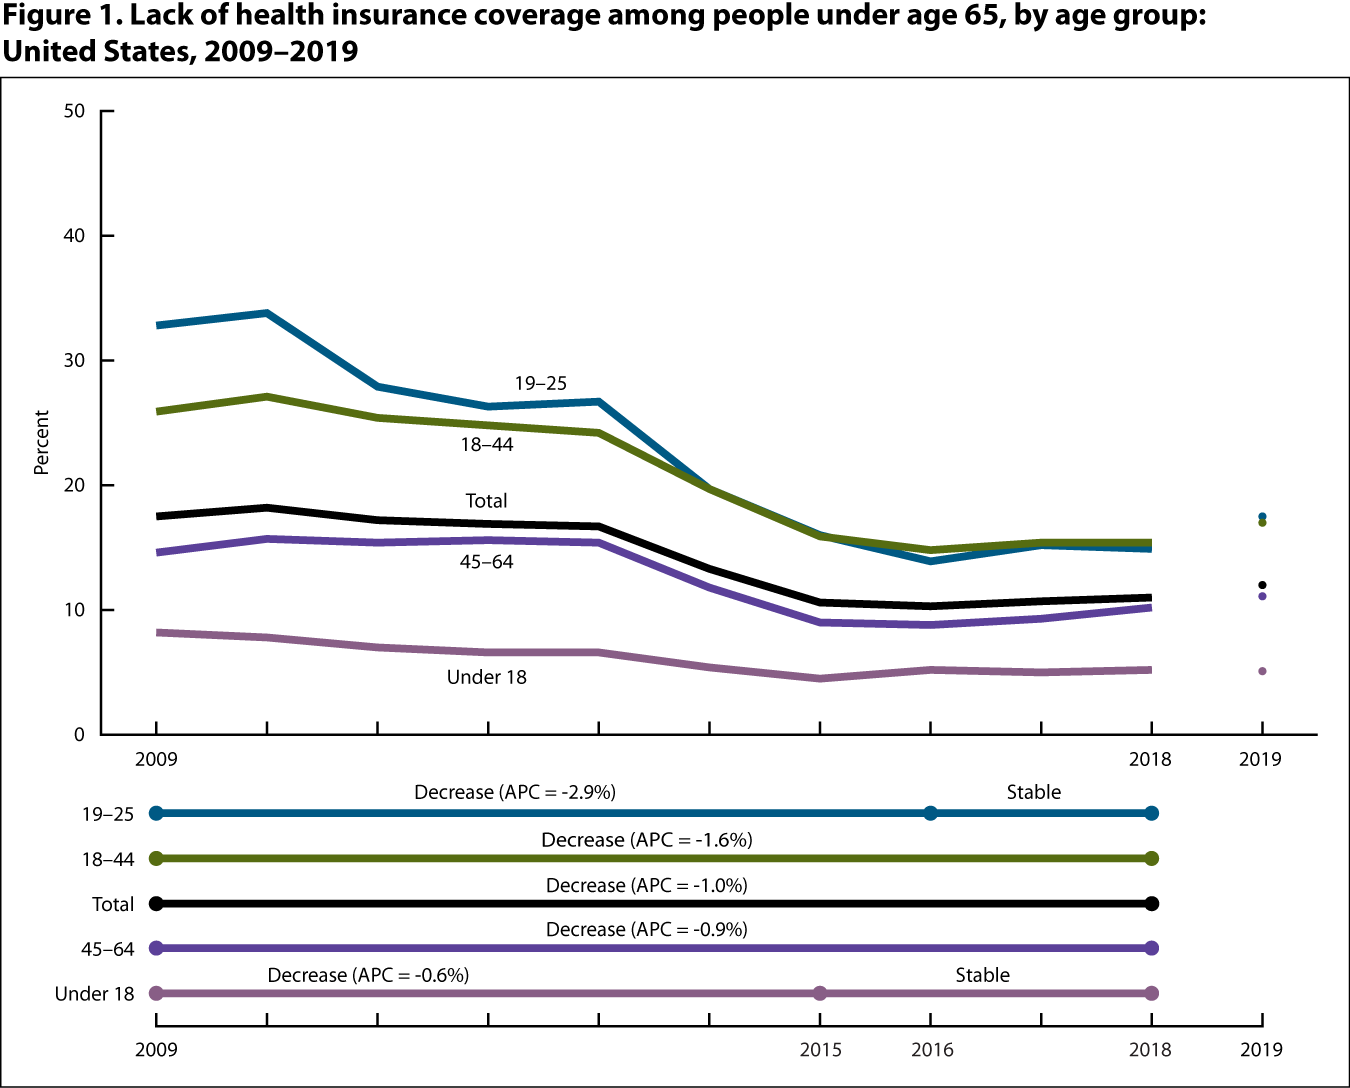
NOTES: APC is annual percent change. “Stable” refers to no statistically significant trend during the period.
SOURCE: National Center for Health Statistics, National Health Interview Survey. See Sources and Definitions, National Health Interview Survey (NHIS) and Health, United States, 2020–2021 Table HINone.
- Among children and adolescents under age 18 years, the percentage of those uninsured decreased from 8.2% in 2009 to 4.5% in 2015 and then was stable through 2018 (5.2%).
- From 2009 to 2018, the percentage of those uninsured decreased among adults aged 18–44 (from 25.9% to 15.4%) and 45–64 (from 14.6% to 10.2%).
- Among adults aged 19–25, the percentage of those uninsured decreased from 32.8% in 2009 to 13.9% in 2016 and then did not change significantly through 2018 (14.9%).
- In 2019, adults aged 18–44 were the most likely to be uninsured (17.0%), compared with adults aged 45–64 (11.1%) and children under age 18 years (5.1%). Among adults aged 19–25, 17.5% were uninsured in 2019.
During 2009–2019, Hispanic people under age 65 were the most likely to be uninsured compared with people in other race and Hispanic-origin groups.
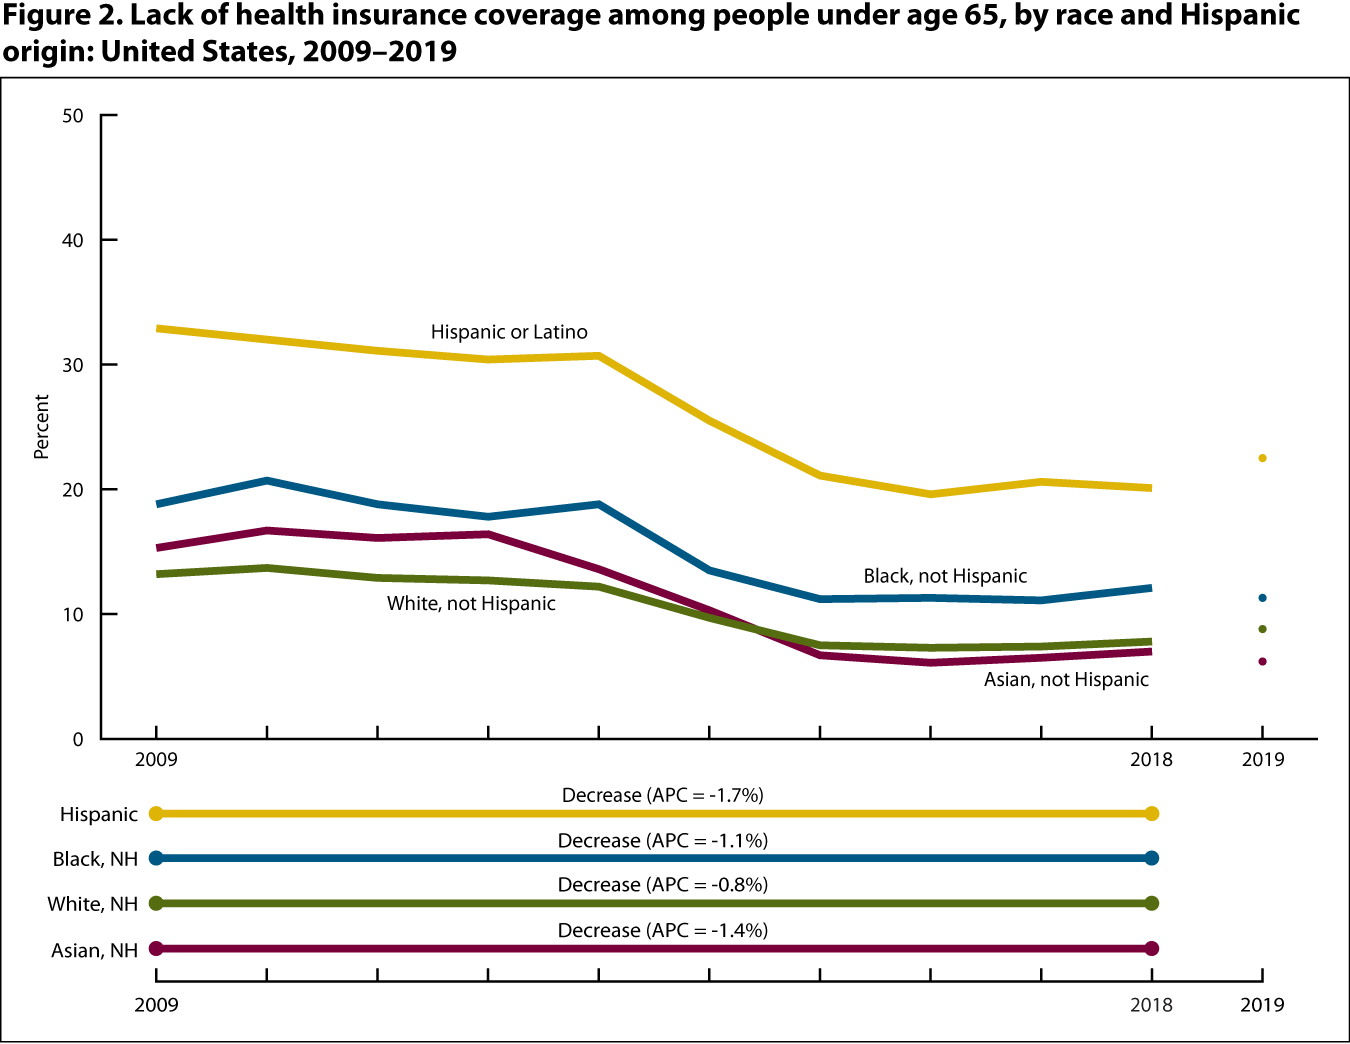
NOTES: NH is not Hispanic. APC is annual percent change.
SOURCE: National Center for Health Statistics, National Health Interview Survey. See Sources and Definitions, National Health Interview Survey (NHIS) and Health, United States, 2020–2021 Table HINone.
- From 2009 to 2018, the percentage of people under age 65 who were uninsured decreased at varying rates for Hispanic (from 32.9% to 20.1%), non-Hispanic Black (from 18.8% to 12.1%), non-Hispanic White (from 13.2% to 7.8%), and non-Hispanic Asian (from 15.3% to 7.0%) people.
- Throughout the period, Hispanic people were the most likely to be uninsured compared with the other race and Hispanic-origin groups.
- In 2019, the percentage of people under age 65 who were uninsured was highest among Hispanic people (22.5%), followed by non-Hispanic Black (11.3%), non-Hispanic White (8.8%), and non-Hispanic Asian (6.2%) people.
Download the data
Private health insurance coverage among people under age 65, by selected characteristics: United States, selected years 1984–2019
SOURCE: National Center for Health Statistics, National Health Interview Survey.
Medicaid coverage among people under age 65, by selected characteristics: United States, selected years 1984–2019
SOURCE: National Center for Health Statistics, National Health Interview Survey.
- Hispanic origin: People of Hispanic origin may be of any race. See Sources and Definitions, Hispanic origin.
- Medicaid: Includes people who had any of the following coverage: Medicaid, state-sponsored health plan, or Children’s Health Insurance Program. See Sources and Definitions, Health insurance coverage; Medicaid.
- Private health insurance: Includes people with insurance obtained through a workplace, union, professional association, or individual purchase. Also includes adult children covered by their parents’ private insurance. See Sources and Definitions, Health insurance coverage.
- Race: Estimates are presented according to the 1997 Office of Management and Budget’s “Revisions to the Standards for the Classification of Federal Data on Race and Ethnicity” and are for people who reported only one racial group. See Sources and Definitions, Race.
- Uninsured: Includes people not covered by the following plans: private health insurance, Medicaid, Children’s Health Insurance Program, state-sponsored or other government-sponsored health plans, Medicare, or military plans. People with only Indian Health Service coverage are considered to have no health insurance coverage. See Sources and Definitions, Health insurance coverage; Uninsured.
- Dubay L, Kenney GM. Health care access and use among low-income children: Who fares best? Health Aff (Millwood) 20(1):112–21. 2001.
- Larson K, Cull WL, Racine AD, Olson LM. Trends in access to health care services for US children: 2000–2014. Pediatrics 138(6):e20162176. 2016.
- Sommers BD, Gawande AA, Baicker K. Health insurance coverage and health—what the recent evidence tells us. N Engl J Med 377(6):586–93. 2017.
- Patient Protection and Affordable Care Act. Pub L No 111–48, 124 Stat 119. 2010.

