NCHS Nutrition Data
NCHS Fact Sheet, January 2019
PDF Version (310 KB)
About NCHS
The National Center for Health Statistics (NCHS) is the nation’s principal health statistics agency, providing data to identify and address health issues. NCHS compiles statistical information to help guide public health and health policy decisions.
Collaborating with other public and private health partners, NCHS uses a variety of data collection mechanisms to obtain accurate information from multiple sources. This process provides a broad perspective on the population’s health, influences on health, and health outcomes.
Nutrition Data
For over 45 years, the National Health and Nutrition Examination Survey (NHANES), a major program of NCHS, has collected comprehensive data on health and nutrition, including dietary intakes. NHANES is an ongoing, nationally representative survey of the U.S. population that combines interviews with standardized physical examinations and laboratory tests conducted in a mobile examination center (MEC). NHANES can directly measure health conditions and provide reliable information on health and disease.
NHANES dietary data are collected via 24-hour dietary recall. At the MEC, participants provide details on food and beverages consumed on the preceding day. A second recall is obtained over the telephone 3–10 days later. Data on dietary supplement use during the past month are collected at the household interview and subsequently during the 24-hour recalls.
Federal agencies, researchers, health care providers, and policymakers use these data to assess and monitor the nutrition intake and status of the U.S. population as well as to inform nutrition policy and programs.
Overweight and weight control behaviors
NHANES data (height, weight, sex, and age) allow researchers to estimate and track prevalence of overweight and obesity, as well as
describe weight-loss behaviors in the United States.
Obesity among adults and youth
- During 2015–2016, 18.5% (13.7 million) of U.S. youth aged 2–19 years and 39.8% (93.3 million) of adults had obesity. The age-adjusted prevalence of obesity increased among adults from 33.7% in 2007–2008 to 39.6% in 2015–2016. The prevalence of obesity did not change significantly among youth (16.8% and 18.5%) over this period.
Weight-loss practices among adults
- During 2013–2016, nearly one-half of U.S. adults (49.1%) tried to lose weight in the last 12 months. A greater percentage of women (56.4%) than men (41.7%) tried to lose weight. The most commonly reported methods to lose weight were exercising (62.9%) and eating less (62.9%), followed by consuming more fruit, vegetables, or salads (50.4%).
Dietary intake and behavior
NHANES data on dietary intake (food, beverages, and dietary supplements) are used to describe meal patterns and food and nutrient intakes among the U.S. population, and among specific age, sex, and race-ethnicity groups. Select recent findings based on these data are described below.
Meal patterns of adults and youth
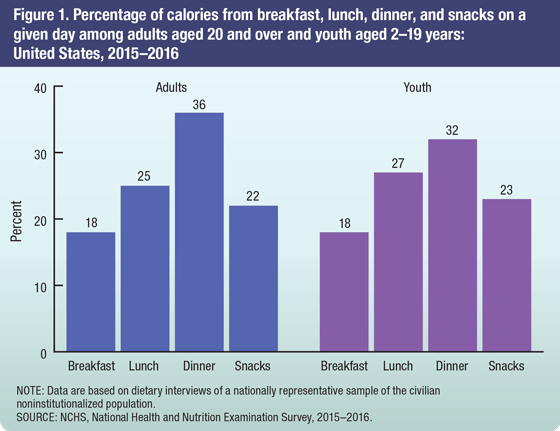
Breakfast, lunch, and dinner are traditionally considered the three main meals of the day. NHANES data for 2015–2016 show that breakfast was the smallest and dinner the largest meal of the day in terms of their contribution to total calories consumed on a given day, for both adults and youth.
▪ Snacks contributed almost one-quarter of total calories consumed by Americans (22% for adults and 23% for children).

Seafood consumption among adults and youth
The Dietary Guidelines for Americans recommend consuming two servings of seafood, including fish and shellfish, per week. Consuming seafood is associated with various benefits for brain and heart health as well as reduced inflammation.
▪ During 2013–2016, 20.1% of adults and 5.6% of youth consumed seafood at least two times per week. More non-Hispanic Asian adults and youth consumed seafood compared with other groups (non-Hispanic white, non-Hispanic black, and Hispanic). A decreasing trend between 2005–2006 and 2015–2016 was noted for both adults and youth consuming seafood at least two times per
week, from 26.0% to 19.2% among adults and from 8.3% to 5.4% among youth.

Fast food consumption among adults
Fast food is a part of the American diet and has been associated with high caloric intake and poor diet quality. During the NHANES dietary interview, participants also report where they obtained each food and beverage item they consumed in the 24-hour recall period. Fast food consumption was defined based on food source reported as “restaurant fast food/
pizza.”
- During 2013–2016, approximately 37% of adults consumed fast food on a given day.
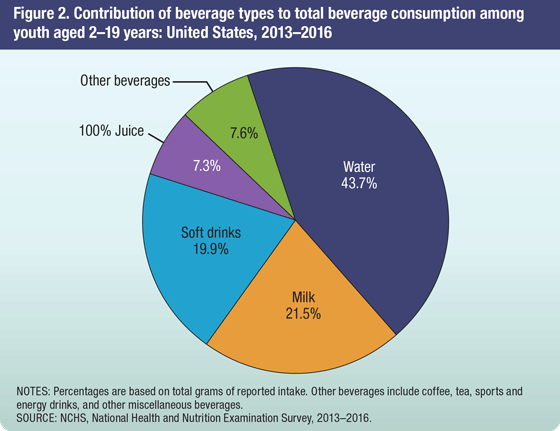
Beverages are an important source of hydration and affect total caloric intake. The Dietary Guidelines for Americans recommend that water, fat-free and low-fat milk, and 100% juice be the primary beverages consumed.
- Dietary recall data from NHANES 2013–2016 show that water (43.7%) and milk (21.5%) accounted for close to two-thirds of total beverage intake by youth aged 2–19 years. Soft drinks accounted for about one-fifth (19.9%), followed by 100% juice (7.3%) and other beverages (7.6%).
For more information about NCHS, visit https://www.cdc.gov/nchs.
For more information about NHANES, visit https://www.cdc.gov/nchs/nhanes.htm.