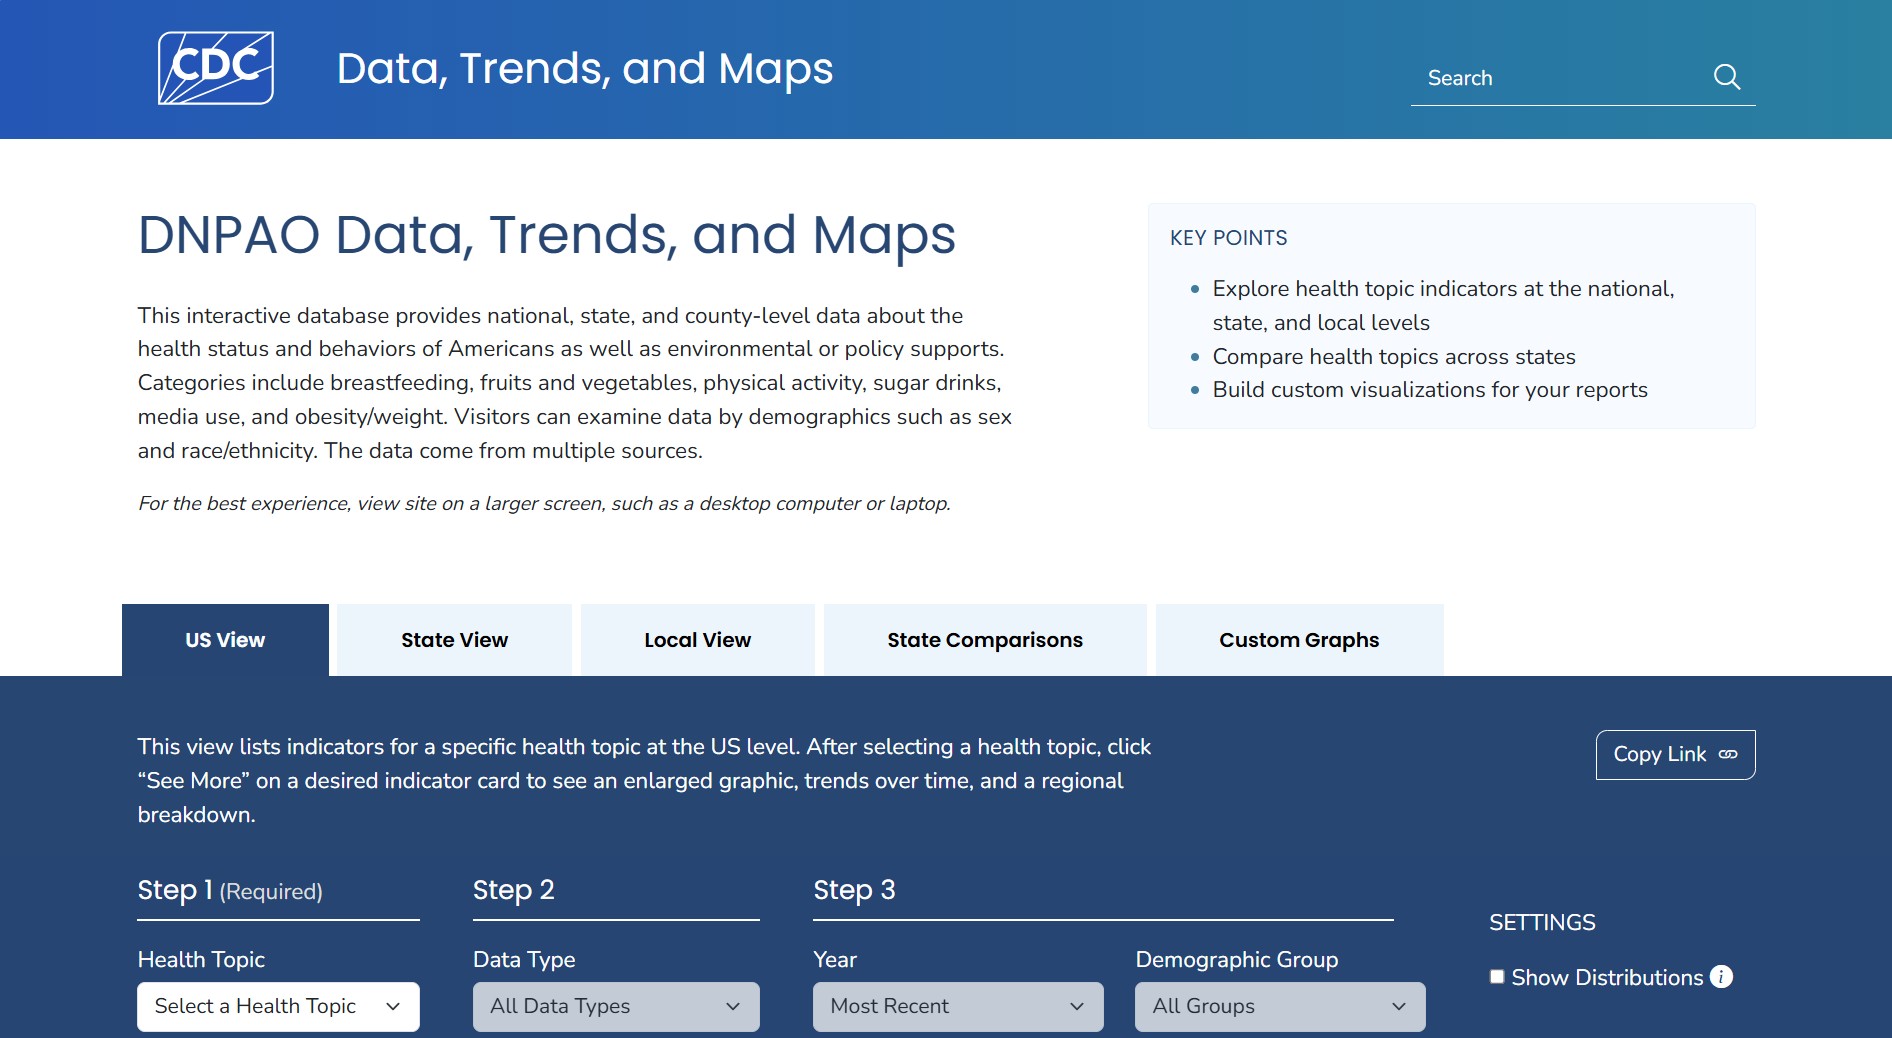
Using this Site: Data, Trends and Maps

This database from CDC’s Division of Nutrition, Physical Activity and Obesity allows you to search for health indicators related to nutrition, physical activity, and obesity. For example, you can look up the prevalence of obesity, the percentage of adults who meet physical activity guidelines, or fruit and vegetable consumption. You can view corresponding data nationally, for states, and for selected locations. In the tabs below, learn more about exploring the data:

  • By specific indicators.
  • For a specific location.
  • Via a comparison report that shows all indicators for several locations side by side.
  • With your own filtered dataset, customized visualizations, and downloaded data.

Explore by Indicator allows you to view data for a specific topic across all available locations. When available, you can use the VIEW BY-drop-down menu to view data by demographic characteristics. To begin, select a class and then topic from the respective drop-down lists, and click GO. By default, the system displays the data in map format. You can choose to view the data in chart or table format.

Viewing a Map
After selecting a category and topic, a color-coded map displays the data for one indicator. You can choose a different indicator by using the drop-down menu. A legend explaining the colors is displayed to the right of the map.


Screen capture of new Data, Trends, and Maps Explore by Topic page with callout boxes highlighting new features.  To view data, select a Category, Year, and click GO. Use the “Indicator” section to change the view.  Use “View By” section to change the year and view the data by demographic characteristics, if available.  Click on the “Gear Icon” to download the data being viewed in PDF or CSV format.  Click on the “Map, Chart, or Table” icon to change the view type.  Click a state on the map to view the data for the location. Select View all indicators for the location to see up to 8 indicators at one time for that specific location. The colors on the legend explain the colors on the map. Click the Legend Settings link to change the display.


Viewing a Chart
You can view data in a bar chart format by clicking the chart icon next to the map icon.


Screen capture of new Data, Trends, and Maps Viewing a Chart module  with callout boxes highlighting new features.  Hover mouse on a bar or CI line to view the data for the location. These lines represent the confidence intervals (CI).


Viewing Data in Table Format
You can view data in table format by clicking the table icon next to the chart icon.


Screen capture of new Data, Trends, and Maps Viewing Data ion Table Format  module


Footnotes/Notes/Data Source
The footnotes, notes, and data source section at the bottom of a panel provides more information for the content displayed in the panel. This section explains the symbols displayed in a panel, displays important notes about the data, and also lists the data source. To hide this section, click the hide footnotes link circled below, to display it again, click the show footnotes link.


Screen capture of new Data, Trends, and Maps Topic Indicator module. Highlight an option to hide footnotes.


Notes
The notes section displays more information for the data displayed on the page, such as how national estimates are calculated and additional information on inclusion criteria.


Screen capture of new Data, Trends, and Maps Data Source and Notes section. The Notes section displays more information for the data displayed on the page, such as how national estimates are calculated and additional information on inclusion criteria.


Suggested Citation
The suggested citation section provides citation information for the data displayed on the page.

Example:

Screen capture of new Data, Trends, and Maps Suggested Citation section. The Suggested Citation section provides citation information for the data displayed on the page.


Related Links
The related links section contains links to websites that are not part of Data, Trends, and Maps.

Example:

Screen capture of new Data, Trends, and Maps Related Links section. The Related Links section contains links to other sites on the Web. When you click these links, the system takes you to the related sites. These sites are not contained within the Data, Trends, and Maps Interactive Database.

Explore by Location allows you to select a location and view data for that location. You can select up to eight indicators. To view data, select a location, category, and year from the drop-down lists and click GO. The system displays the data in one to eight small panels. You can view one year of data or all available years, stratify data by demographic characteristics, and view data in graph or table format.

Screen capture of new Data, Trends, and Maps Explore Location page with callout boxes highlighting new features. Use the “Location, Category, and Tear” section to select options for viewing data.  Use the “Hide Footnotes” section to hide or show footnotes, view information about the data, export all data on the page to PDF, and view data for all locations.  Click the wheel icon to save the data in a panel in PDF format or export the data to a CSV file.  Click the table or chart icon to change the display type in a panel – chart or table.  Hover your mouse on a bar or data point to view more information.

Selecting Indicators to Display

By default, the system displays the first 8 indicators. The maximum number of indicators you can display on a page at one time is 8.

To change the indicators displayed:

1) Click the Select indicators to view link. The system displays the Select Indicators to View  pop-up window.

Screen capture of new Data, Trends, and Maps Select Indicators to View” module. The system displays the Select Indicators to View pop-up window.

2) Change the selected indicator(s).
Note: You cannot select more than 8 indicators.

Screen capture of new Data, Trends, and Maps “Select Indicators to View” module showing available options.


3) Click OK to keep your changes. The system displays data for the newly selected indicators on the Explore by Location page.


Footnotes, Notes, and Data Sources
The bottom of each panel provides more information for the content displayed in the panel. The data source and notes section at the bottom of the page displays important notes about the data and also lists the data source.

Suggested Citation
Citation information for the data displayed on the page.

Related Links
Links to websites that are not part of Data, Trends, and Maps.

Comparison Report allows you to compare all the available indicators for up to five locations. Start by clicking add/remove locations. You can return to this button to add or remove locations while creating your report.


Show options, add remove locations


Select up to five locations. National is selected by default. Deselect national if you do not want national data in your comparison. Click submit.


Select locations


The search report window allows you to you search for the report for key words such as fruit or child care. Click on show options to show or hide confidence intervals, sample sizes, and missing data rows.


Search report options


Click the plus sign next to each indicator to see data, or click expand all to see available data for all indicators. Click save as CSV to download the data.


View and save options


Click view definition to get additional information about how indicators were calculated. Click view all locations to get a US map for that indicator.


Indicator view options


Data Source and Global Footnotes
The bottom of the page provides more information for the content displayed in the panel. This section displays important notes about the data and also lists the data source.

Suggested Citation
Citation information for the data displayed on the page.

Related Links
Links to websites that are not part of Data, Trends, and Maps.

Need to work with data directly? Go to the Nutrition, Physical Activity, and Obesity: Data, Trends, and Maps Data Portal to create your own filtered dataset, customize visualizations, and download data.

Begin by selecting a dataset to view. In the example below, Nutrition, Physical Activity, and Obesity – Behavioral Risk Factor Surveillance System is selected.

Behavioral Risk Factor Surveillance System


Next, select either:

  • View the data to see a table of the data.
  • Visualize to create a visualization.
  • Export to download a csv or csv for Excel file.


View data options


To help you with this tool, see a series of videos about the basics about filtering data, creating maps, and creating charts.