Diagnoses of HIV Infection in the United States and Dependent Areas 2021: National Profile

Data presented in this report are based on case data reported to CDC through December 31, 2022, which allows for a 12-month reporting delay and assessment of diagnosis, death, and prevalence for the year 2021. The statements in this section, unless otherwise indicated, are based on 12 or more cases. All rates are per 100,000 population. The standard used for reporting trends in numbers and rates is an increase or a decrease of 5% or more based on the relative percentage change when comparing data for the year 2021 to data for the year 2017. The exceptions to this standard are where numbers are small (i.e., less than 12) or rates are based on small numbers.
Data for the year 2020 should be interpreted with caution due to the impact of the COVID-19 pandemic on access to HIV testing, care-related services, and case surveillance activities in state and local jurisdictions.
Deaths of persons with diagnosed HIV infection may be due to any cause (i.e., may or may not be related to HIV infection). Data for the year 2021 are preliminary and based on deaths reported to CDC as of December 2022.
When presenting rates by race/ethnicity, data are only provided for the United States (50 states and the District of Columbia) because denominator data are not available by race/ethnicity for all U.S. dependencies.
Important notes
- Please use caution when interpreting data for additional gender identity (AGI) persons, transgender men, American Indian/Alaska Native persons, and Native Hawaiian/other Pacific Islander persons as many percentages and/or rates are based on small numbers.
- For disparity measures, reference groups are based on the rate of the lowest group with more than five percent of cases.
- Please read all titles and footnotes carefully to ensure a complete understanding of the displayed data. See Technical Notes for information on definitions and data specifications. Please note that specific notes are highlighted with the magnifying glass icon in the text.


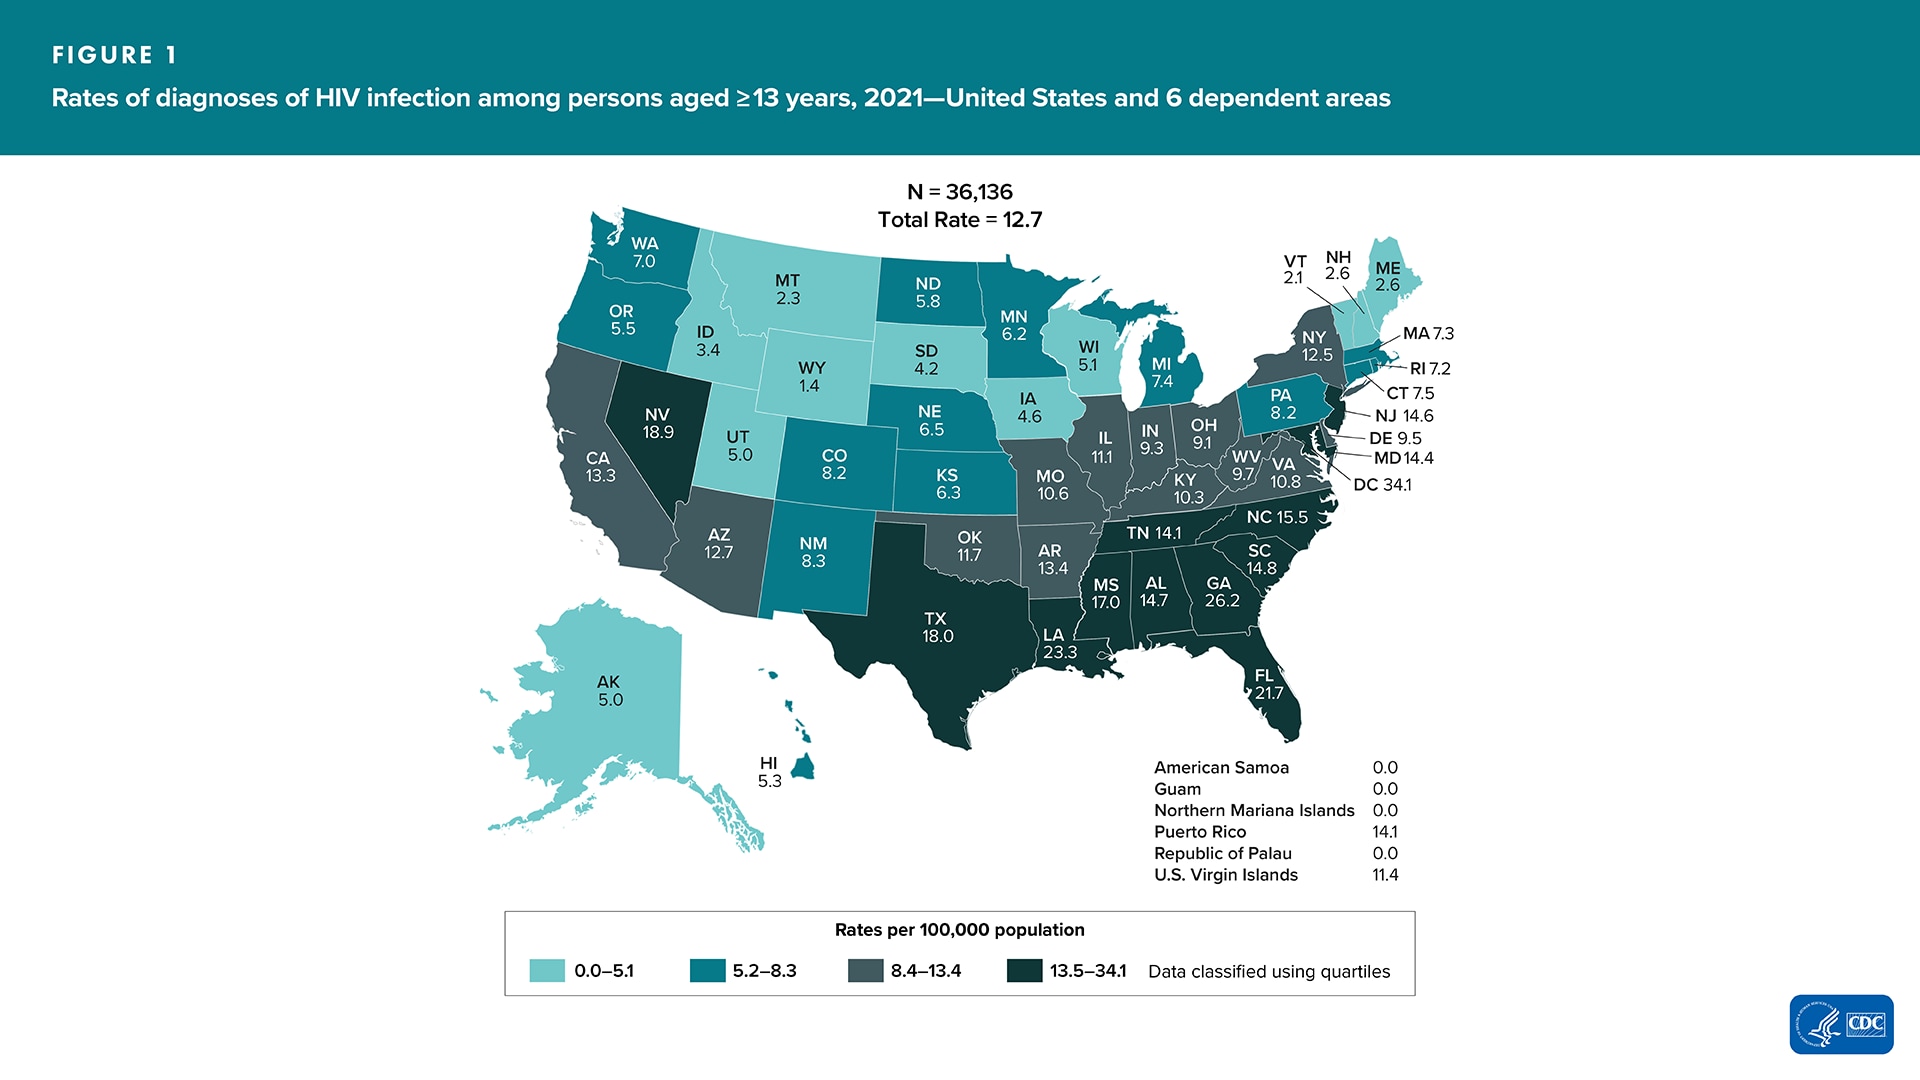
The annual number and rate of diagnoses of HIV infection in the United States and 6 dependent areas decreased 7% and 8%, respectively, in 2021, compared with 2017 (Table 1b). In 2021, there were 36,189 diagnoses of HIV infection (persons aged ≥ 13 years: 36,136) (Tables 1b and 3b). The overall HIV diagnosis rate was 10.8 (persons aged ≥ 13 years: 12.7) (Figure 1, Tables 1b and 3b).
Gender
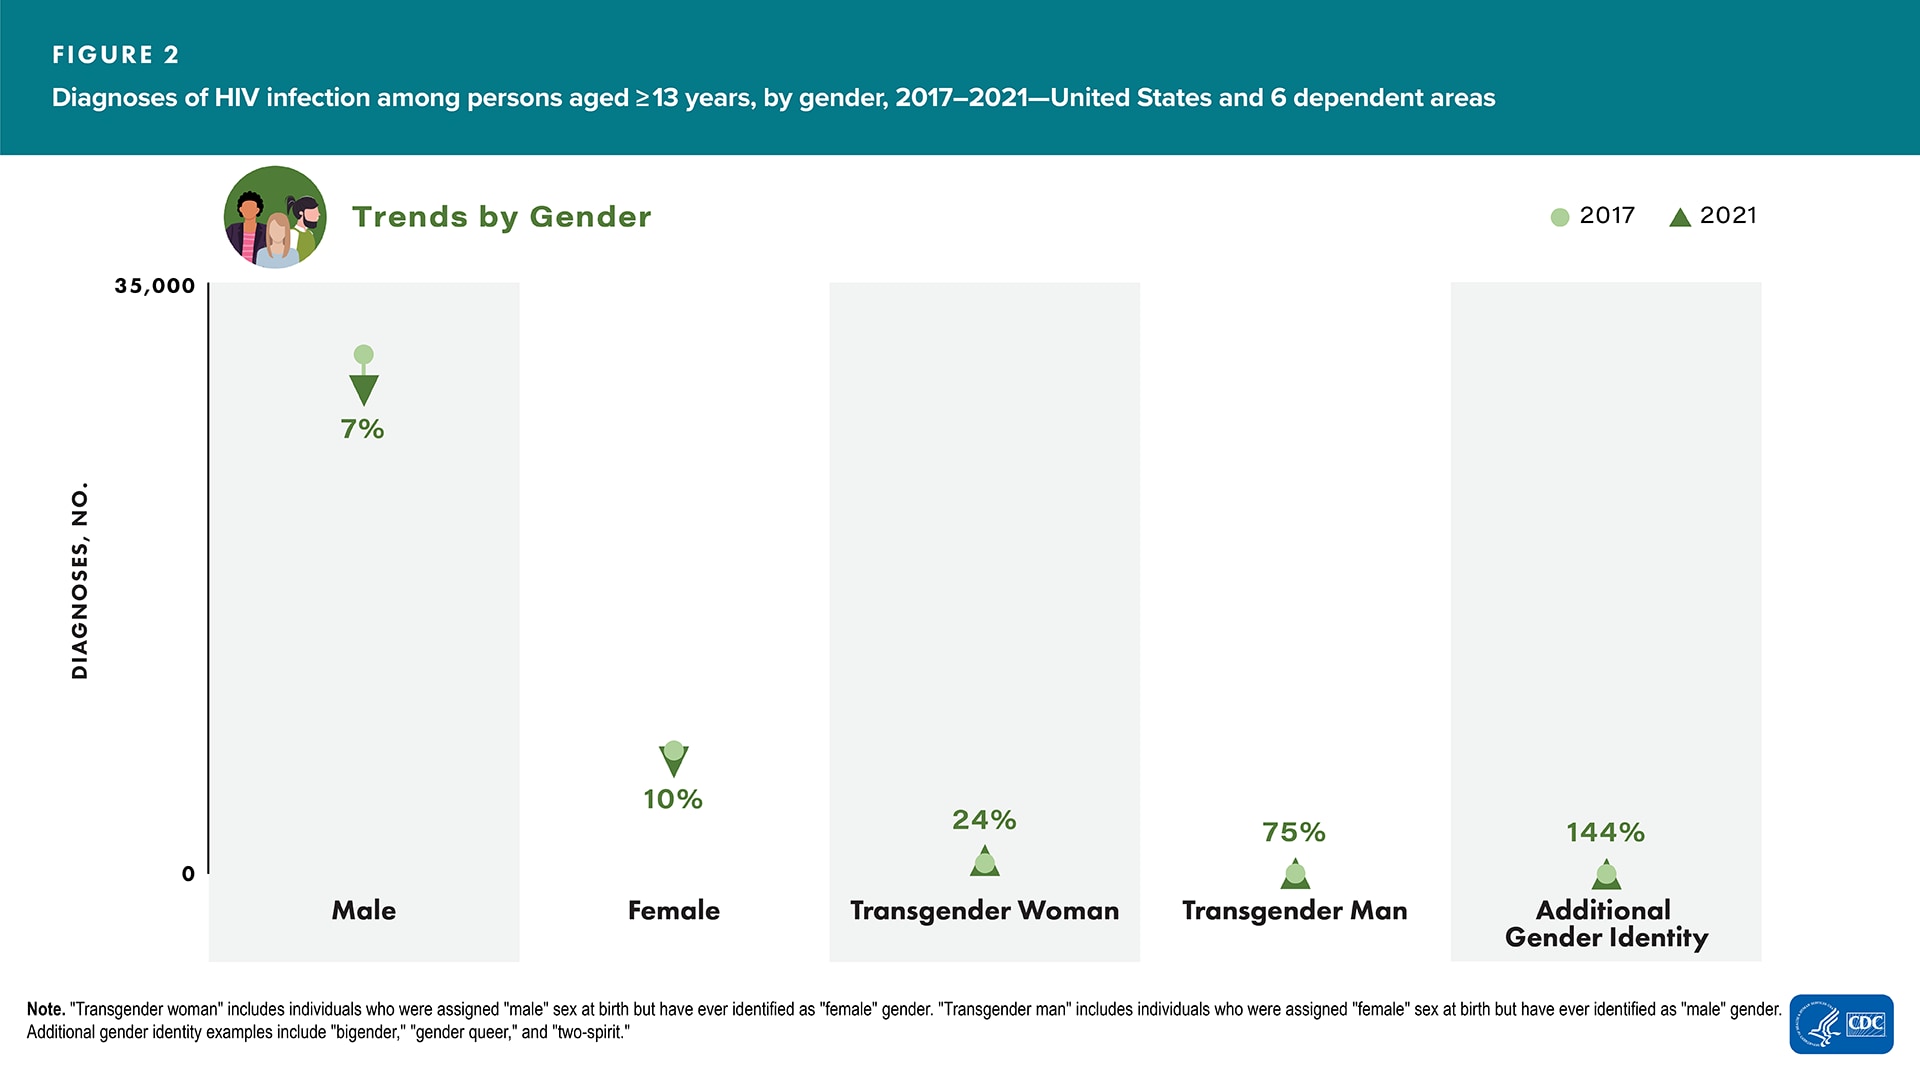
In 2021, compared with 2017, changes in the numbers of HIV diagnoses among persons aged ≥ 13 years were as follows (Figure 2):
- Increase—transgender women (24%), transgender men (75%), and AGI persons (144%)
- Decrease—males (-7%) and females (-10%)
- Stable—none
In 2021, numbers and percentages of HIV diagnoses among persons aged ≥ 13 years were as follows:
- Male—28,620 (79%)
- Female—6,604 (18%)
- Transgender woman/girl—812 (2%)
- Transgender man/boy—56 (< 1%)
- AGI—44 (< 1%)
Age group
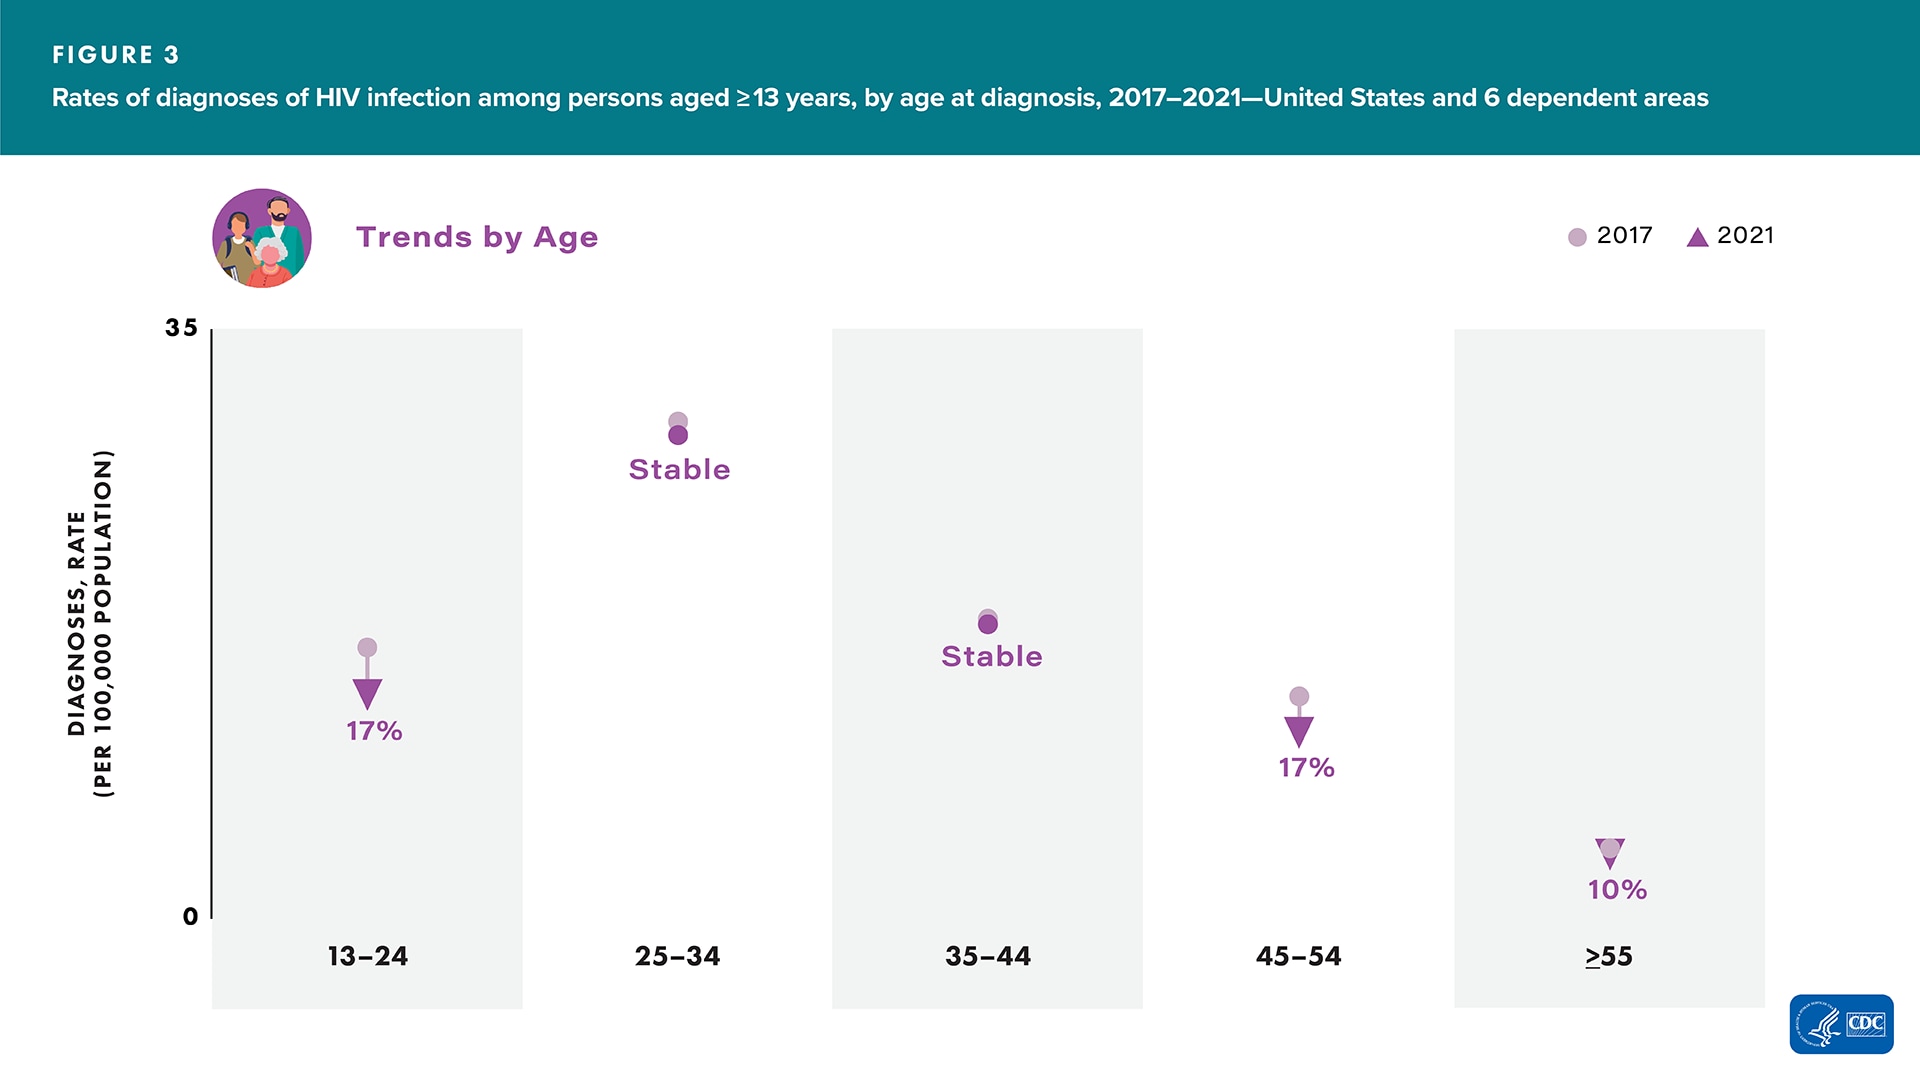
In 2021, compared with 2017, changes in rates of HIV diagnoses among persons aged ≥ 13 years were as follows (Figure 3):
- Increase—none
- Decrease—persons aged 13–24 (-17%), 45–54 (-17%), and ≥ 55 (-10%) years
- Stable—persons aged 25–34 and 35–44 years
In 2021, numbers and percentages of HIV diagnoses among persons aged ≥ 13 years were as follows:
- 13–24 years—6,987 (19%)
- 25–34 years—13,204 (37%)
- 35–44 years—7,634 (21%)
- 45–54 years—4,519 (13%)
- ≥ 55 years—3,792 (10%)
 For additional data by 5-year age groups, see Table 3b.
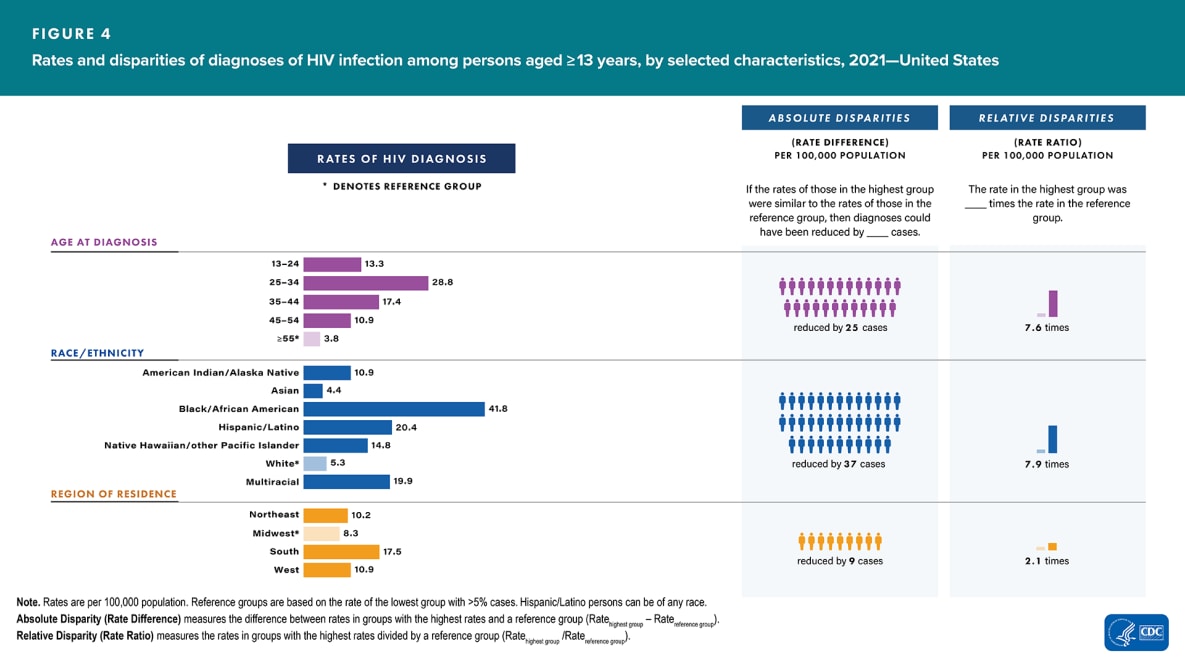
Rates among persons aged ≥ 13 years (United States only) (Figure 4)
- Highest—persons aged 25–34 years (28.8)
- Lowest—persons aged ≥ 55 years (3.8)
 For additional data by 5-year age groups, see Table 3a.
Disparities by age group
- Absolute disparity (rate difference)—If the rate of HIV diagnoses among persons aged 25–34 years was similar to the rate among persons aged ≥ 55 years, then diagnoses could have been reduced by 25 cases per 100,000 population.
- Relative disparity (rate ratio)—The rate of diagnoses among persons aged 25–34 years was 7.6 times the rate among persons aged ≥ 55 years.
Race/ethnicity
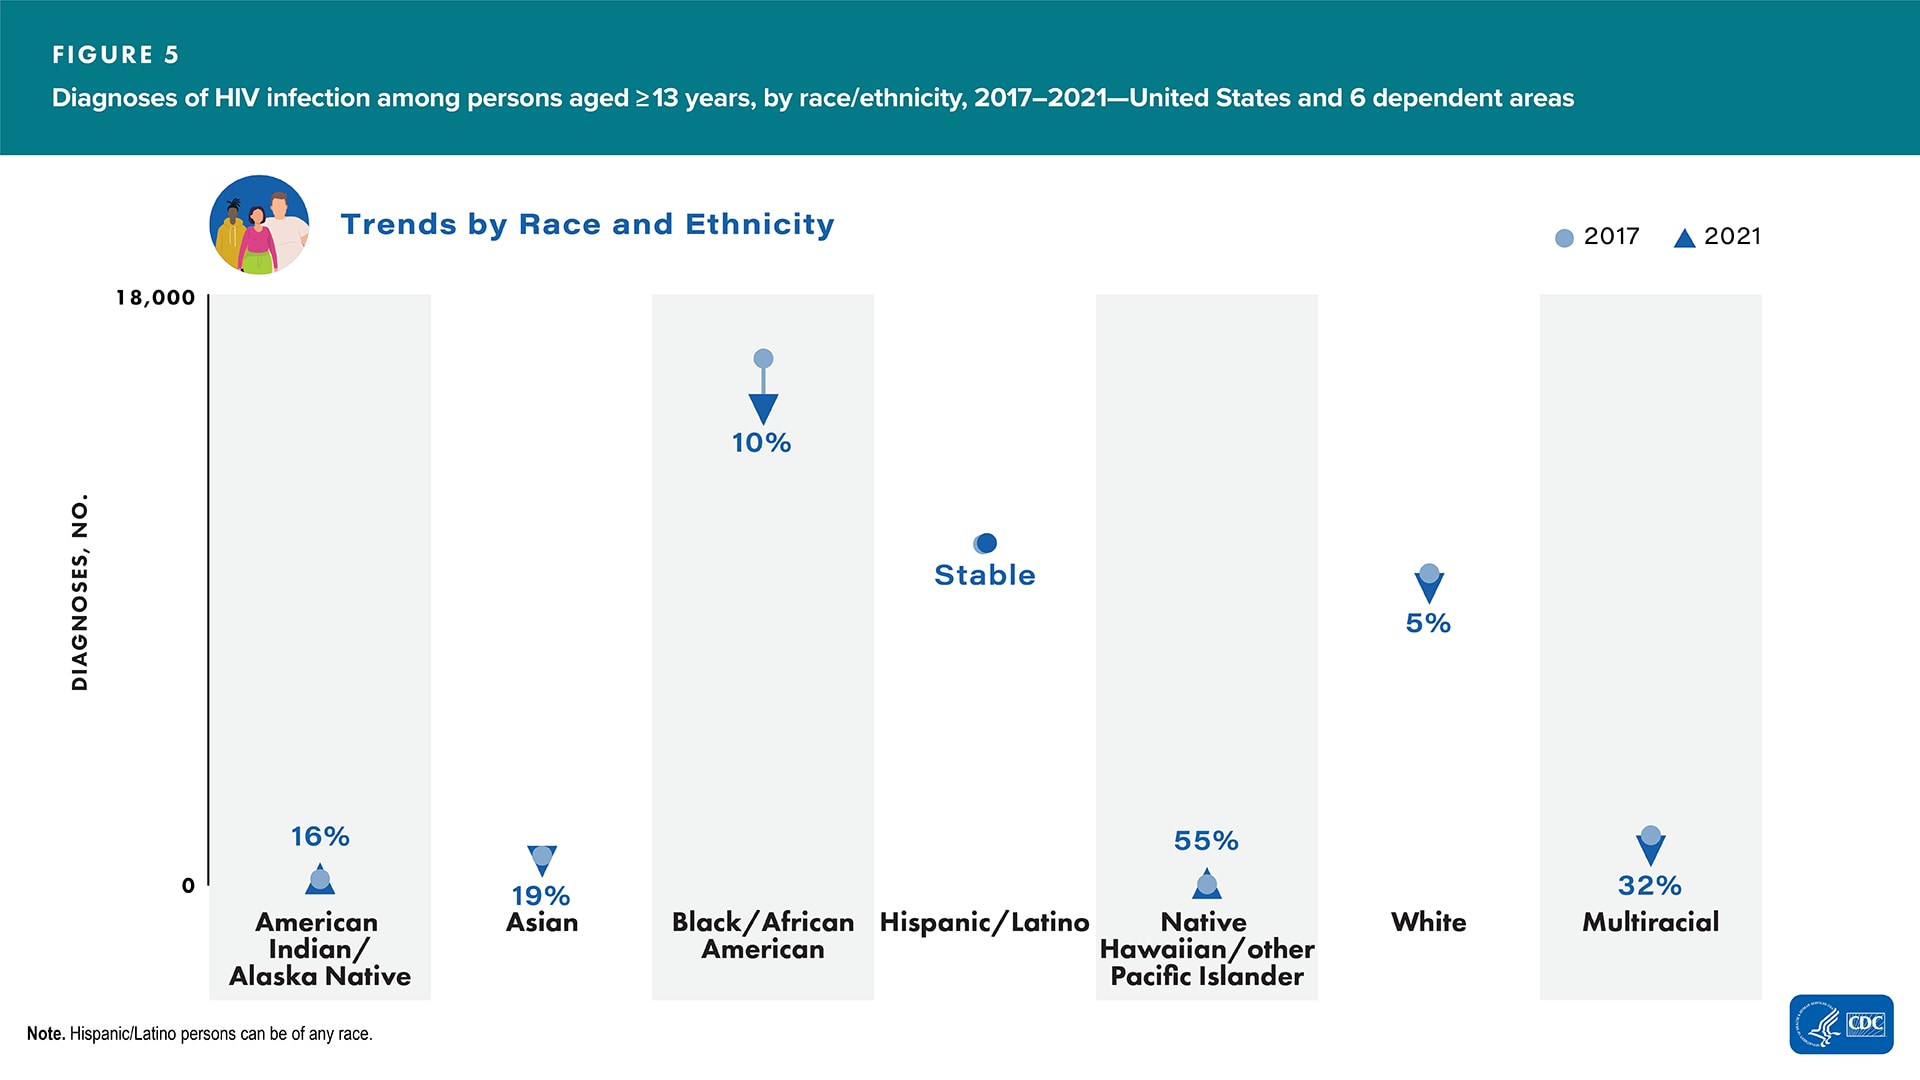
In 2021, compared with 2017, changes in numbers of HIV diagnoses among persons aged ≥ 13 years were as follows (Figure 5):
- Increase—American Indian/Alaska Native (16%) and Native Hawaiian/other Pacific Islander (55%)
- Decrease—Asian (-19%), Black/African American (-10%), White (-5%), and multiracial (-32%)
- Stable—Hispanic/Latino
In 2021, numbers and percentages of HIV diagnoses among persons aged ≥ 13 years were as follows:
- American Indian/Alaska Native—223 (< 1%)
- Asian—738 (2%)
- Black/African American—14,528 (40%)
- Hispanic/Latino—10,467 (29%)
- Native Hawaiian/other Pacific Islander—76 (< 1%)
- White—9,063 (25%)
- Multiracial—1,041 (3%)
Rates among persons aged ≥ 13 years (United States only) (Figure 4)
- Highest—Black/African American (41.8)
- Lowest—Asian (4.4)
Disparities by race/ethnicity
- Absolute disparity (rate difference)—If the rate of HIV diagnoses among Black/African American persons aged ≥ 13 years was similar to the rate among White persons aged ≥ 13 years (5.3), then diagnoses could have been reduced by 37 cases per 100,000 population.
- Relative disparity (rate ratio)—The rate of diagnoses among Black/African American persons aged ≥ 13 years was 7.9 times the rate among White persons aged ≥ 13 years.
Assigned sex at birth (ASAB) and transmission category
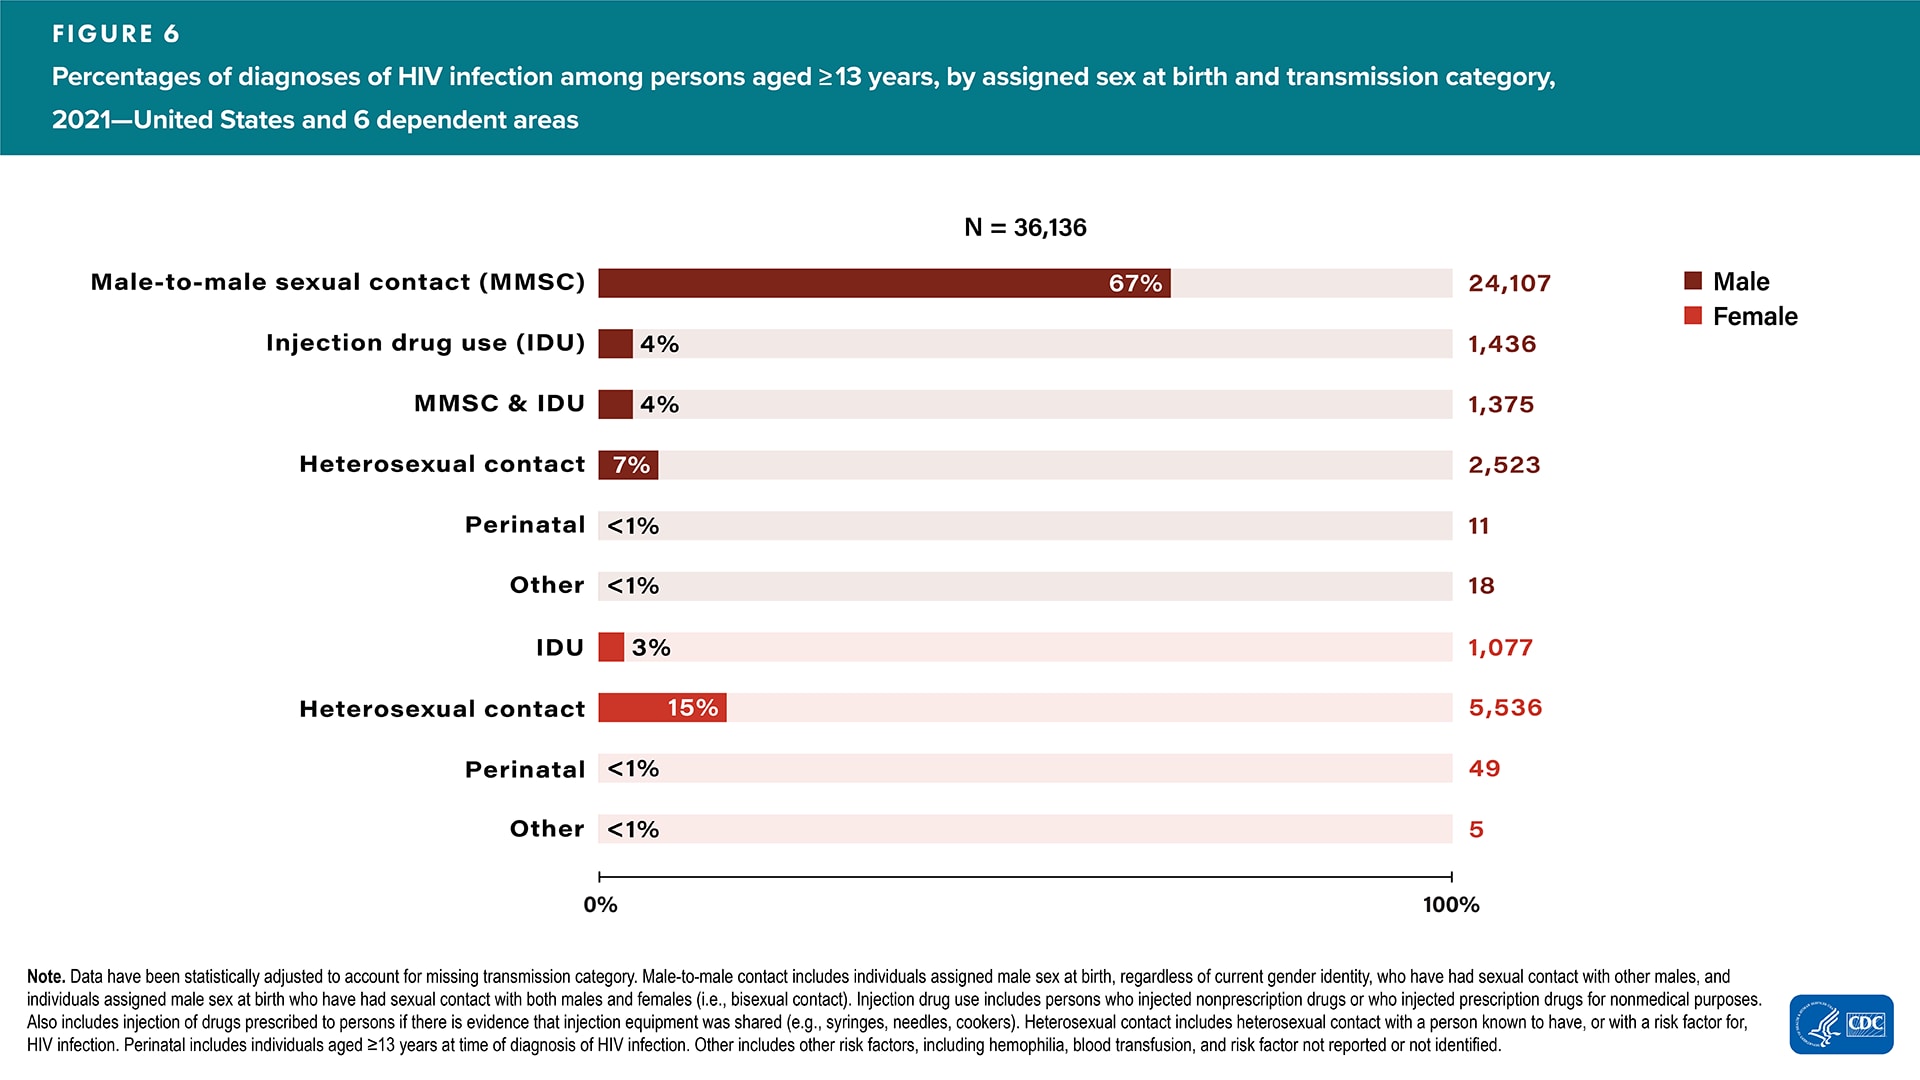
In 2021, compared with 2017, changes in numbers of HIV diagnoses among persons aged ≥ 13 years were as follows (Table 1b):
- Increase—males with infections attributed to IDU (8%)
- Decrease—males with infections attributed to MMSC (-6%), MMSC and IDU (-10%), and heterosexual contact (-15%); females with infections attributed to heterosexual contact (-11%)
- Stable—females with infections attributed to IDU
In 2021, percentages of HIV diagnoses among persons aged ≥ 13 years were as follows—highest percentages (Figure 6, Table 1b):
- Overall—MMSC (67%)
- Male—MMSC (82%)
- Female—heterosexual contact (83%)
Gender and exposure category
In 2021, compared with 2017, changes in numbers of HIV diagnoses among persons aged ≥ 13 years were as follows (Table 4b):
- Increase—transgender women (21%), transgender men (74%), and AGI (138%) with infections attributed to sexual contact; and transgender women with infections attributed to sexual contact and IDU (40%)
- Decrease—none
- Stable—none
In 2021, percentages of HIV diagnoses among persons aged ≥ 13 years were as follows—highest percentages (Table 4b):
- Transgender women—sexual contact (88%)
- Transgender men—sexual contact (84%)
- AGI—sexual contact (86%)
Region of residence
In 2021, compared with 2017, percent changes in rates of HIV diagnoses among all persons were as follows (Table 1b):
- Increase—none
- Decrease—Northeast (-19%), Midwest (-7%), South (-8%), West (-6%), and U.S. dependent areas (-7%)
- Stable—none
In 2021, numbers and percentages of HIV diagnoses among all persons were as follows (Table 1b):
- Northeast—4,993 (14%)
- Midwest—4,824 (13%)
- South—18,728 (52%)
- West—7,224 (20%)
- U.S. dependent areas—420 (1%)
Rates among persons aged ≥ 13 years (United States only) (Figure 4)
- Highest—South (17.5)
- Lowest—Midwest (8.3)
Disparities by region
- Absolute disparities (rate difference)—If the rate of HIV diagnoses among persons in the South was similar to the rate among persons in the Midwest, then diagnoses could have been reduced by 9 cases per 100,000 population.
- Relative disparities (rate ratio)—The rate of diagnoses among persons in the South was 2.1 times the rate among persons in the Midwest.

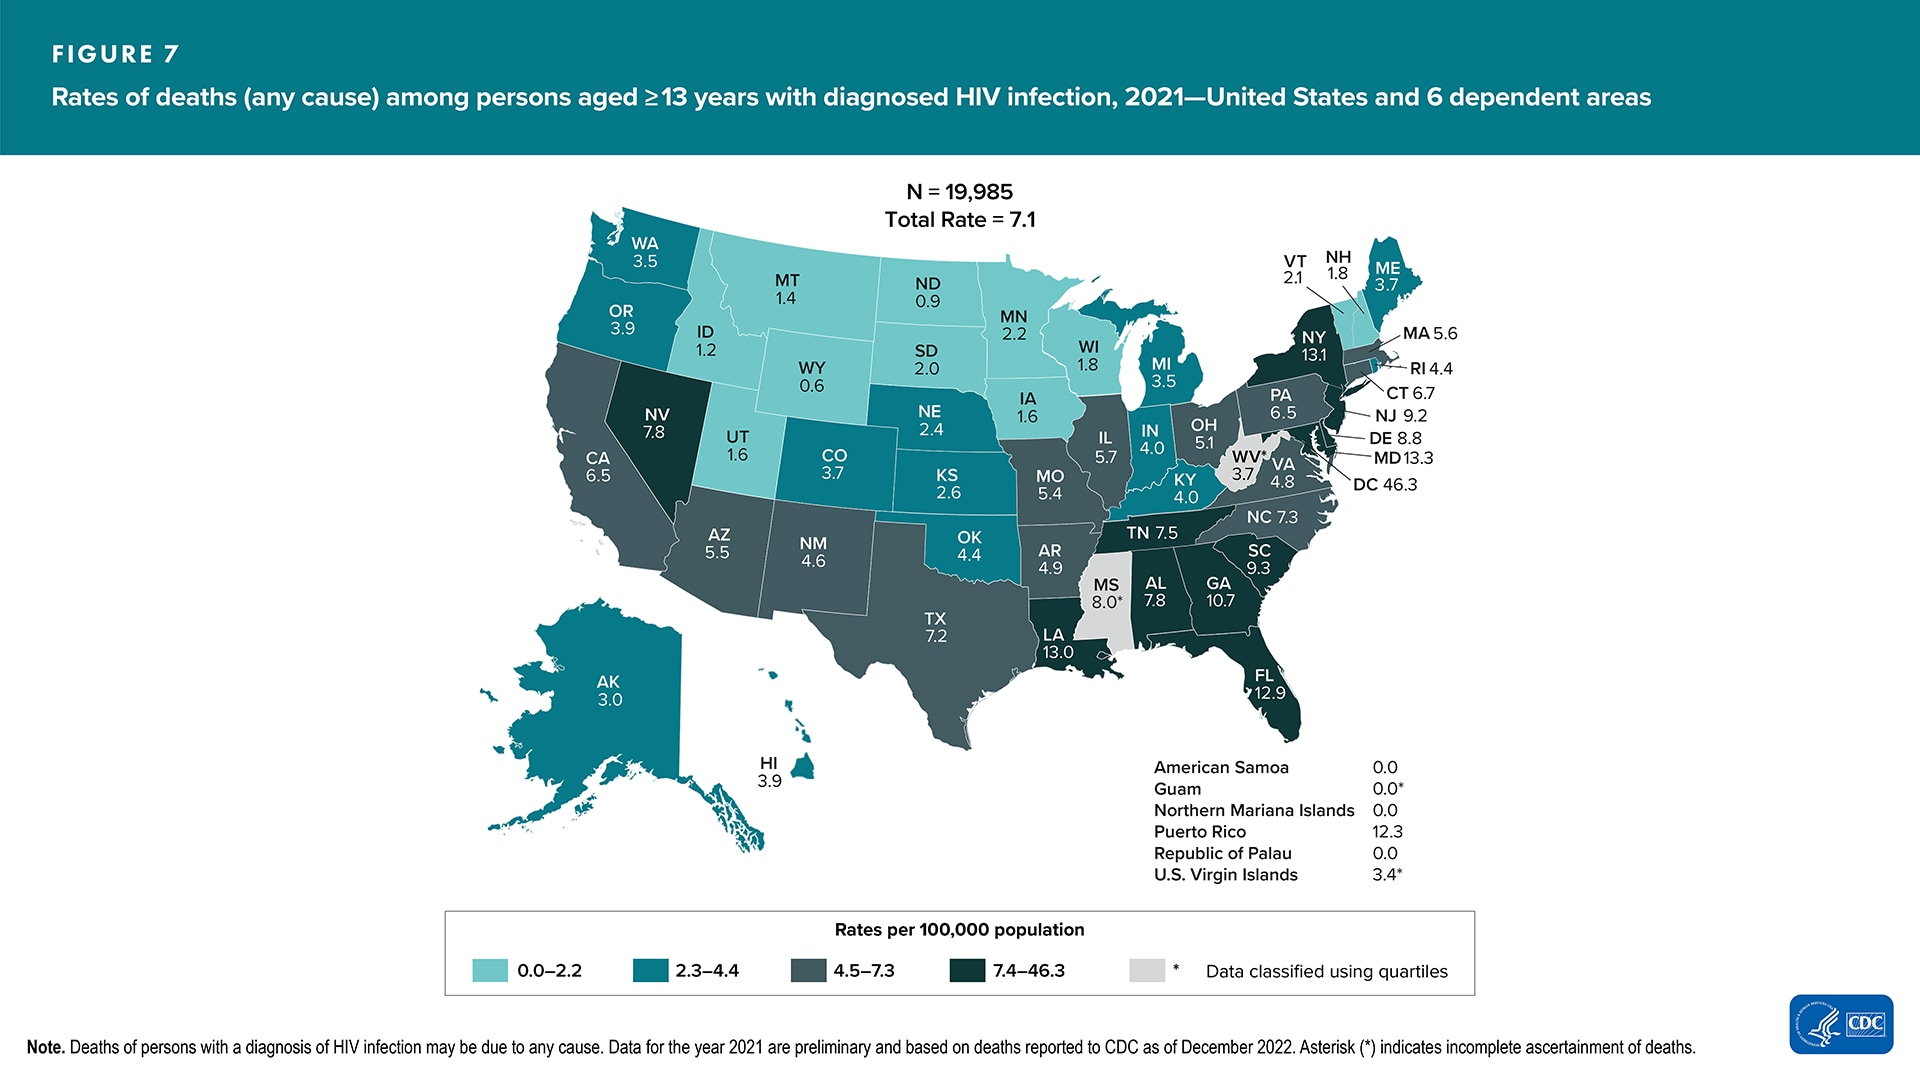
In 2021, compared with 2017, the annual number and rate of deaths increased in the United States and 6 dependent areas, (Table 11b). In 2021, the number of deaths among persons with diagnosed HIV infection was 19,986 (persons aged ≥ 13 years: 19,985) (Table 13b). The overall rate of deaths was 6.0 (persons aged ≥ 13 years: 7.1) (Figure 7, Tables 11b and 13b).
Gender
In 2021, compared with 2017, trends for the numbers of deaths among persons with diagnosed HIV infection were as follows (Table 11b):
- Increase—males (19%), females (18%), and transgender women/girls (96%)
- Decrease—none
- Stable—none
In 2021, numbers and percentages of deaths among persons with diagnosed HIV infection were as follows (Table 11b):
- Male—14,942 (75%)
- Female—4,825 (24%)
- Transgender woman/girl—216 (1%)
- Transgender man/boy—2 (< 1%)
- AGI—1 (< 1%)
Age group
In 2021, compared with 2017, trends for the rates of deaths among persons with diagnosed HIV infection were as follows (Table 11b):
- Increase—persons aged 25–29 (11%), 30–34 (39%), 35–39 (17%), 40–44 (12%), 55–59 (15%), 60–64 (24%), and ≥ 65 (48%) years
- Decrease—persons aged 20–24 (-29%), 45–49 (-8%), and 50–54 (-16%) years
- Stable—none
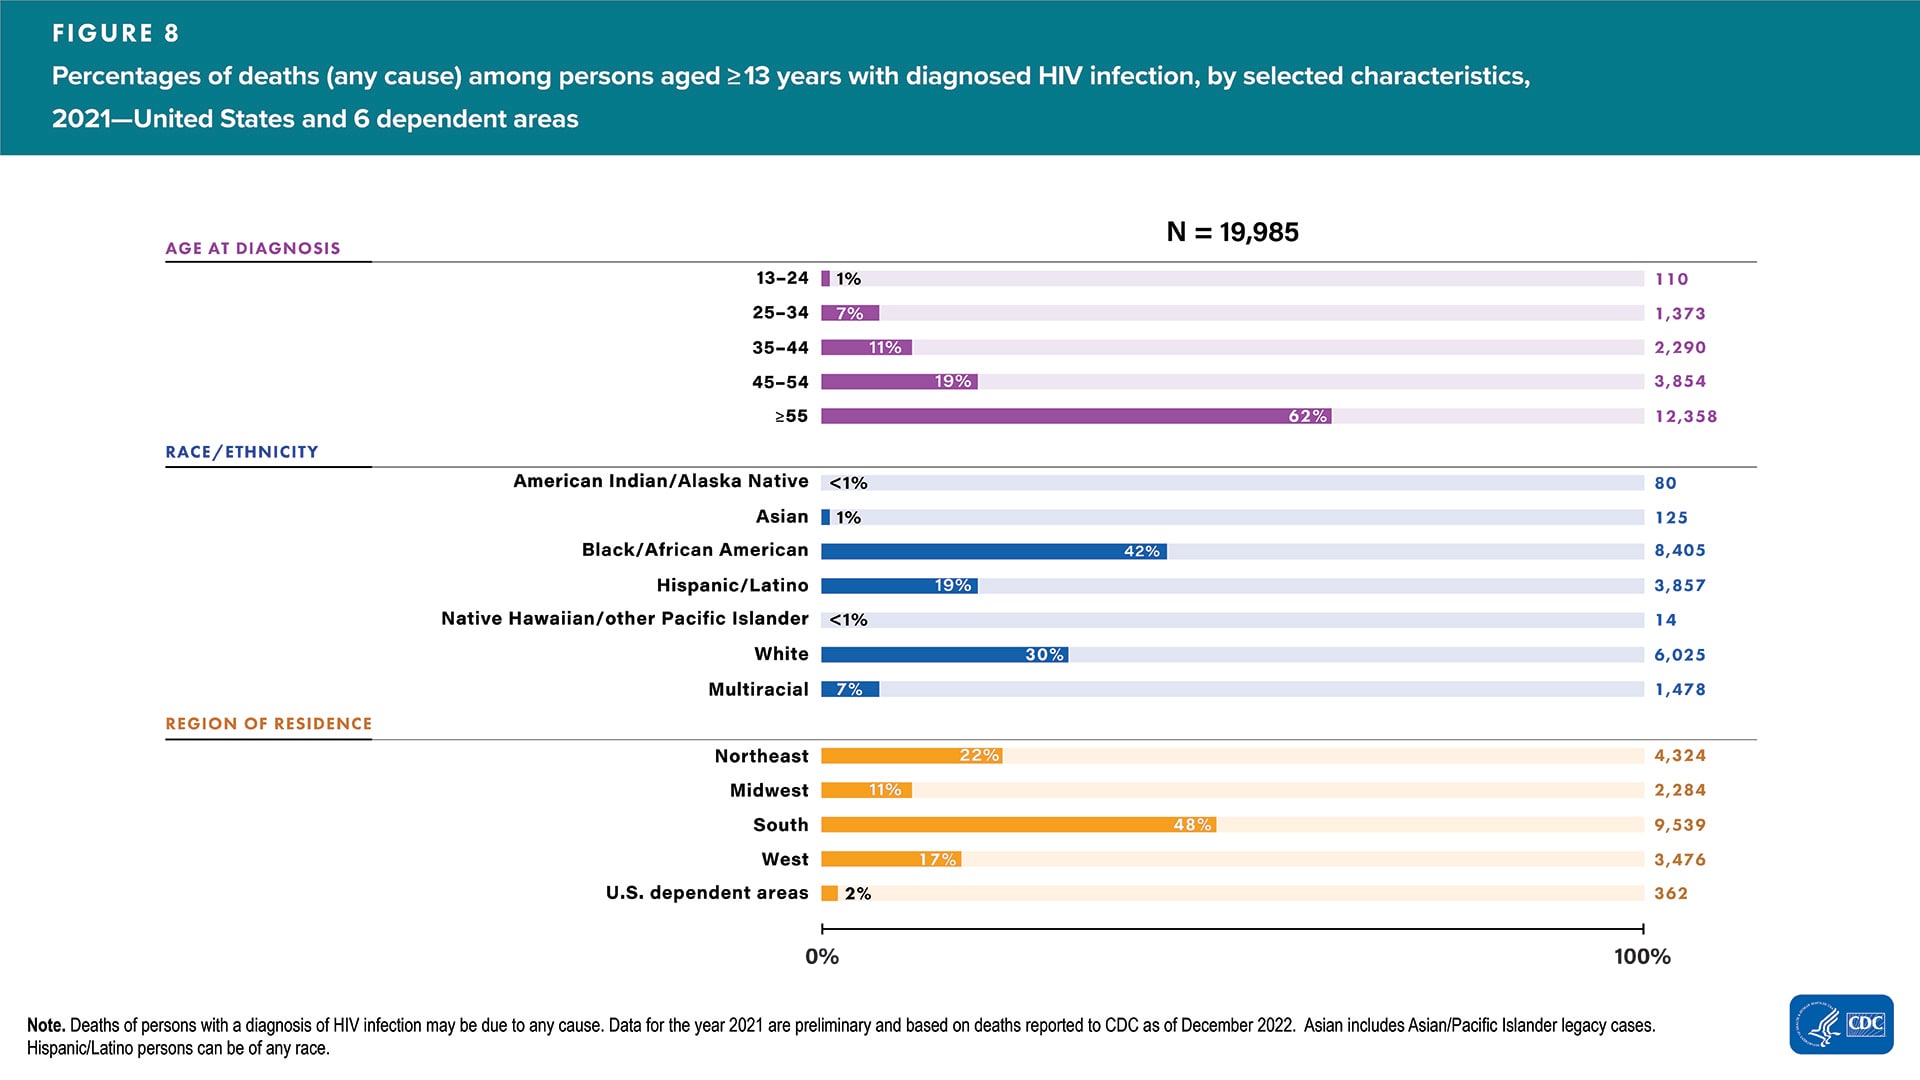
In 2021, numbers and percentages of deaths among persons aged ≥ 13 years with diagnosed HIV infection were as follows (Figure 8):
- 13–24 years—110 (1%)
- 25–34 years—1,373 (7%)
- 35–44 years—2,290 (11%)
- 45–54 years—3,854 (19%)
- ≥ 55 years—12,358 (62%)
 For additional data by 5-year age groups, see Table 11b.
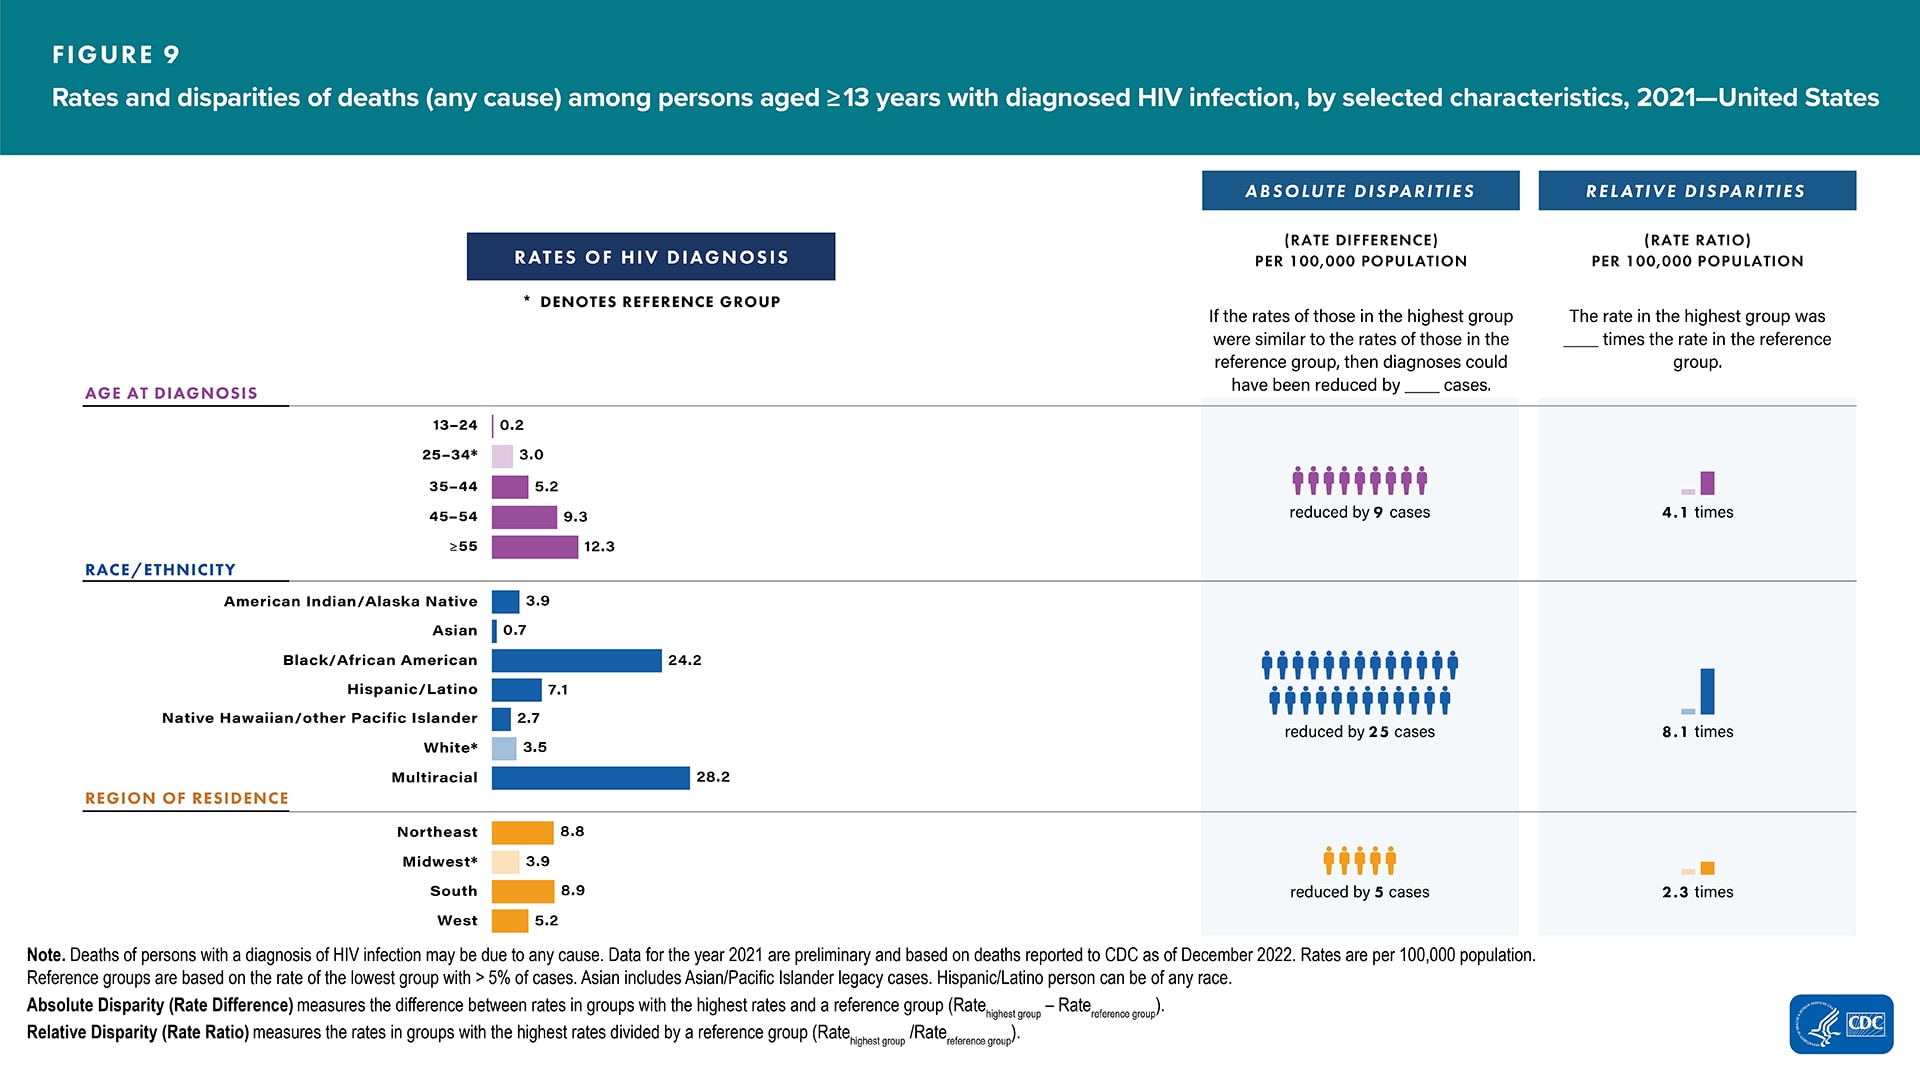
Rates among persons aged ≥ 13 years (United States only) (Figure 9)
- Highest—persons aged ≥ 55 years (12.3)
- Lowest—persons aged 13–24 years (0.2)
 For additional data by 5-year age groups, see Table 11a.
Disparities by age group
- Absolute disparity (rate difference)—If the rate of deaths among persons aged ≥ 55 years with diagnosed of HIV infection was similar to the rate among persons aged 25–34 years (3.0), then deaths could have been reduced by 9 per 100,000 population.
- Relative disparity (rate ratio)—The rate of death among persons aged ≥ 55 years was 4.1 times the rate among persons aged 25–34 years.
Race/ethnicity
In 2021, compared with 2017, changes in numbers of deaths among persons with diagnosed HIV infection were as follows (Table 11b):
- Increase—American Indian/Alaska Native (70%), Asian (42%), Black/African American (17%), Hispanic/Latino (25%), White (15%), and multiracial (37%)
- Decrease—none
- Stable—none
In 2021, numbers and percentages of deaths among persons aged ≥ 13 years with diagnosed HIV infection were as follows (Figure 8):
- American Indian/Alaska Native—80 (< 1%)
- Asian—125 (1%)
- Black/African American—8,405 (42%)
- Hispanic/Latino—3,858 (19%)
- Native Hawaiian/other Pacific Islander—14 (< 1%)
- White—6,025 (30%)
- Multiracial—1,478 (7%)
Rates among persons aged ≥ 13 years (United States only) (Figure 9)
- Highest—multiracial (28.2)
- Lowest—Asian (0.7)
Disparities by race/ethnicity
- Absolute disparity (rate difference)—If the rate of deaths among multiracial persons aged ≥ 13 years with diagnosed of HIV infection was similar to the rate among White persons aged ≥ 13 years (3.5), then deaths could have been reduced by 25 per 100,000 population.
- Relative disparity (rate ratio)—The rate of death among multiracial persons aged ≥ 13 years was 8.1 times the rate among White persons aged ≥ 13 years.
ASAB and transmission category
In 2021, compared with 2017, changes in numbers of deaths among persons aged ≥ 13 years with diagnosed HIV infection were as follows (Table 11b):
- Increase—MMSC (23%), heterosexual contact (male [22%]; female [24%]), MMSC and IDU (22%), and IDU (male [7%]; female [5%])
- Decrease—none
- Stable—none
In 2021, percentages of deaths among persons aged ≥ 13 years with diagnosed HIV infection were as follows—highest percentages (Table 11b):
- Overall—MMSC (44%)
- Male—MMSC (58%)
- Female—heterosexual contact (67%)
Gender and exposure category
In 2021, compared with 2017, changes in numbers of deaths among persons aged ≥ 13 years with diagnosed HIV infection were as follows (Table 14b):
- Increase—transgender women with infections attributed to sexual contact (101%) and sexual contact and IDU (79%)
- Decrease—none
- Stable—none
In 2021, percentages of deaths among persons aged ≥ 13 years with diagnosed HIV infection were as follows—highest percentages (Table 14b):
- Transgender women—sexual contact (74%)
- Transgender men—sexual contact and IDU (100%)
- AGI—sexual contact (100%)
Region of residence
In 2021, compared with 2017, changes in rates of deaths among persons with diagnosed HIV infection were as follows (Table 11b):
- Increase—Northeast (15%), Midwest (18%), South (15%), and West (26%)
- Decrease—U.S. dependent areas (-10%)
- Stable—none
In 2021, numbers and percentages of deaths among persons with diagnosed HIV infection were as follows (Table 11b):
- Northeast—4,324 (22%)
- Midwest—2,284 (11%)
- South—9,540 (48%)
- West—3,476 (17%)
- U.S. dependent areas—362 (2%)
Rates among persons aged ≥ 13 years (United States only) (Figure 9)
- Highest—South (8.9)
- Lowest—Midwest (3.9)
Disparities by region
- Absolute disparities (rate difference)—If the rate of death among persons in the South with diagnosed of HIV infection was similar to the rate among persons in the Midwest, then deaths could have been reduced by 5 per 100,000 population.
- Relative disparities (rate ratio)—The rate of death among persons in the South was 2.3 times the rate among persons in the Midwest.

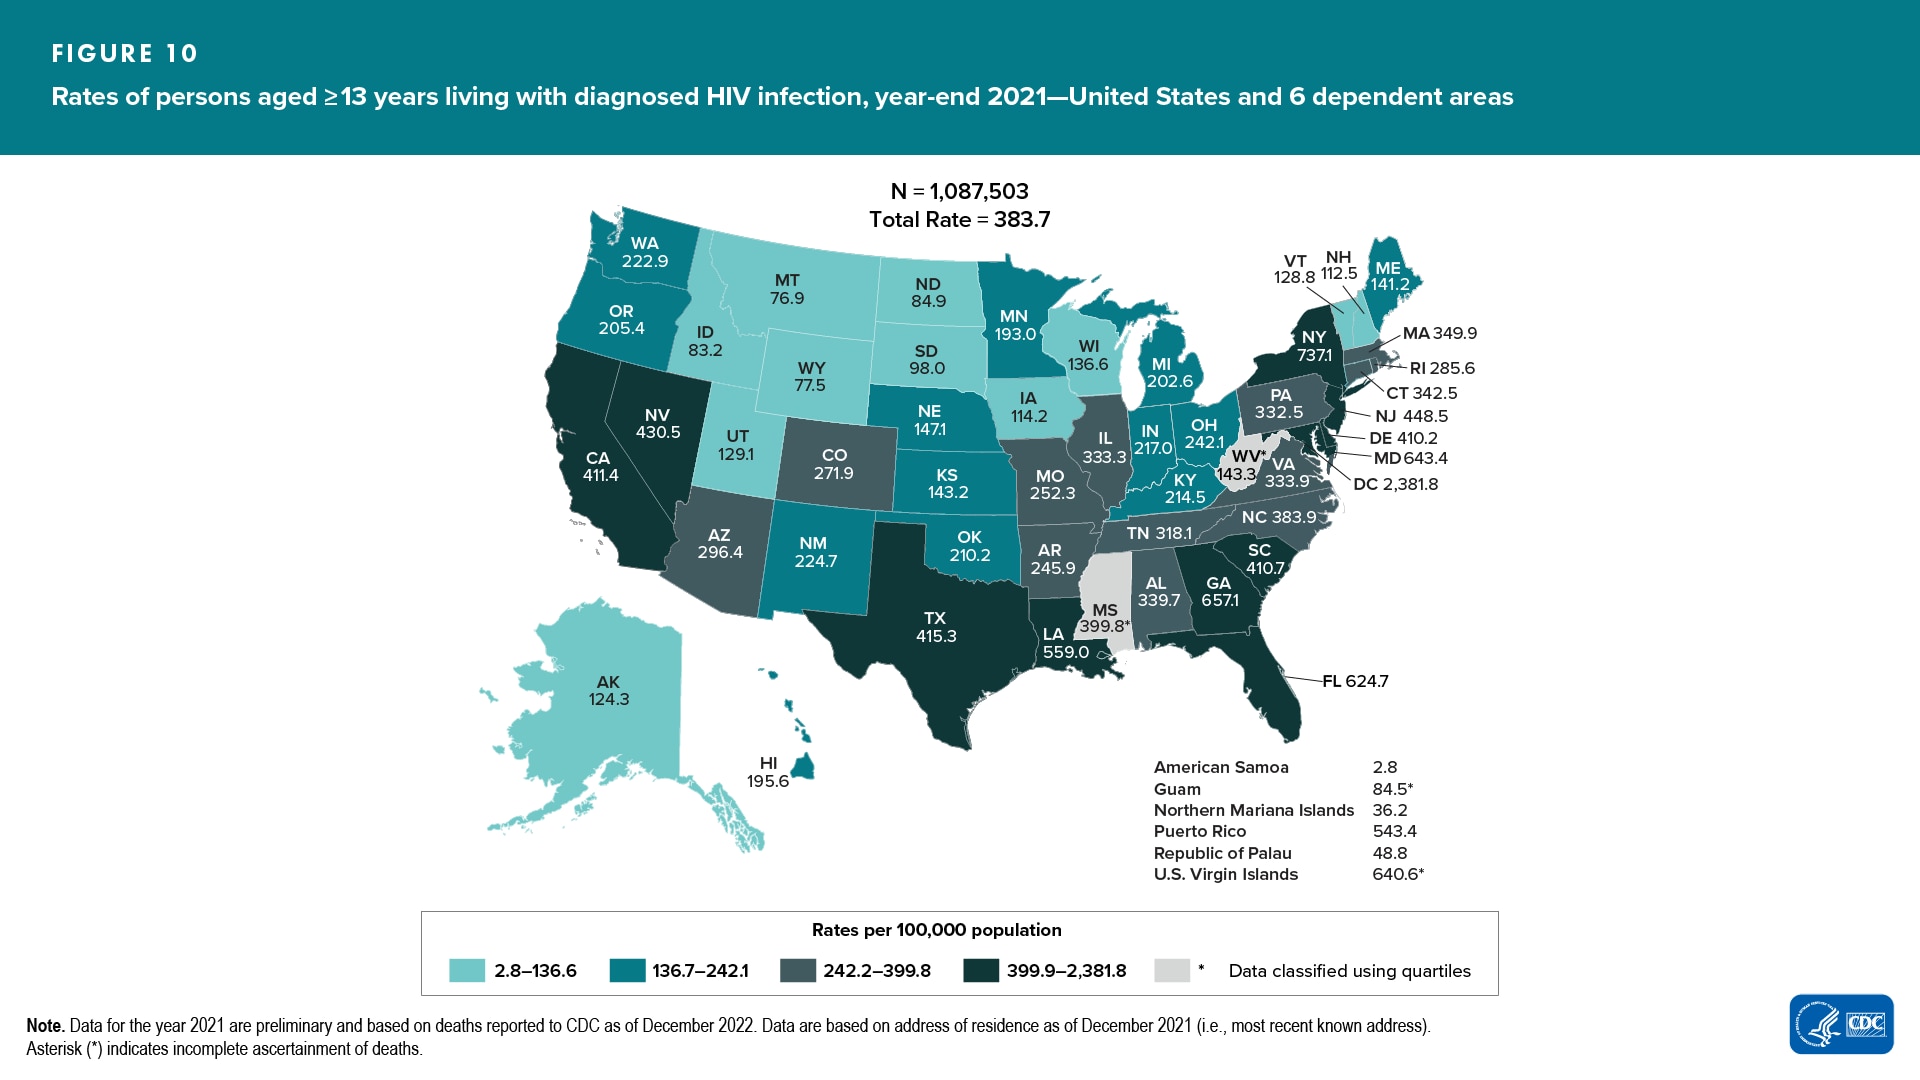
In 2021, compared with 2017, the annual number and rate of persons living with diagnosed HIV infection increased in the United States and 6 dependent areas, (Table 15b). At year-end 2021, 1,088,769 persons were living with diagnosed HIV infection (persons aged ≥ 13 years: 1,087,503) (Tables 15b and 17b). The overall rate of persons living with diagnosed HIV infection was 324.5 (persons aged ≥ 13 years: 383.7) (Figure 10, Table 15b).
Persons living with diagnosed HIV infection percentages and/or rates were as follows:
Gender (Table 15b)
- Male—823,824 (76%)
- Female—250,857 (23%)
- Transgender woman/girl—13,150 (1%)
- Transgender man/boy—577 (< 1%)
- AGI—361 (< 1%)
Age group (Table 15b)
- 13–24 years—28,267 (3%)
- 25–34 years—164,936 (15%)
- 35–44 years—205,629 (19%)
- 45–54 years—247,057 (23%)
- ≥ 55 years—441,614 (41%)
 For additional data by 5-year age groups, see Table 15b.
Race/ethnicity (Table 15b)
- American Indian/Alaska Native—3,278 (< 1%)
- Asian—16,788 (2%)
- Black/African American—433,293 (40%)
- Hispanic/Latino—271,212 (25%)
- Native Hawaiian/other Pacific Islander—989 (< 1%)
- White—306,688 (28%)
- Multiracial—55,839 (5%)
Rates (United States only) (Table 15a)
- American Indian/Alaska Native—133.6
- Asian—84.9
- Black/African American—1,034.3
- Hispanic/Latino—407.5
- Native Hawaiian/other Pacific Islander—152.5
- White—155.8
- Multiracial—716.4
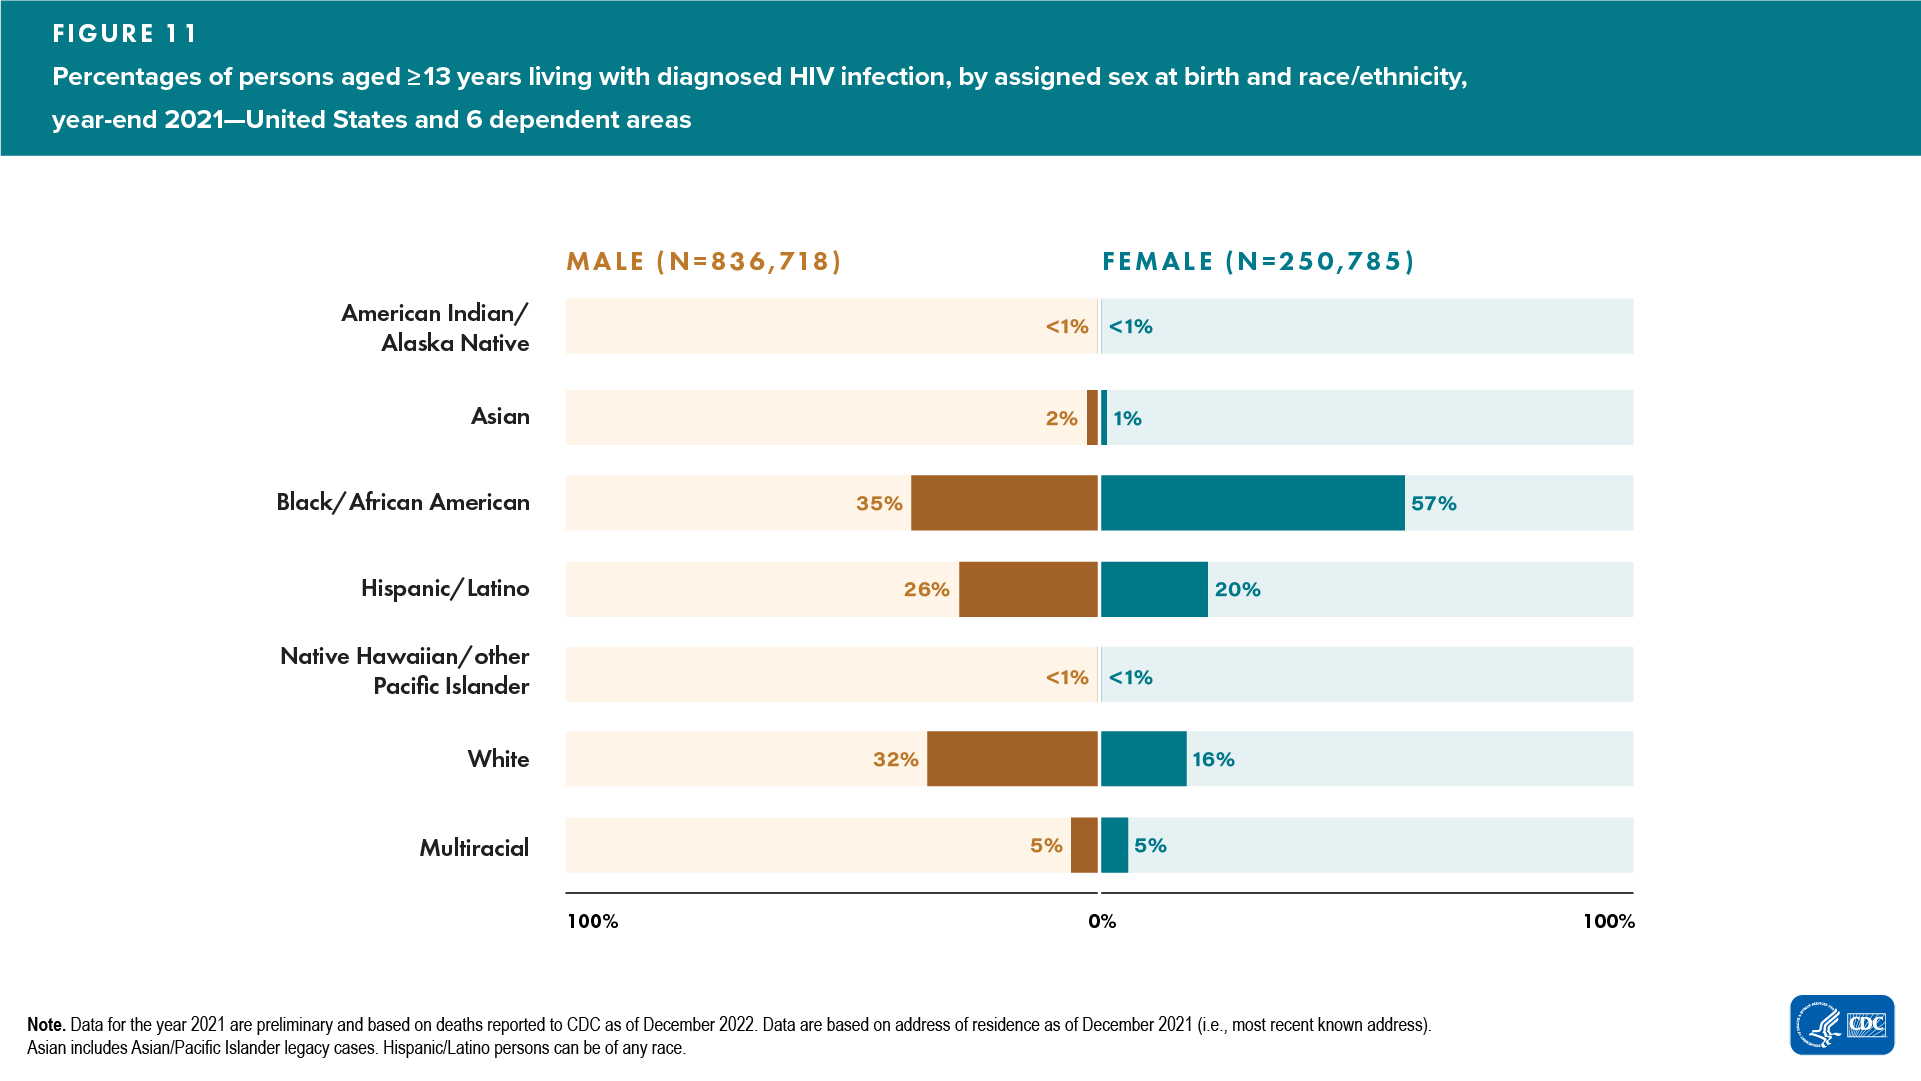
ASAB and race/ethnicity—highest percentages (Figure 11)
- Male—Black/African American (35%)
- Female—Black/African American (57%)
ASAB and transmission category, persons aged ≥ 13 years—highest percentages (Table 17b)
- Overall—MMSC (57%)
- Male—MMSC (74%)
- Female—heterosexual contact (77%)
Gender and exposure category (Table 18b)
- Transgender women—sexual contact (85%)
- Transgender men—sexual contact (76%)
- AGI—sexual contact (87%)
Region of residence (Table 15b)
- Northeast—235,158 (22%)
- Midwest—129,138 (12%)
- South—493,509 (45%)
- West—214,462 (20%)
- U.S. dependent areas—16,502 (2%)
Rates (United States only) (Table 15a)
- Highest—Northeast (411.4)
- Lowest—Midwest (187.6)
