Diagnoses of HIV Infection in the United States and Dependent Areas 2020: Commentary

Overview
The Centers for Disease Control and Prevention (CDC) collects, analyzes, and disseminates surveillance data on HIV infection; these data are one of the nation’s primary sources of information on HIV in the United States. The annual surveillance report, published by CDC, summarizes information about diagnosed HIV infection in the United States and dependent areas. HIV surveillance data are used by CDC and their public health partners in other federal agencies, health departments, nonprofit organizations, academic institutions, and the public to help focus prevention efforts; plan services; allocate resources; develop policy; detect, monitor, and intervene in HIV clusters; and monitor trends in HIV infection. Data in this report may be used to achieve national goals, such as those laid out in the National HIV/AIDS Strategy [1], Healthy People 2030 [2], and the Ending the HIV Epidemic in the U.S. (EHE) initiative [3].
Impact of COVID-19 Pandemic
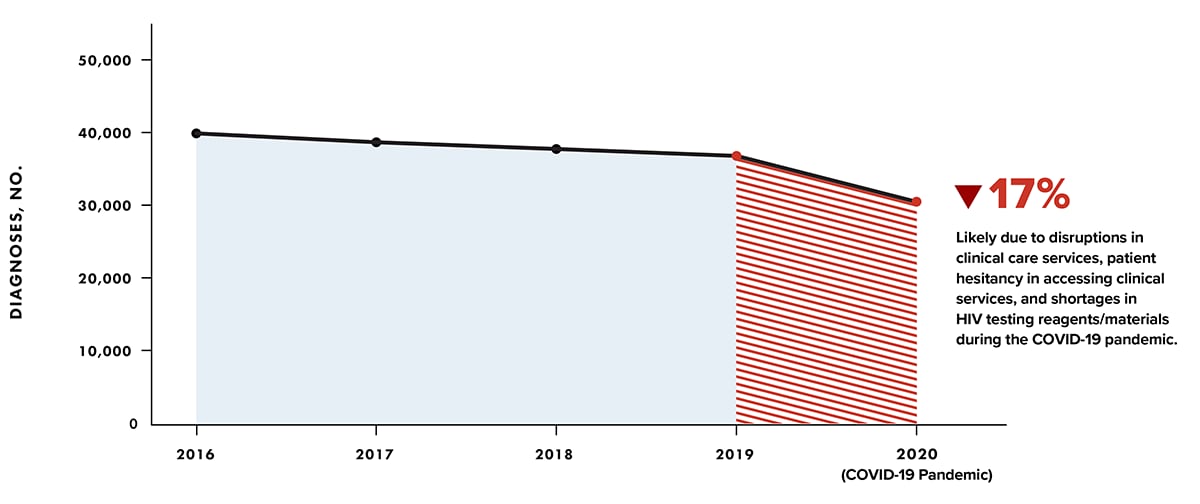
For this report, due to the impact of the COVID-19 pandemic on HIV testing in the United States during 2020, HIV diagnosis, death, and prevalence trends through 2020 are not discussed in the Commentary [4–7]. The overall number of HIV diagnoses in the United States in 2020 (30,403) was 17% lower than in 2019 (36,585) (Figure A, Table 1a). The steep reduction in diagnoses in 2020 is likely due to disruptions in clinical care services, patient hesitancy in accessing clinical services, and shortages in HIV testing reagents/materials, which causes concern regarding underdiagnosis [5–7]. Although state/local health departments developed innovative strategies for HIV-related testing (self-tests) and care services (telehealth) during the COVID-19 pandemic, these strategies did not make up for declines in laboratory reporting because self-test results are not routinely reported to health departments or CDC [8, 9]. In addition, telehealth visits might not have included orders for laboratory testing during periods of strict social distancing or patients may have been reluctant to complete testing.
As the COVID-19 pandemic is still ongoing, more time and data are needed to accurately assess COVID-19’s impact on HIV in the United States. Data for the year 2020 should be interpreted with caution due to the impact of the COVID-19 pandemic on access to HIV testing, care-related services, and case surveillance activities in state/local jurisdictions. To emphasize the need for caution, tables presenting data for the year 2020 include “COVID-19 pandemic” in the title, and the 2020 column is highlighted in tables that provide multiple years of data. Assessment of trends in HIV diagnoses, deaths, and prevalence that include the year 2020 is discouraged. See COVID suggested readings for additional information on COVID-19 and HIV.
Figure A. Diagnoses of HIV infection, 2016–2020—United States

Note: Diagnoses of HIV infection reported to CDC through December 2021. The annual number of HIV diagnoses in 2020 was 17% lower than 2019. The decline in 2020 was larger than the average yearly decline (2%–3%) observed during 2016–2019.
Numbers, percentages, and rates of diagnoses of HIV infection during 2020 are based on data from all 50 states, the District of Columbia, and 6 U.S. dependent areas (American Samoa, Guam, the Northern Mariana Islands, Puerto Rico, the Republic of Palau, and the U.S. Virgin Islands). Data for stage 3 (AIDS) are available via Atlas Plus (for 1985 through the most recent year) and in the Stage 3 (AIDS) classification slide set (for cumulative data through the most recent year).
Report Changes
- Terminology for gender and transmission category labels were updated.
- Risk factor data for transgender and additional gender identity persons have been added. Data are presented using the exposure category classification, which is meant to convey all the known ways the person could have been exposed to HIV. (See Technical Notes for more information on exposure category.)
- Tables that present data for transgender persons include additional gender identity (AGI); a new table presents diagnoses of HIV infection by exposure category and place of birth (Table 10b).
- National Profile and Special Focus Profile sections now include absolute and relative disparity measures.
