Estimated HIV Incidence and Prevalence in the United States, 2017–2021: National Profile

All numbers and percentages in this report (except numbers of diagnosed cases) are estimated by using the CD4 model and are based on diagnosed cases with vital status information reported to CDC. Relative standard errors (RSEs; see Technical Notes for additional information) were calculated for estimated numbers and percentages and are presented in the tables. All highlights in this section are based on reliable estimates (i.e., RSE of <30%).
Estimates of annual HIV infections (incidence) and persons living with HIV infection (prevalence) are based on NHSS data from the 50 states and the District of Columbia (and for jurisdiction-level estimates only, Puerto Rico; Tables 6 and 13) for persons aged ≥13 years.
Estimates of persons living with HIV infection in the United States include persons with diagnosed or undiagnosed HIV infection. Numbers of persons aged >13 years living with diagnosed infection (prevalence of diagnosed infection; Tables 8–13) are reported numbers, not estimates.
Differences in estimated numbers of HIV infection (Tables 1–6) and estimated percentages of diagnosed infections among persons living with HIV (Tables 8–13) for 2021, compared with 2017, were assessed by the z test. Differences were deemed statistically significant when P<0.05. If estimates for 2017 and 2021 did not differ significantly, we report that no changes were detected.
Important notes
- Please use caution when interpreting the estimated numbers of HIV infection for American Indian/Alaska Native persons: the RSEs are ≥30% for most of the data years presented. The estimated numbers for Native Hawaiian/other Pacific Islander persons are not presented for some years because the RSEs of the estimates are >50%.
- Incidence and prevalence estimates for the following jurisdictions should be interpreted with caution because the jurisdiction does not have laws requiring complete reporting of laboratory data or has incomplete reporting. Idaho does not have laws. Areas with incomplete reporting are New Jersey, Pennsylvania (excluding Philadelphia), and Puerto Rico.
- Prevalence estimates for the year 2021 are preliminary and based on death data received by CDC as of December 2022. Prevalence trends through 2021 should be interpreted with caution. The following jurisdictions had incomplete reporting of deaths for the year 2021 and should be interpreted with caution: Mississippi and West Virginia.
- Readers who are reviewing jurisdiction-level incidence (Tables 6 and A1) and prevalence estimates (Tables 13 and A2) to guide prevention efforts should refer to diagnosis data presented in the 2021 HIV Surveillance Report if estimates for the jurisdiction of interest have RSEs≥30% [14].
- Please read all titles and footnotes carefully to ensure a complete understanding of the displayed data.
- HIV incidence and prevalence estimates for years presented in this report may change in the future when more diagnoses data have been reported to CDC. The most recent years’ estimates are the most unreliable due to delays in reporting of diagnoses to CDC.
- All rates are per 100,000 population.
- See Technical Notes for information on data specifications.
National and state-level incidence and prevalence data for years 2010–2021 are available via NCHHSTP AtlasPlus. NCHHSTP AtlasPlus is an interactive tool that gives users the ability to create customized tables, maps, and charts by using CDC’s surveillance data on HIV, viral hepatitis, sexually transmitted diseases, and tuberculosis. AtlasPlus also provides access to indicators on social determinants of health.
HIV Incidence
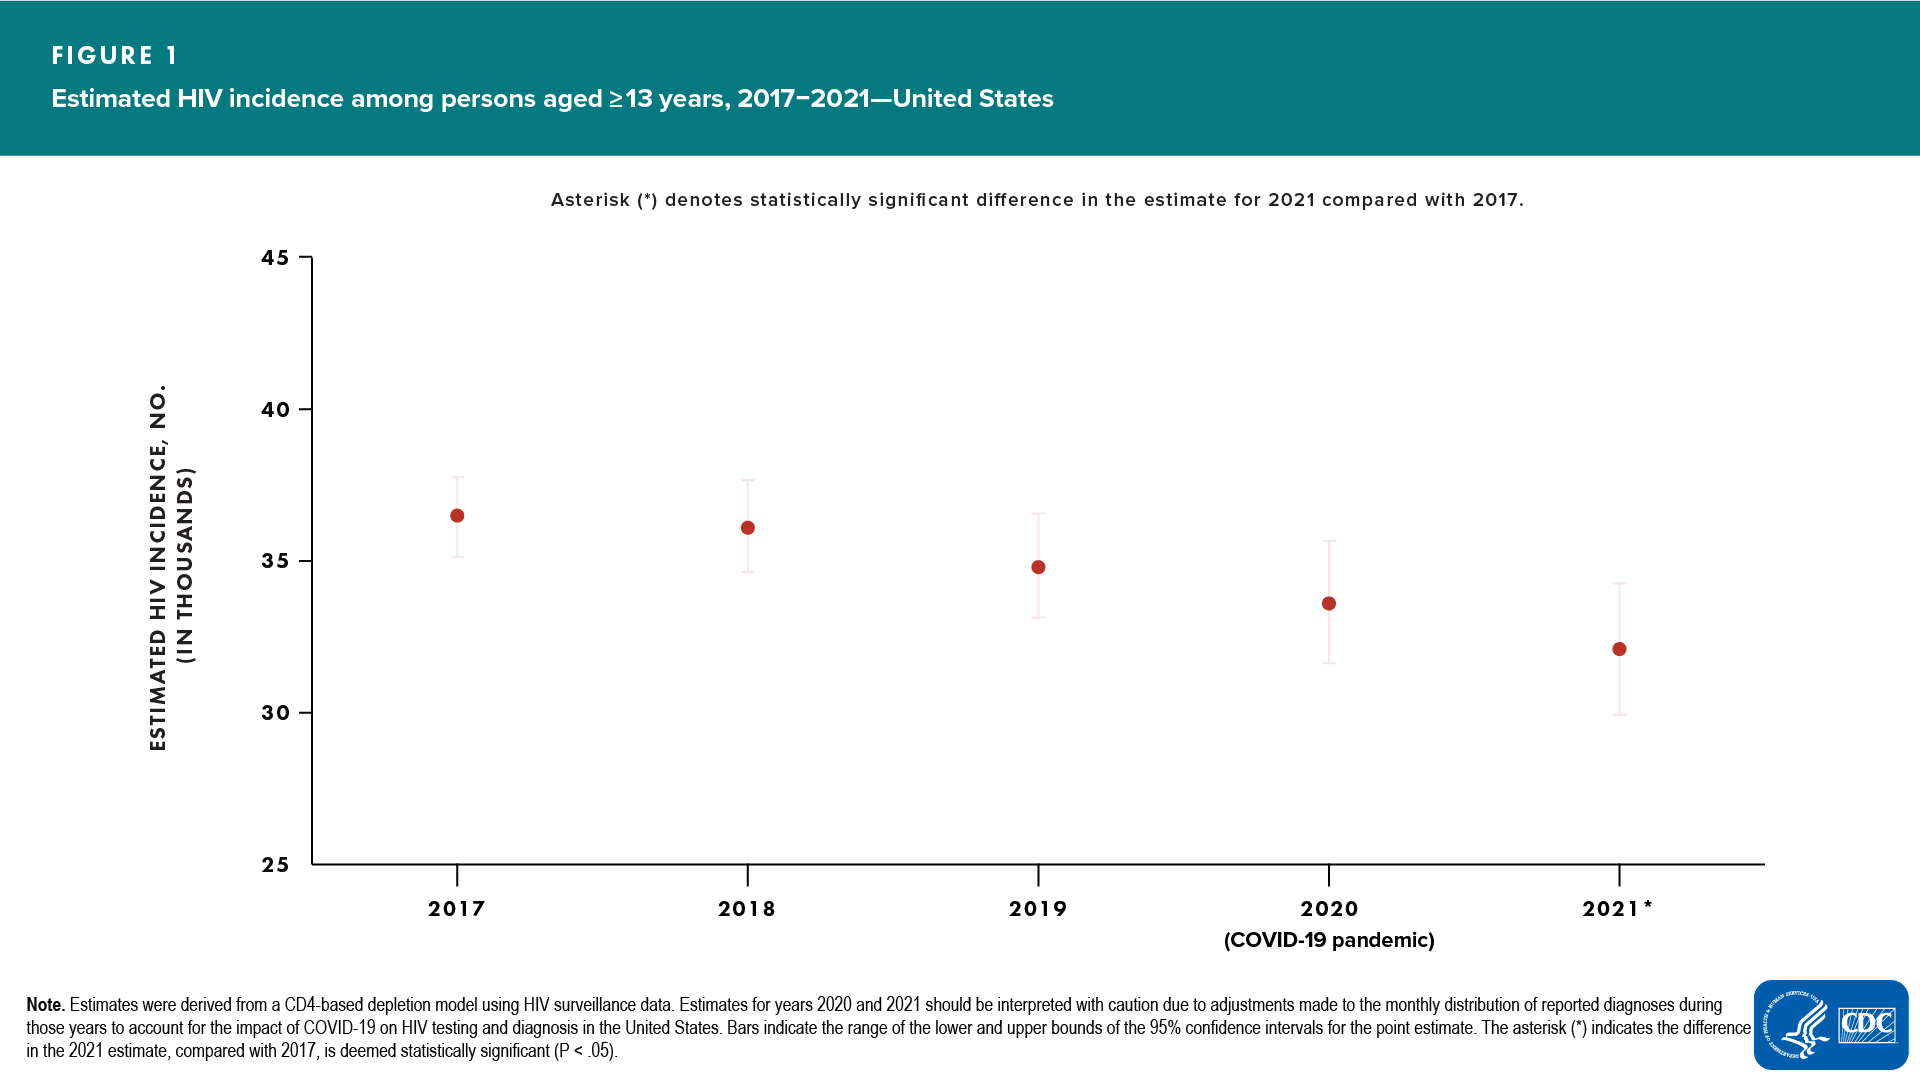
In the United States, in 2021, compared with 2017, HIV incidence decreased (12%) among persons aged ≥13 years (Table 1). In 2021, the estimated number of HIV infections was 32,100; the rate was 11.5 (Figure 1).
The annual numbers of HIV infections in 2021, compared with 2017, among persons aged ≥13 years were as follows:
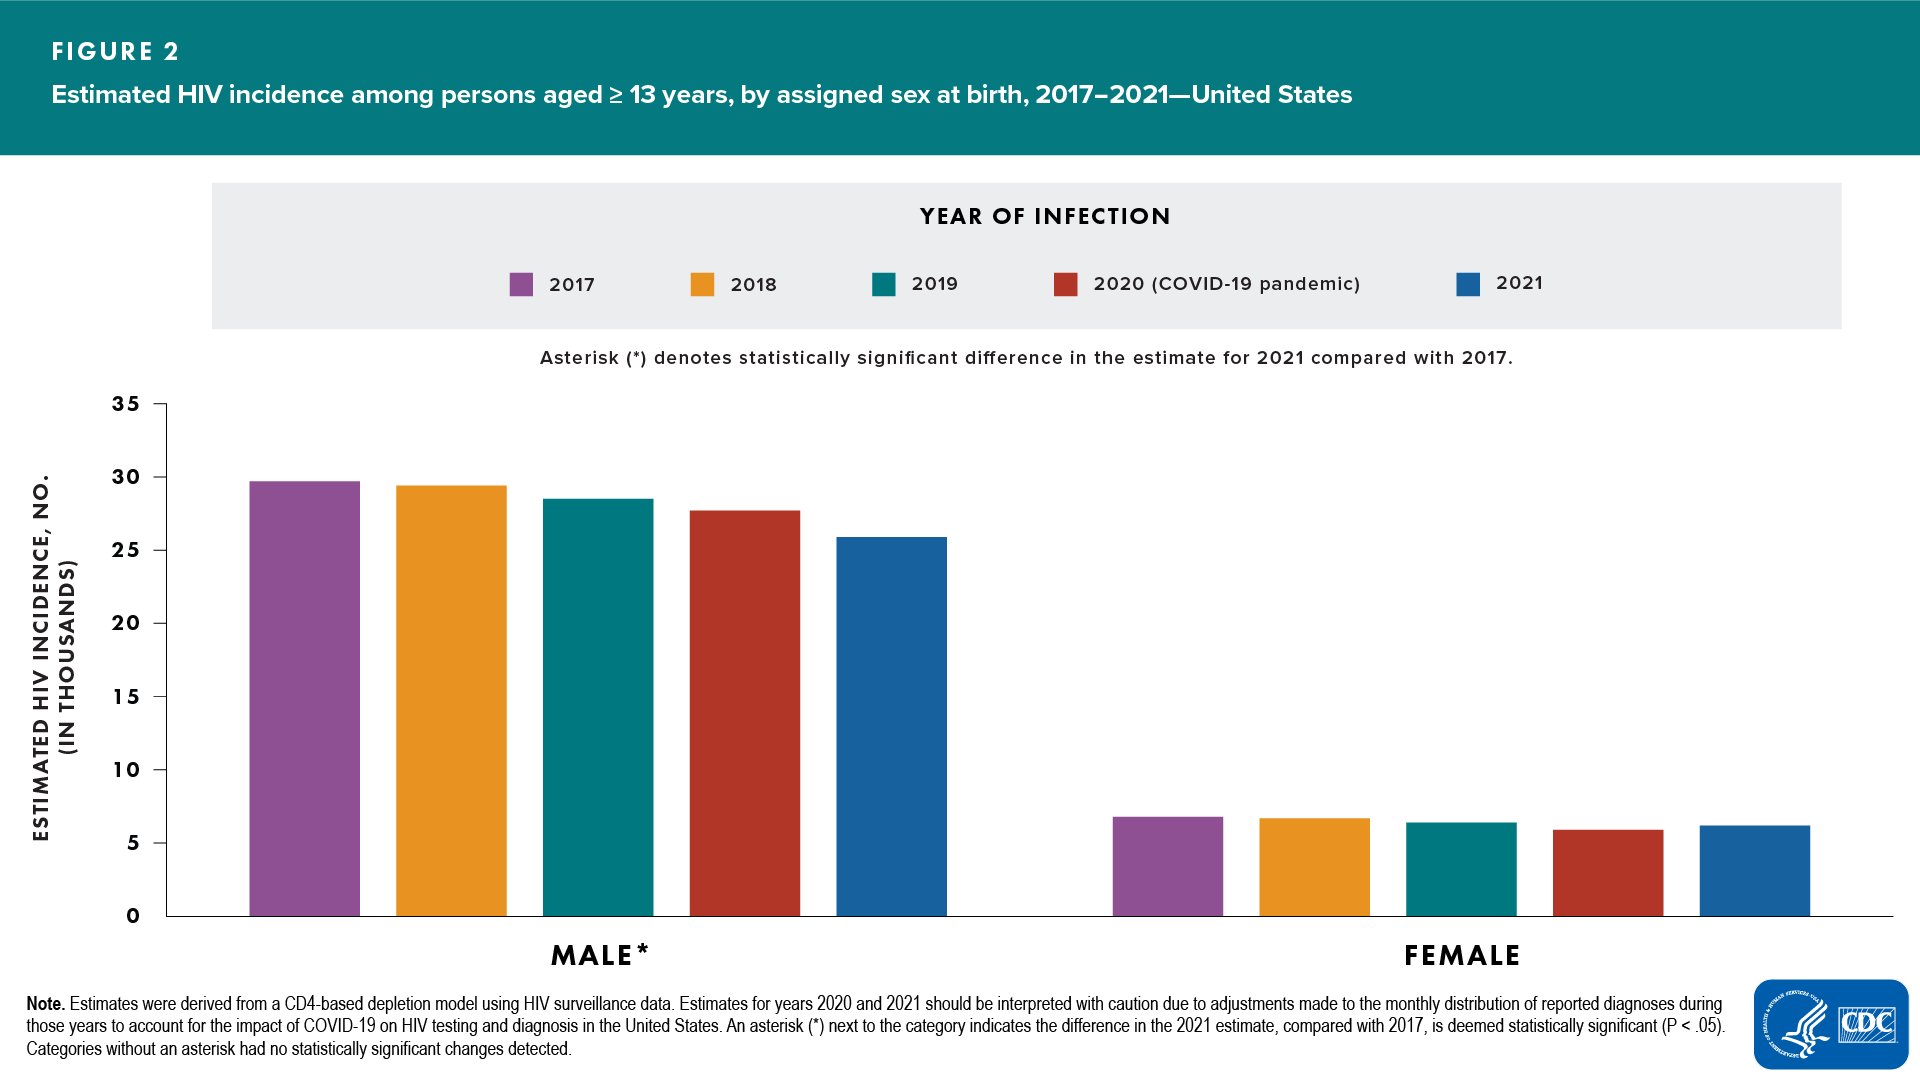
Assigned sex at birth (ASAB) (Figure 2)
- Increased—none
- Decreased—males
- No change detected—females
In 2021, the rates, by assigned sex at birth, were as follows: males, 18.8; females, 4.4.
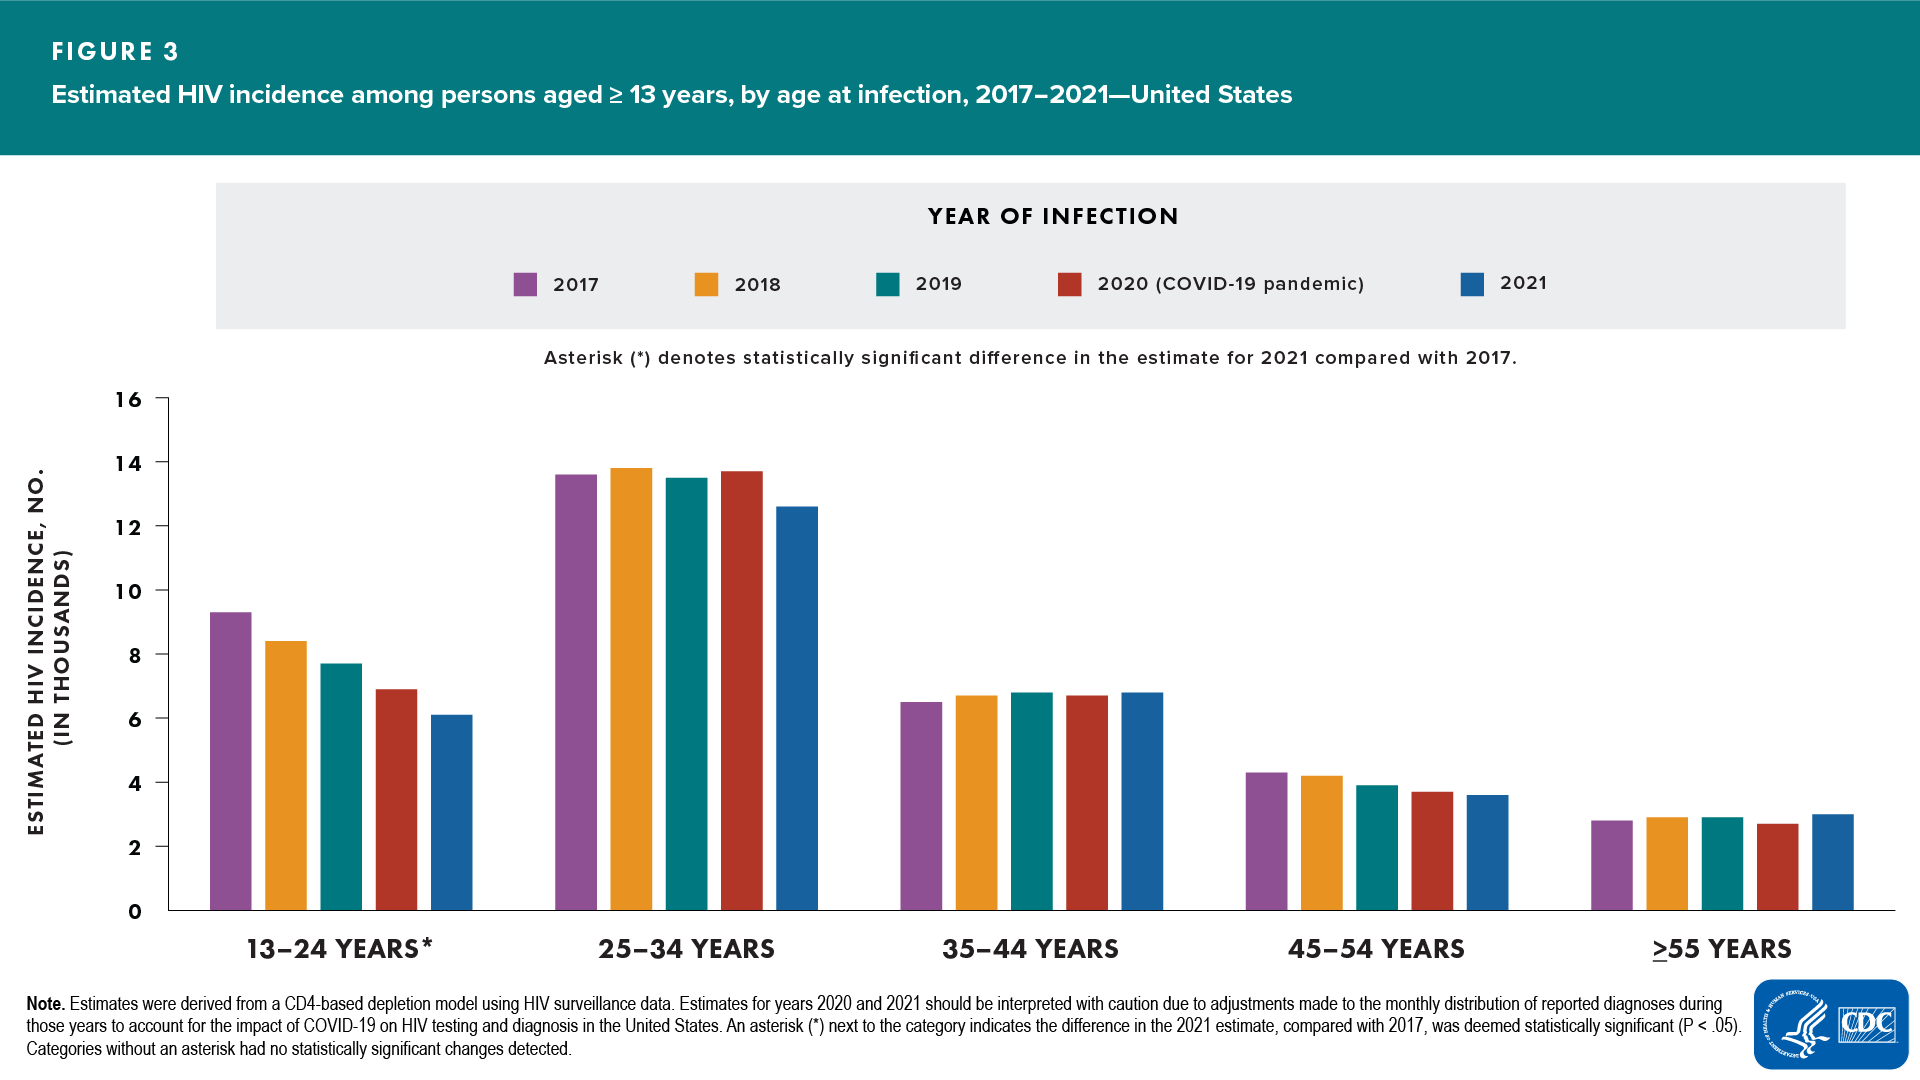
Age group (Figure 3)
- Increased—none
- Decreased—persons aged 13–24
- No change detected—persons aged 25–34, 35–44, 45–54, and ≥55 years
In 2021, the highest rates were for persons aged 25–34 (27.7), followed by persons aged 35–44 years (15.6).
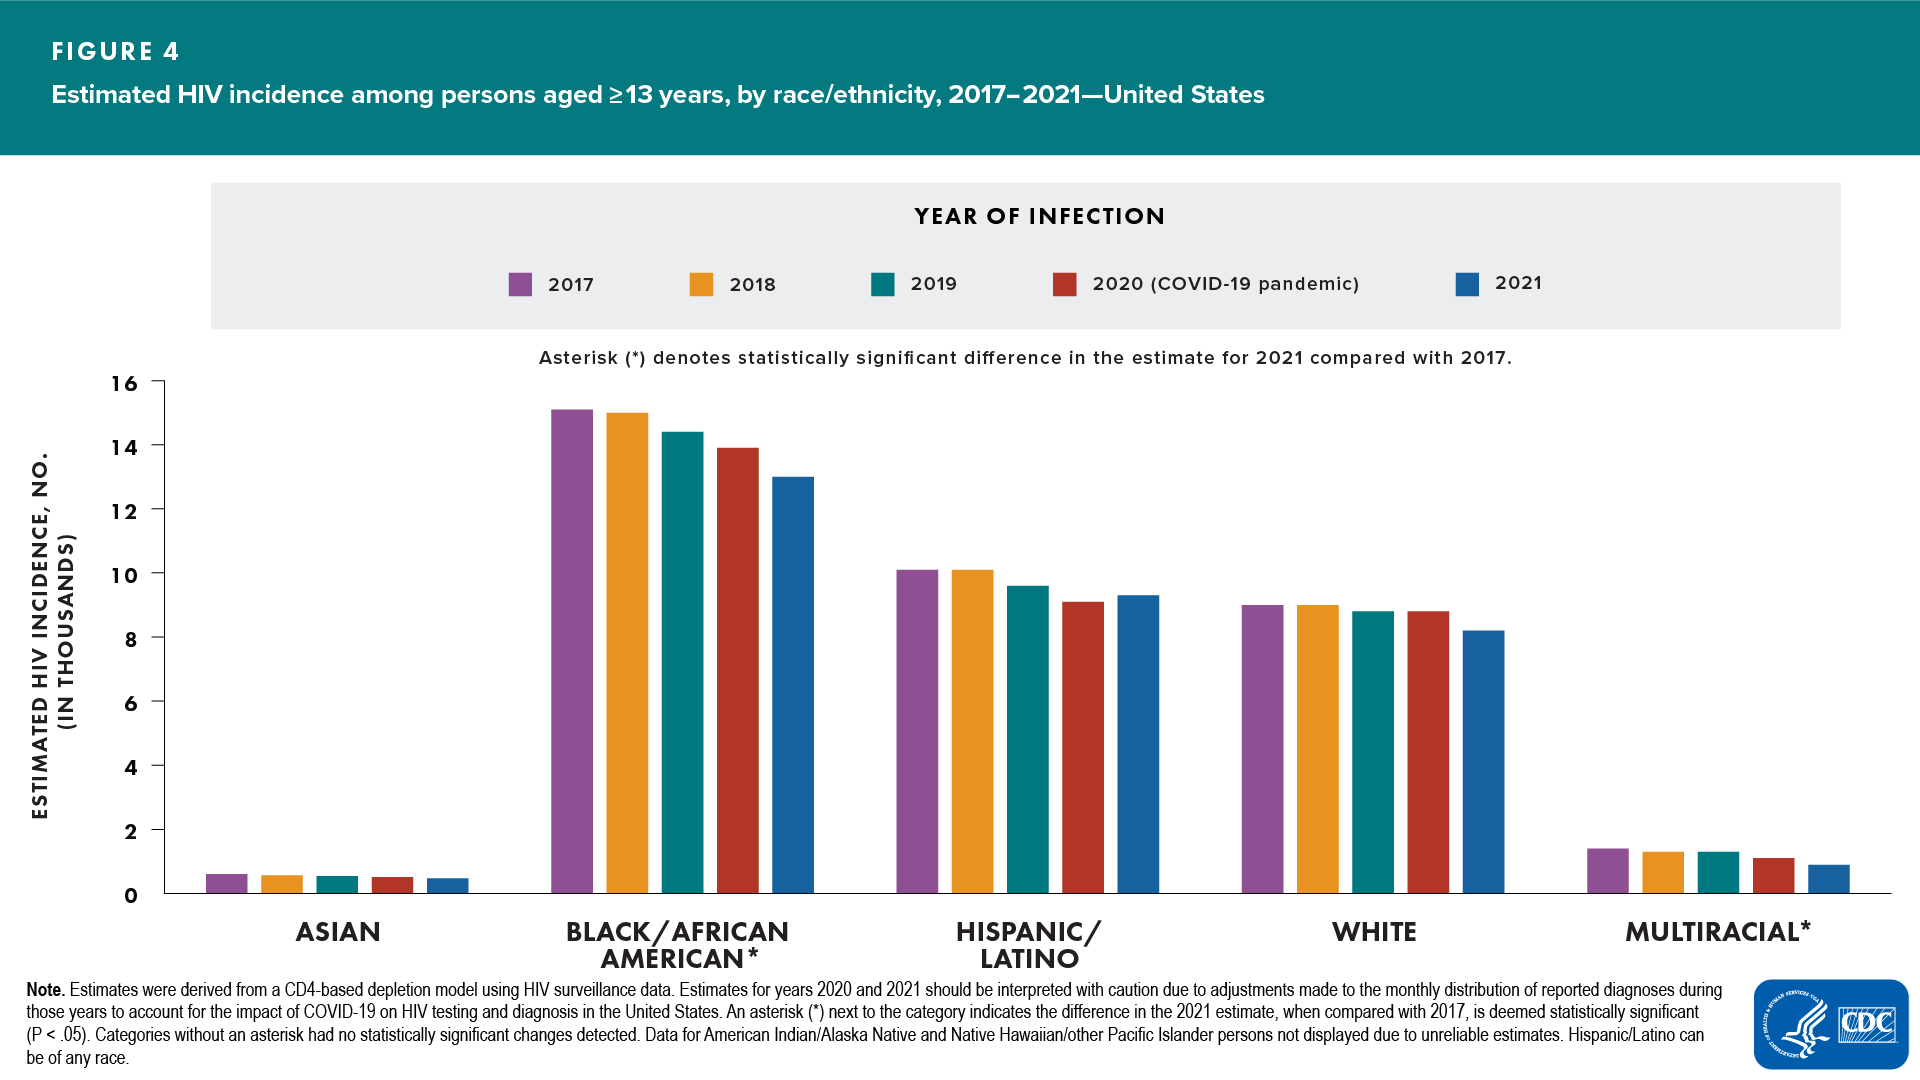
Race/ethnicity (Figure 4)
- Increased—none
- Decreased—Black/African American and multiracial persons
- No change detected—American Indian/Alaska Native, Asian, Hispanic/Latino, Native Hawaiian/other Pacific Islander, and White persons
In 2021, the highest rates were among Black/African American (37.3), Hispanic/Latino (18.9), and multiracial (17.0) persons.
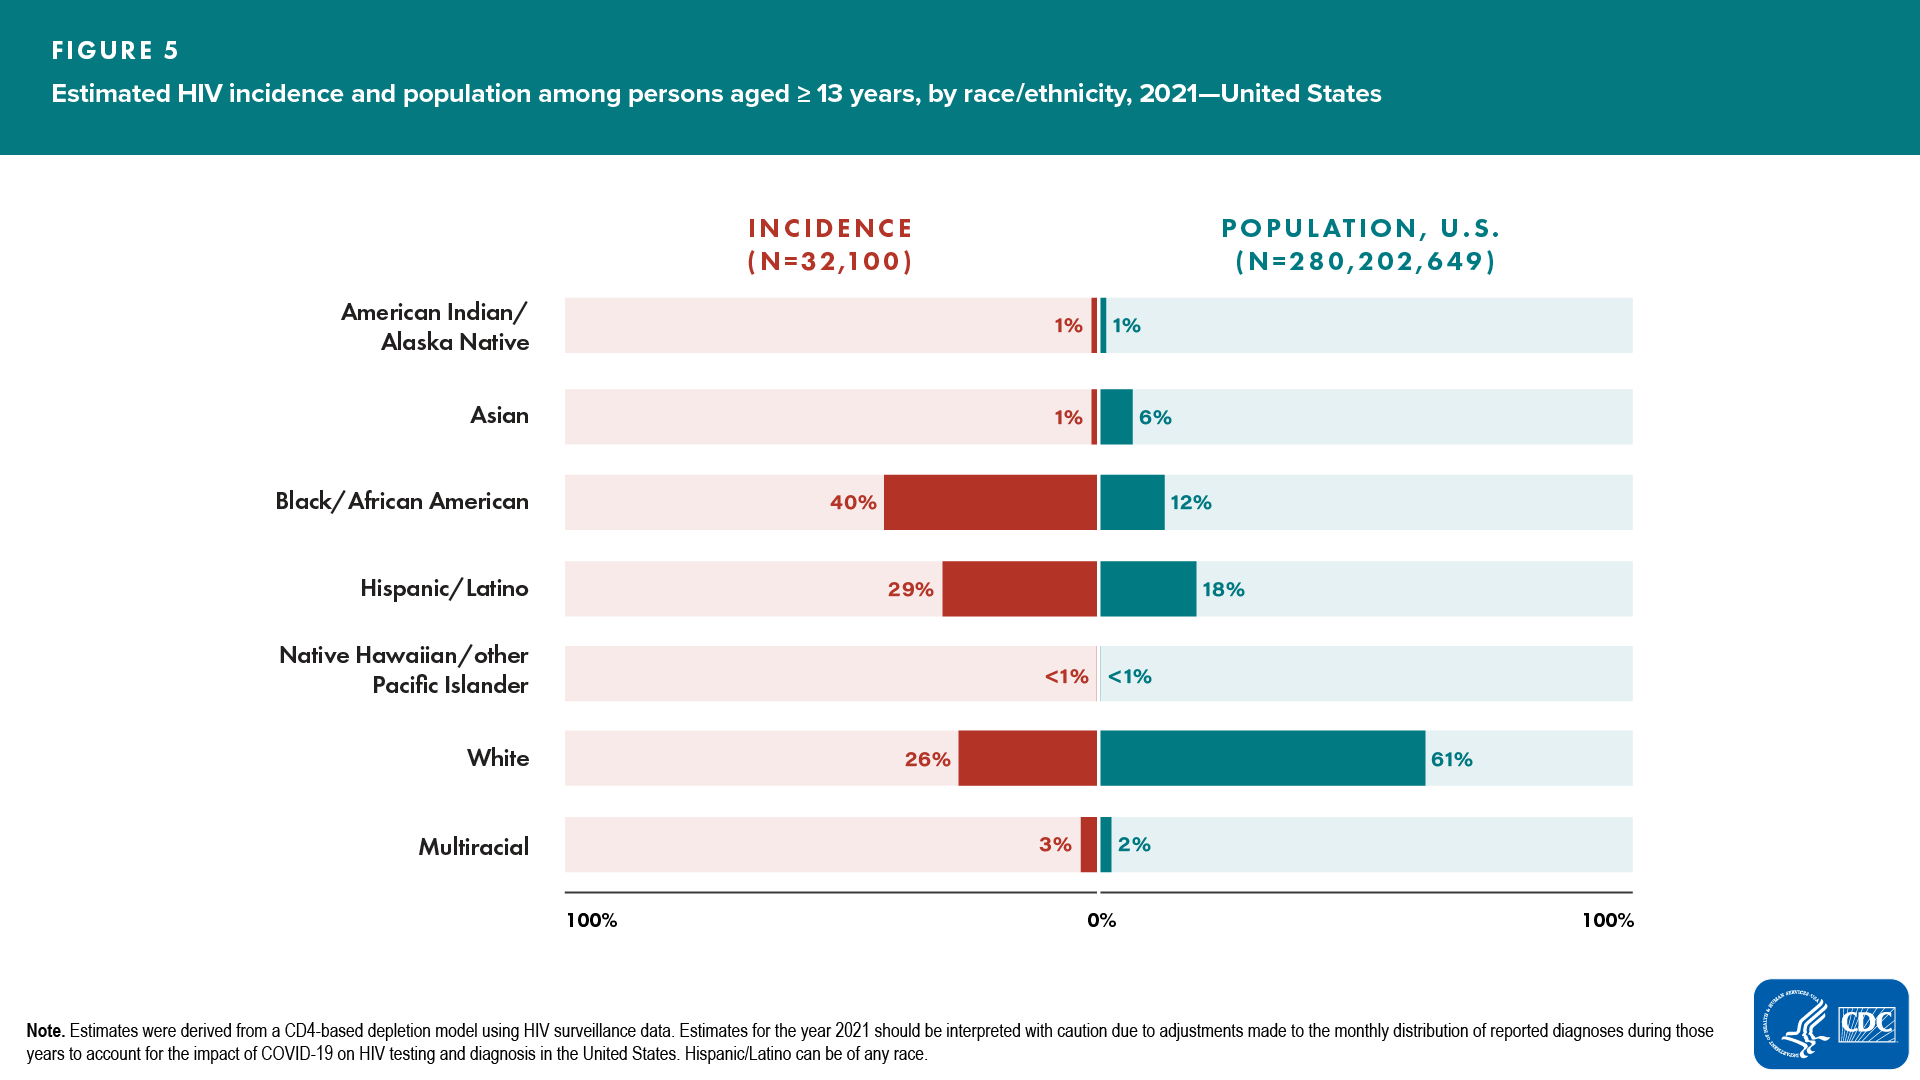
In 2021, Black/African American persons made up approximately 12% of the population of the United States but accounted for 40% of new HIV infections. White persons made up 61% of the population of the United States but accounted for 26% of new HIV infections. Hispanic/Latino persons made up 18% of the population of the United States but accounted for 29% of HIV infections (Figure 5).
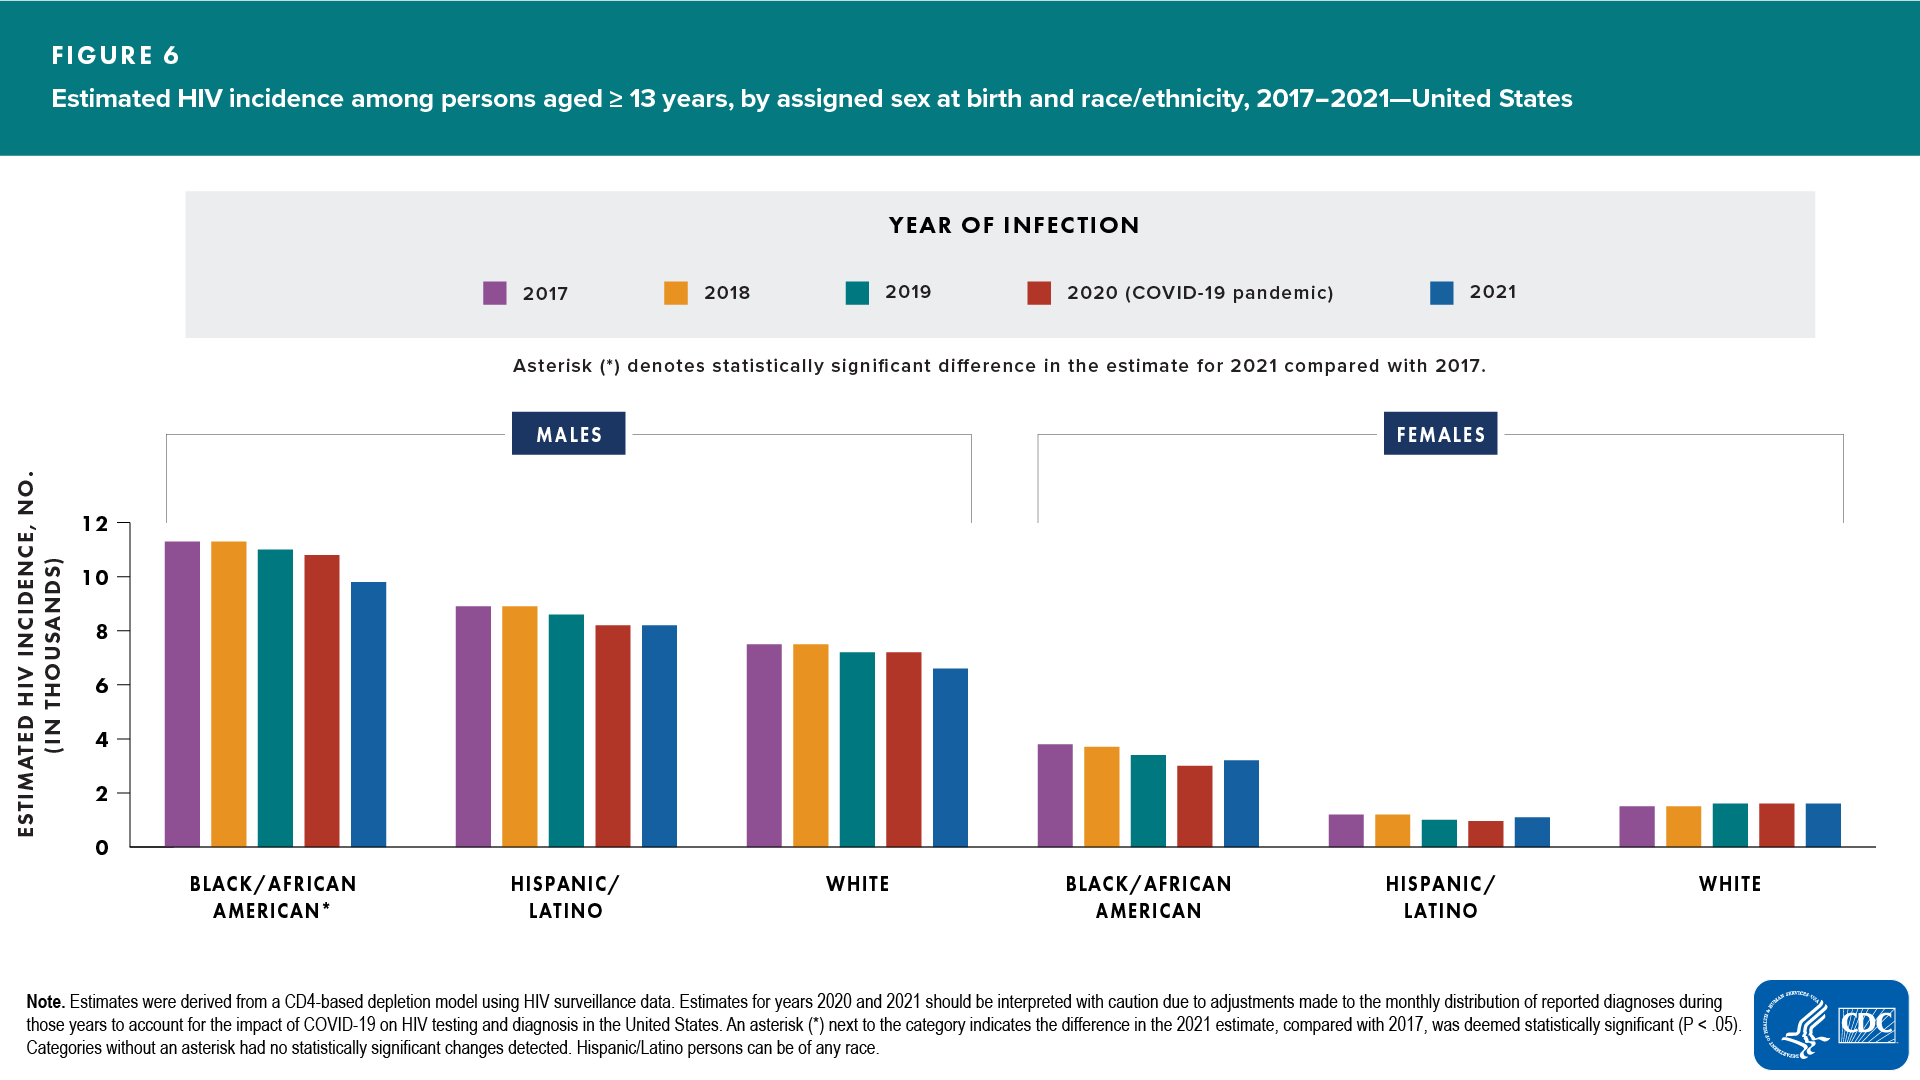
ASAB and race/ethnicity (Figure 6)
- Among males:
- Increased—none
- Decreased—Black/African American
- No change detected—Hispanic/Latino and White
- Among females:
- Increased—none
- Decreased—none
- No change detected—Black/African American, Hispanic/Latino, and White
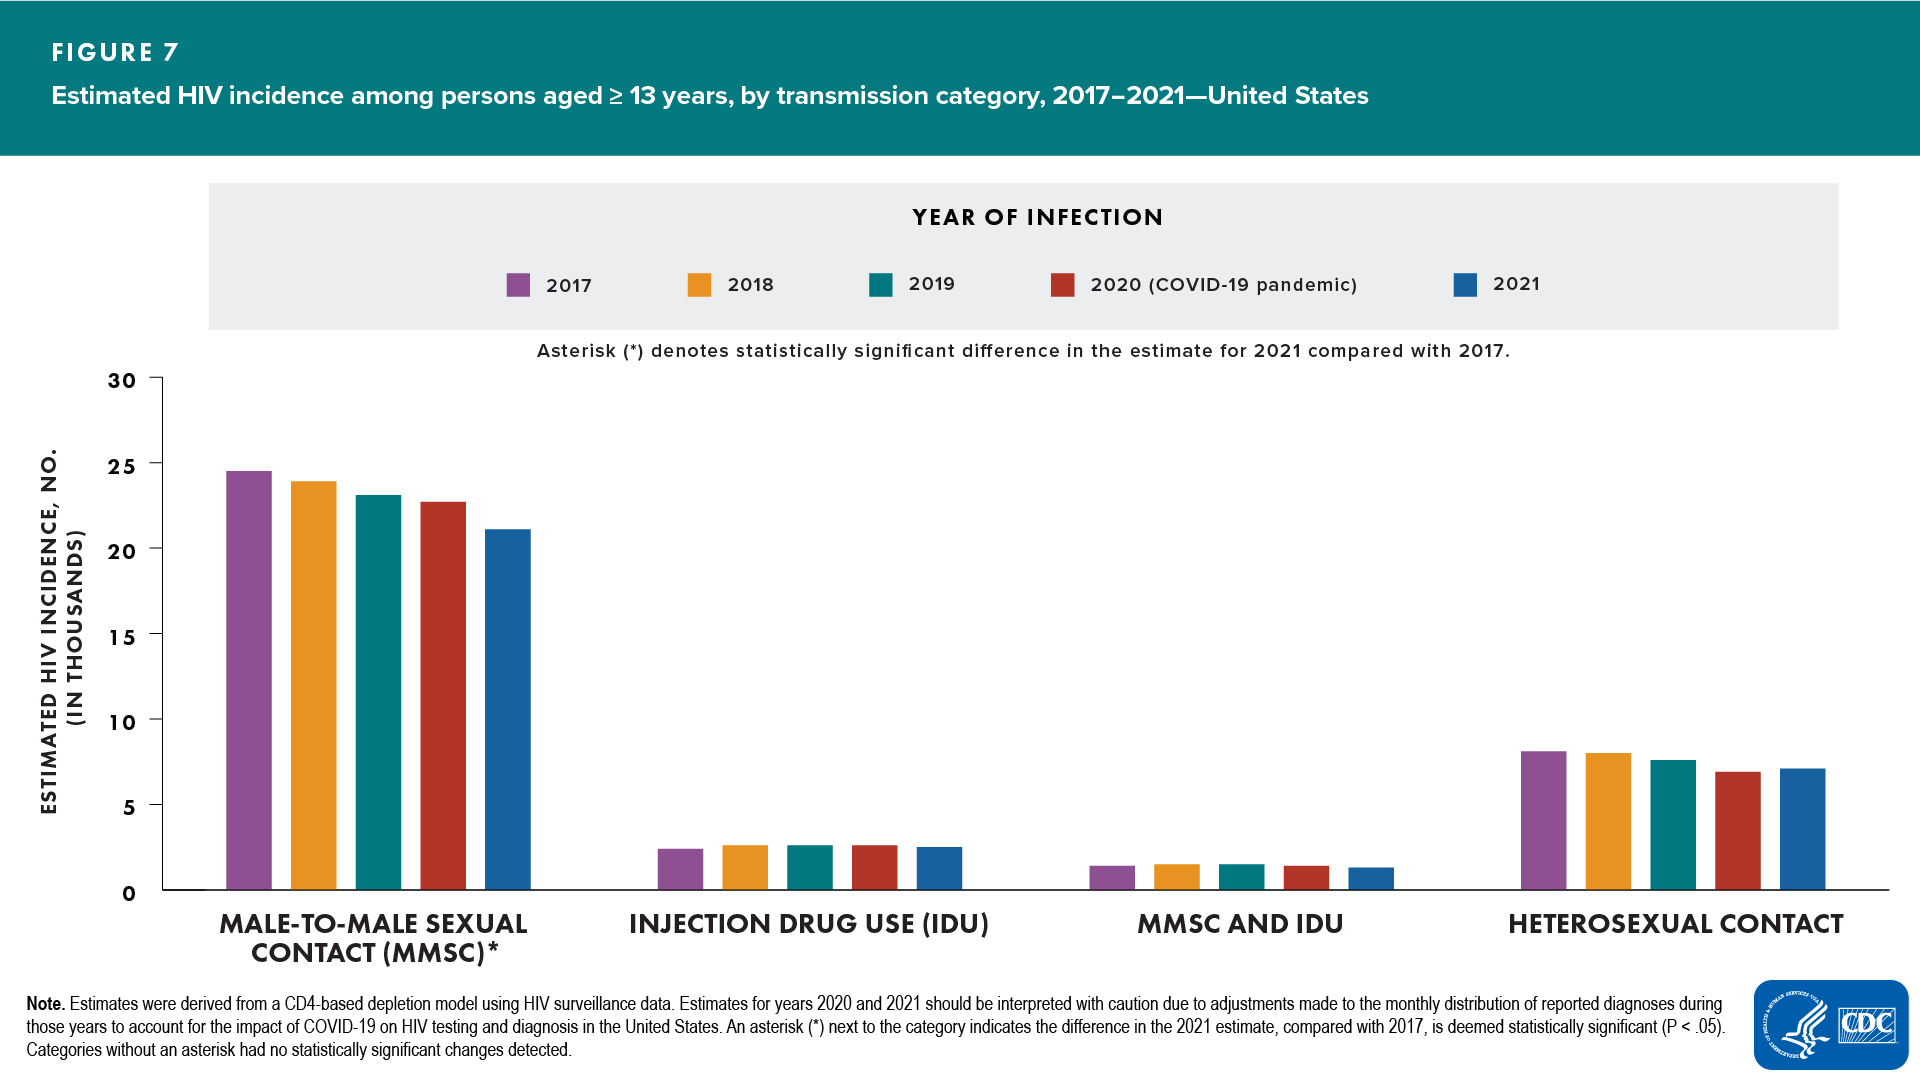
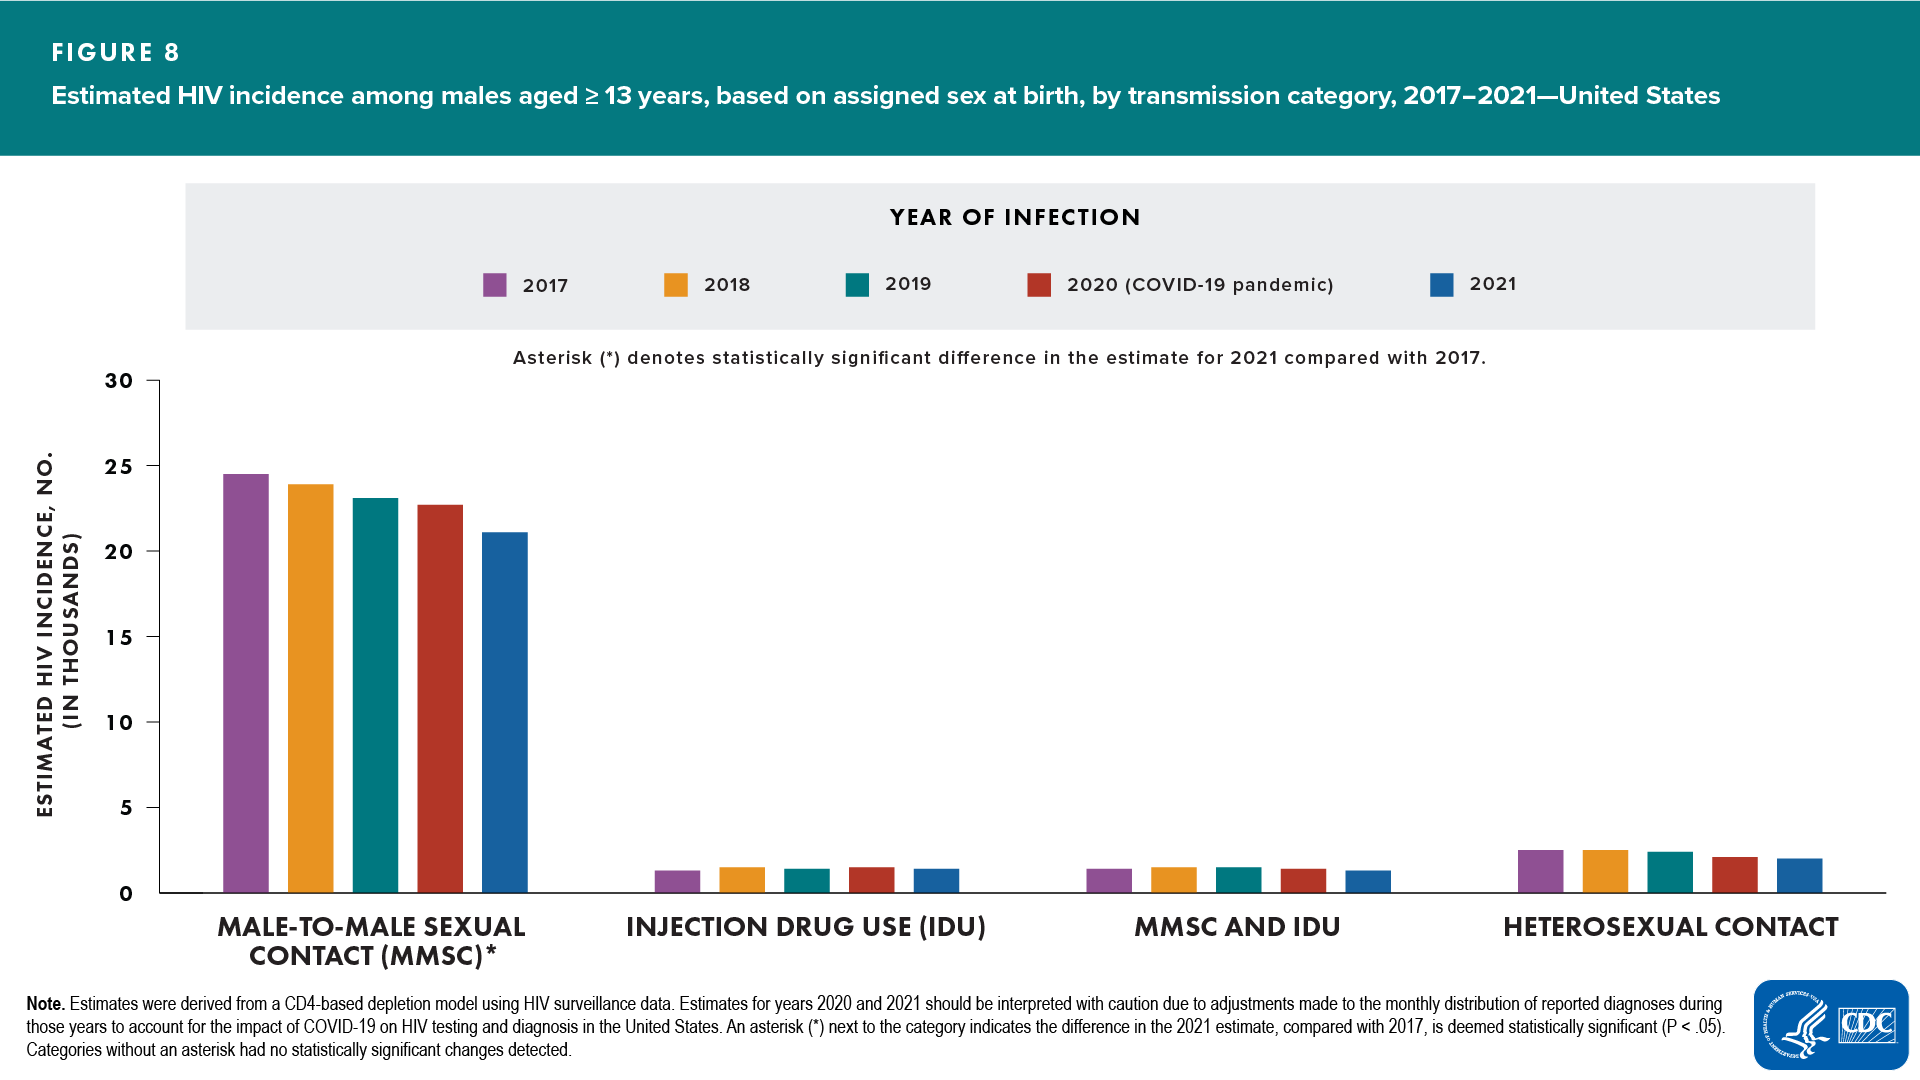
ASAB and transmission category (Figures 7, 8, and 9)
- Overall (Figure 7)
- Increased—none
- Decreased—infections attributed to male-to-male sexual contact (MMSC)
- No change detected—infections attributed to injection drug use (IDU), MMSC and IDU, or heterosexual contact
- Male (Figure 8)
- Increased—none
- Decreased—MMSC
- No change detected—all other transmission categories
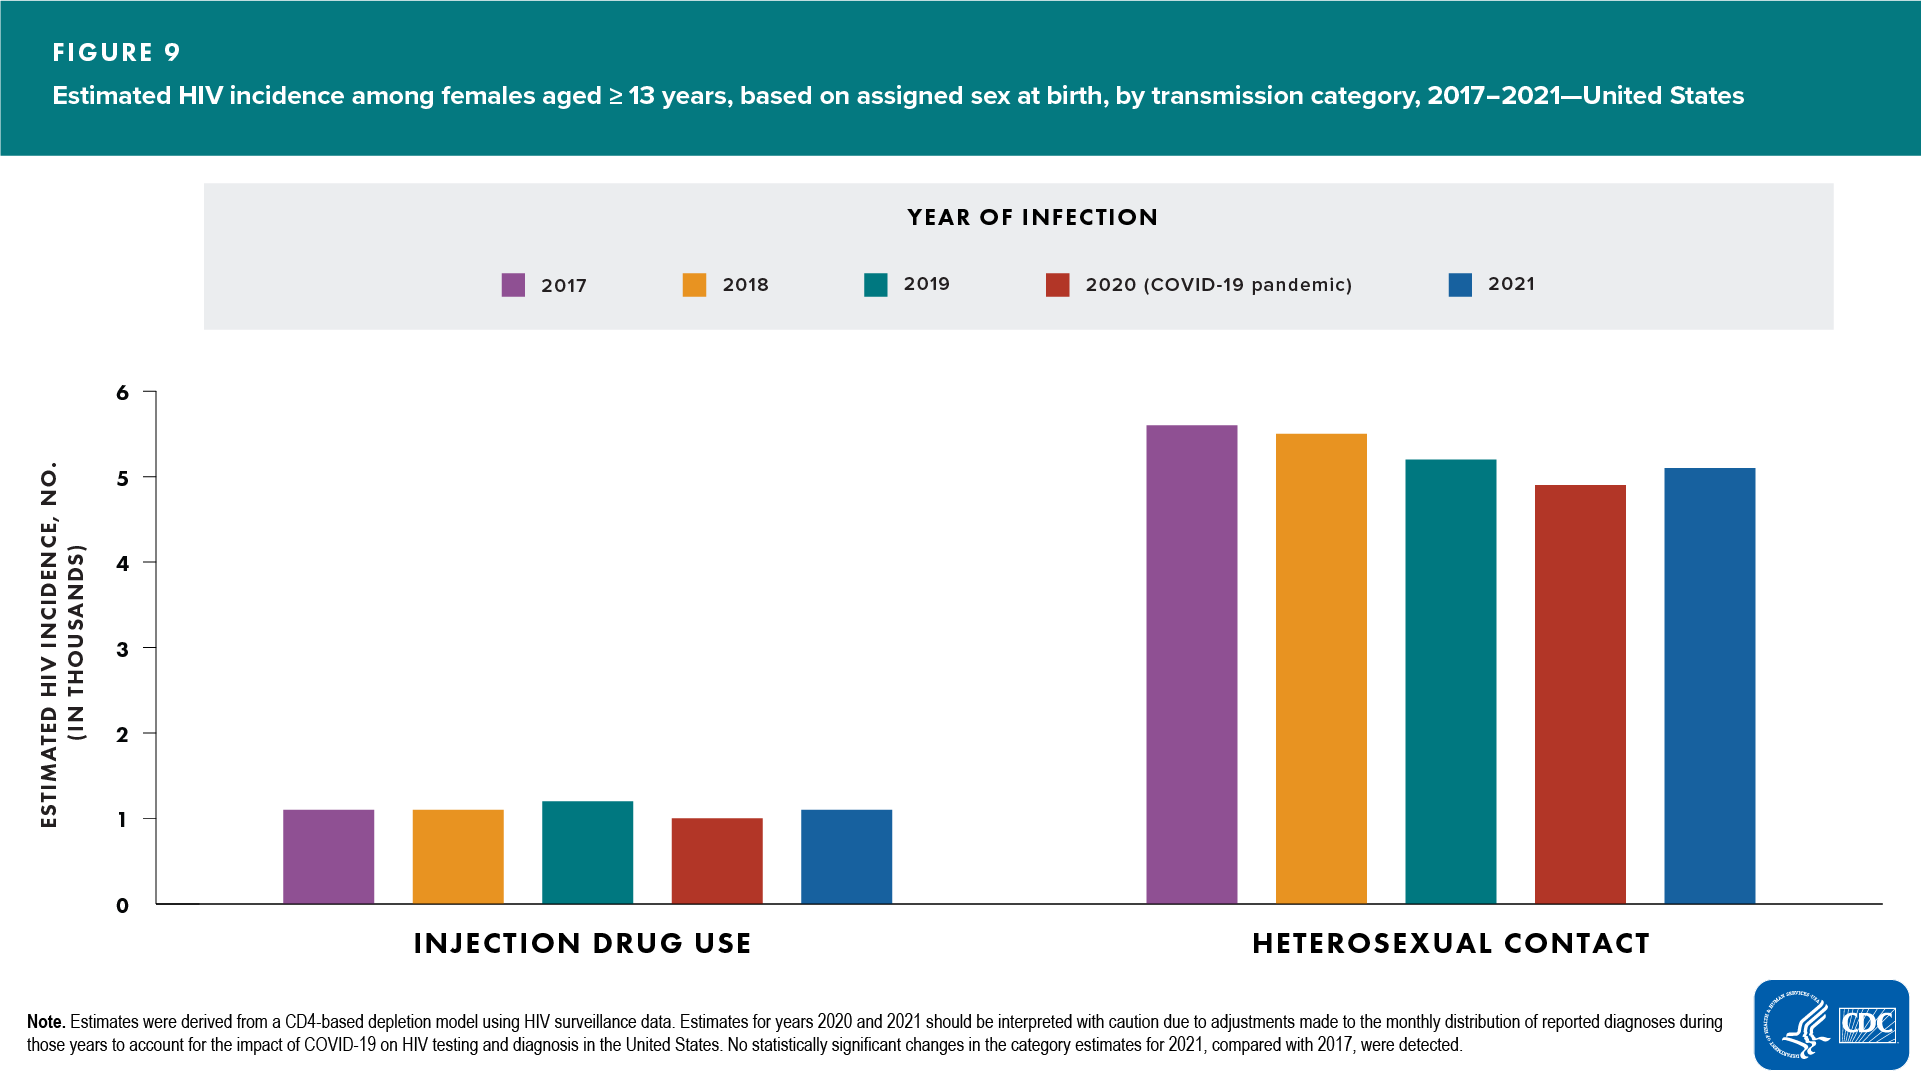
- Female (Figure 9)
- Increased—none
- Decreased—none
- No change detected—all transmission categories
In 2021, the largest percentages were, for males, infections attributed to MMSC (81%) and, for females, infections attributed to heterosexual contact (82%).
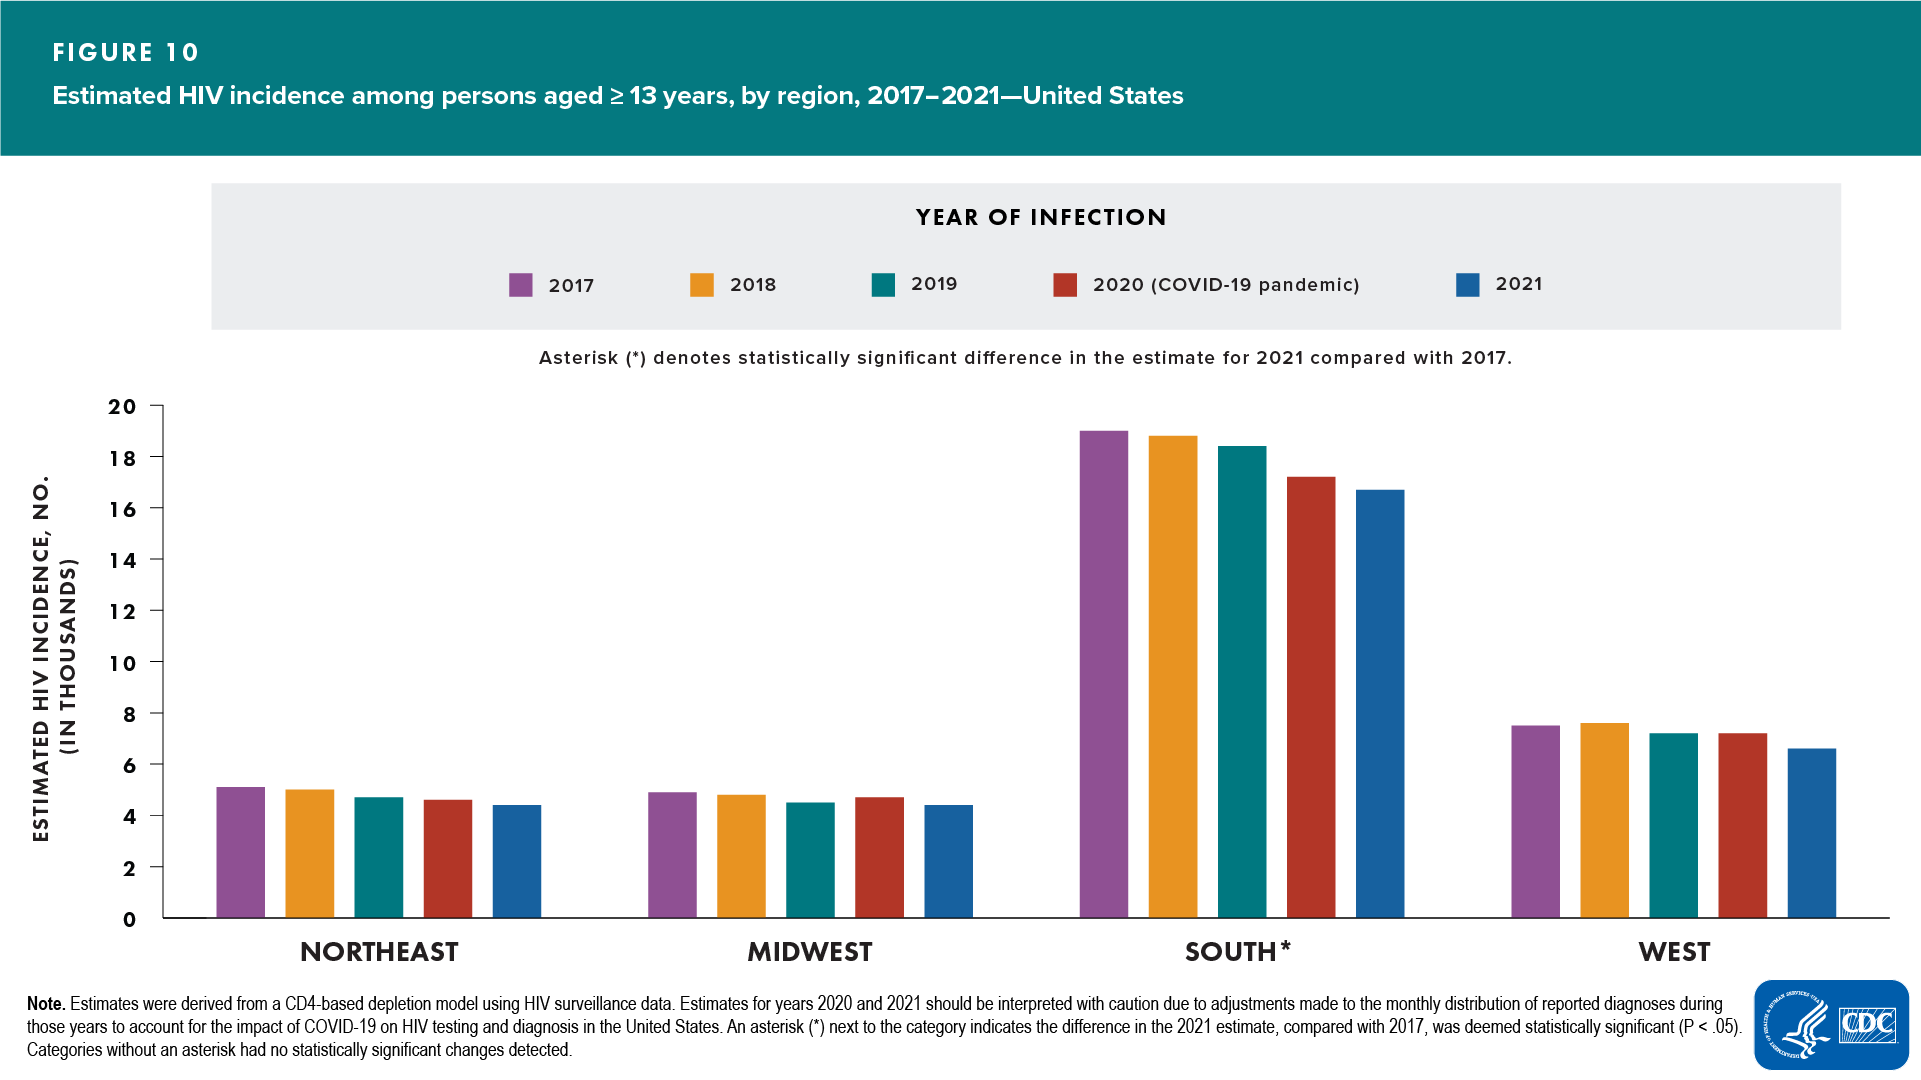
Region (Figure 10)
- Increased—none
- Decreased—South
- No change detected—Northeast, Midwest, and West
In 2021, the rates, by region, were as follows: South, 15.6; West, 10.0; Northeast, 9.0; Midwest, 7.6.
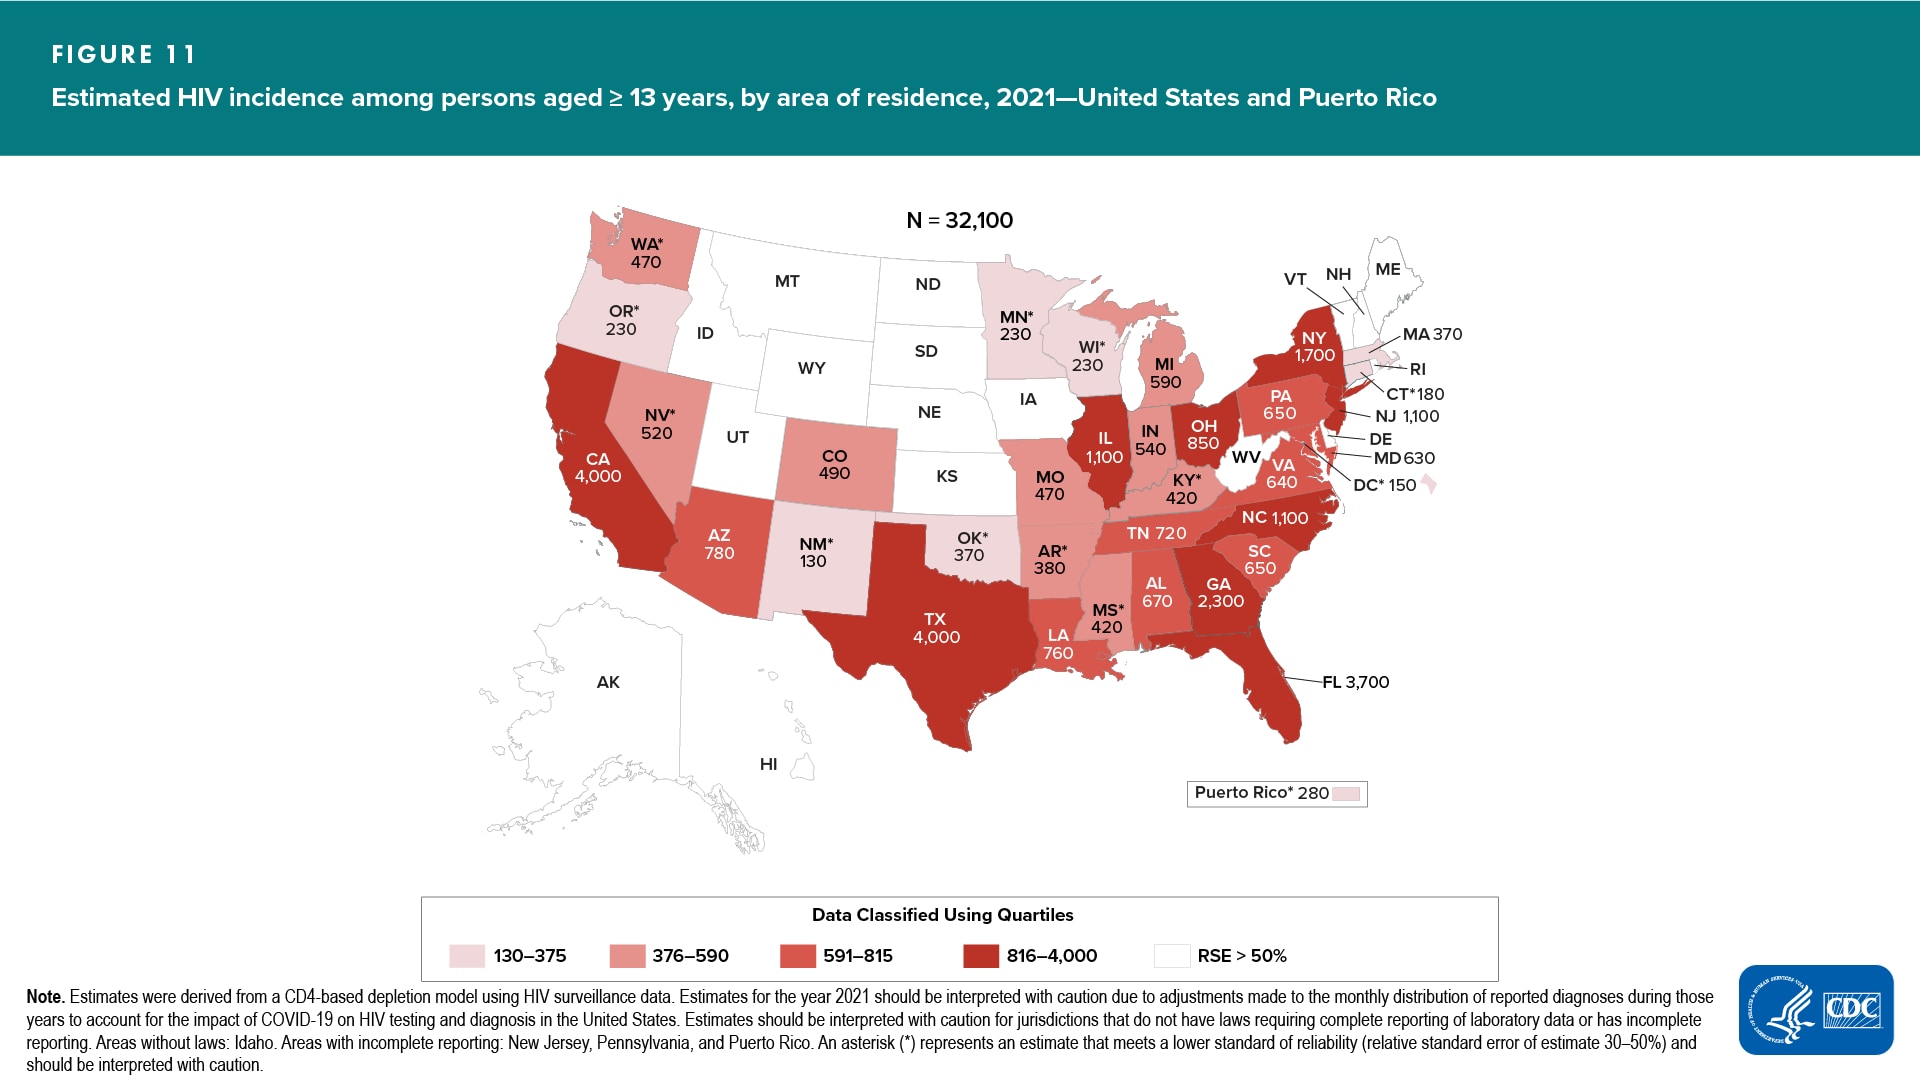
Area of residence (Figure 11)
- Increased—none
- Decreased—none
- No change detected—all
In 2021, estimates in 22 areas were statistically reliable (RSEs of <30%; see Technical Notes for more information on the RSE). In 2021, compared to 2017, no changes were detected in the estimated annual number of HIV infections for all areas with reliable estimates (RSEs of <30%) (Table 6).
To guide prevention efforts, states with estimates with RSEs≥30% should refer to HIV diagnosis data in the 2021 HIV Surveillance Report. (See also the section Reliability in Technical Notes.)
HIV Incidence by Race/Ethnicity
Black/African American Persons
In 2021, HIV incidence among Black/African American persons in the United States was as follows:
- Decreased when compared with 2017 (Table 2)
- Accounted for 40% of all HIV infections (Table 1)
- 62% were attributed to MMSC, and 32% were attributed to heterosexual contact (Table 2)
- Rate for Black/African American persons (37.3) was more than 7 times the rate for White persons (4.8) (Table 1)
- Rate for Black/African American males (59.2) was more than 3 times the rate for Black/African American females (17.5) (Table 2)
- Among all Black/African American persons, males accounted for 75% of HIV infections, most of which (83%) were attributed to MMSC
Black/African American males
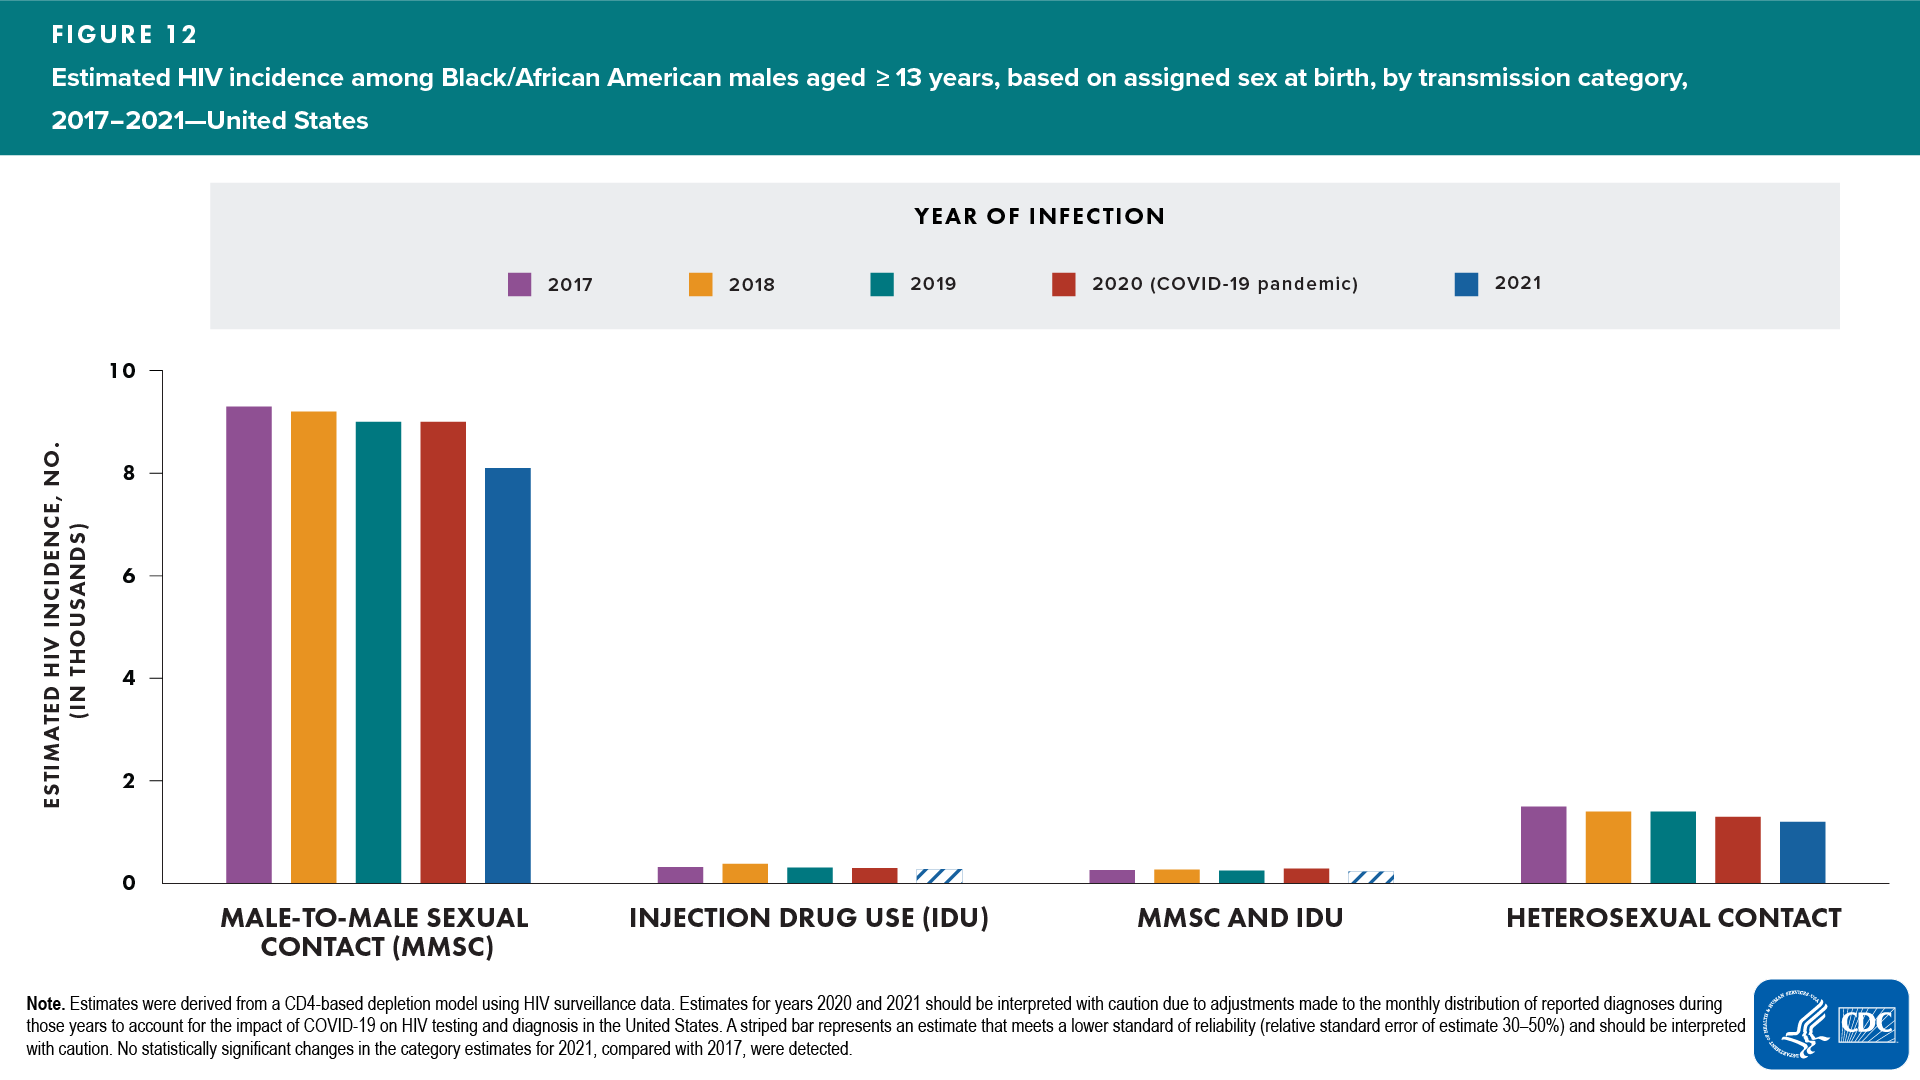
Among Black/African American males, the annual number of HIV infections in 2021, compared with 2017, decreased overall. Annual numbers of HIV infections in 2021, compared with 2017, were as follows:
- Age at infection—decreased: aged 13–24 years; no change detected: all other age groups (Table 2)
- Transmission category—no change detected: MMSC and heterosexual contact (Figure 12 and Table 2)
Note. Estimates for all other transmission category groups had RSEs of 30%–50% (interpret with caution).
In 2021, among Black/African American males, the percentages and rates of HIV infections were as follows:
- Largest percentages: aged 25–34 (41%) and 13–24 years (29%) (Table 2)
- Percentage of Black/African American males aged 13–24 years (29%) was higher than Hispanic/Latino (18%) and White (11%) males in the same age group (Table 3)
- Rate for Black/African American males (59.2) (Table 2) was nearly 8 times the rate for White (7.8) (Table 4) and nearly twice the rate for Hispanic/Latino males (32.9) (Table 3)
Black/African American females
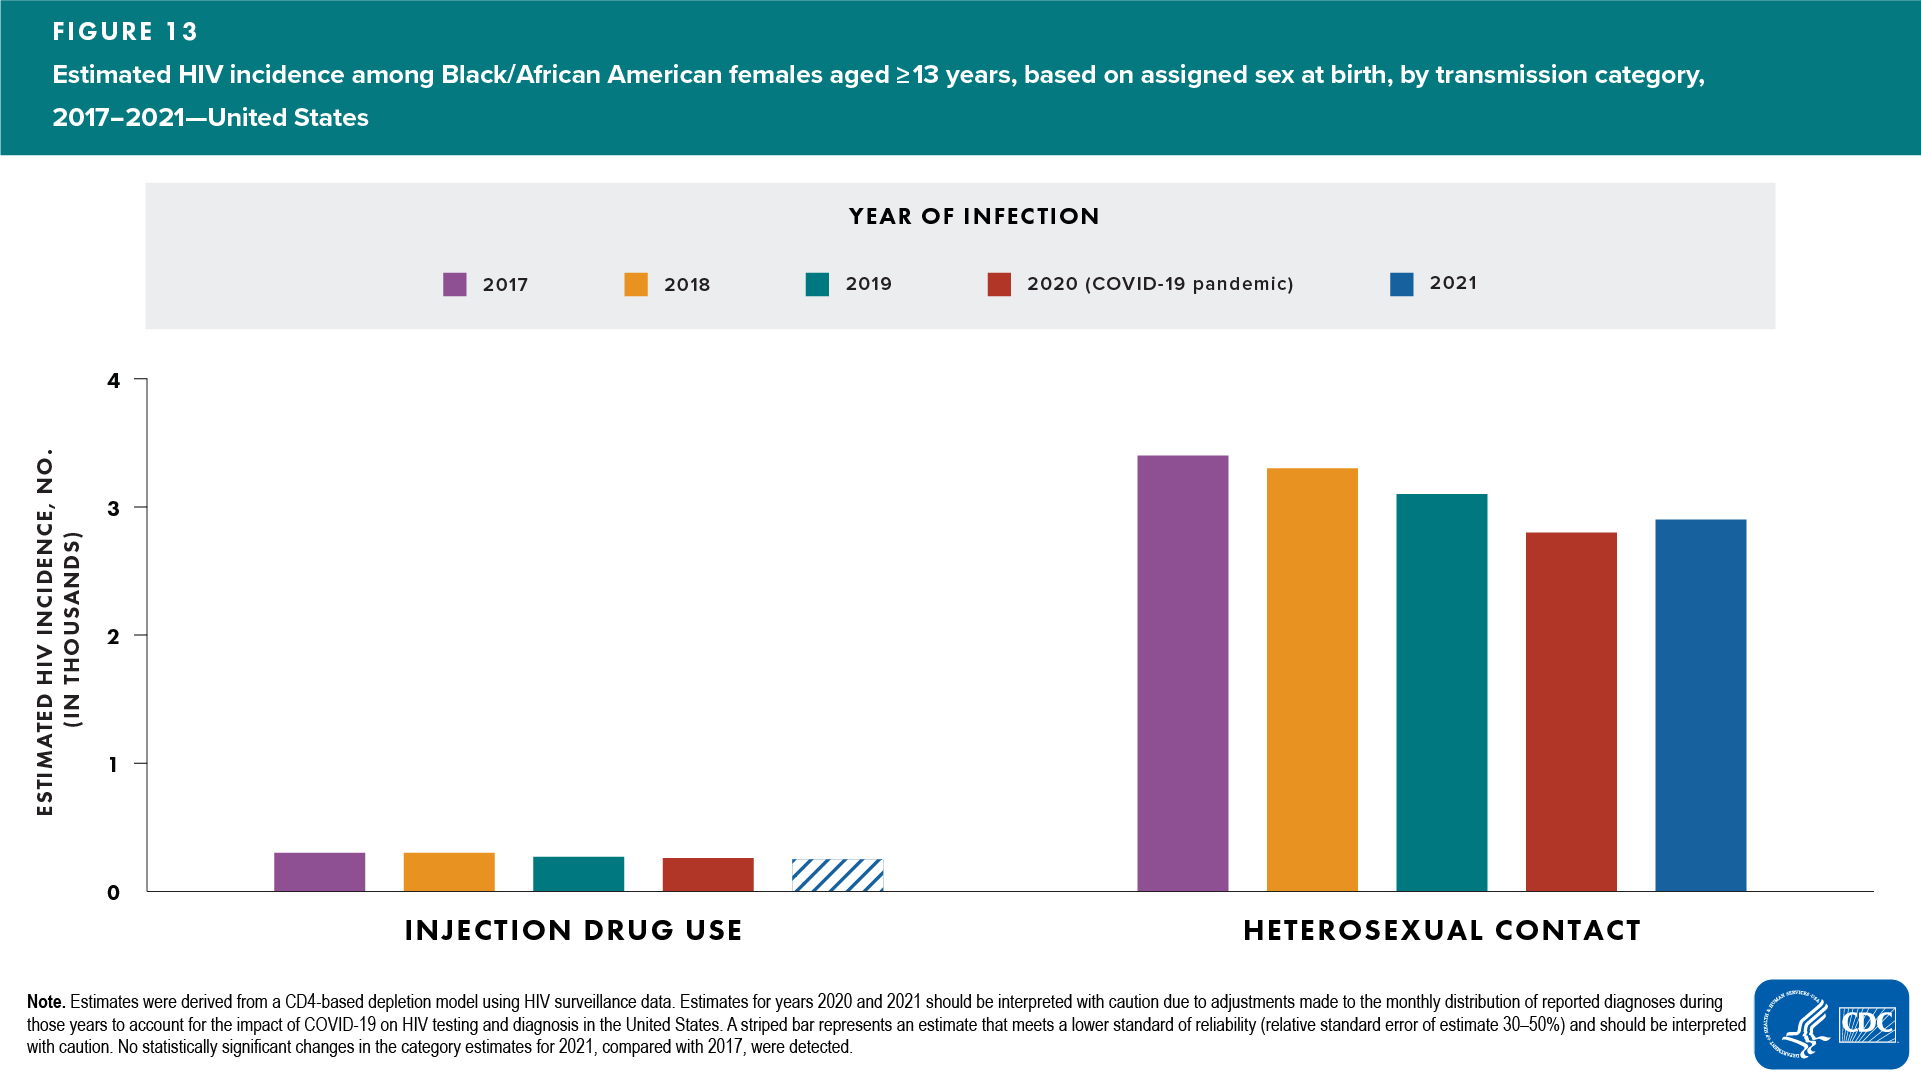
Among Black/African American females, no changes were detected in the annual number of HIV infections in 2021, compared with 2017. Annual numbers of HIV infections in 2021, compared with 2017, were as follows:
- Age at infection—no change detected: all age groups
- Transmission category—no change detected: heterosexual contact; injection drug use category had RSE of 30%–50% (interpret with caution) (Figure 13 and Table 2)
In 2021, among Black/African American females, the percentages and rates of HIV infections were as follows:
- Largest percentage: 91% of infections were attributed to heterosexual contact
Rate for Black/African American females (17.5) (Table 2) was 10 times the rate for White (1.8) (Table 4) and 4 times the rate for Hispanic/Latino females (4.6) (Table 3)
Hispanic/Latino Persons
In 2021, HIV incidence among Hispanic/Latino persons was as follows:
- No change was detected when compared with 2017 (Table 3)
- Accounted for 29% of all HIV infections (Table 1)
- 77% were attributed to MMSC, and 16% were attributed to heterosexual contact (Table 3)
- Rate for Hispanic/Latino persons (18.9) was 4 times the rate for White persons (4.8) (Table 1)
- Rate for Hispanic/Latino males (32.9) was 7 times the rate for Hispanic/Latino females (4.6) (Table 3)
- Among all Hispanic/Latino persons, males accounted for 89% of HIV infections, most of which (88%) were attributed to MMSC.
Hispanic/Latino males
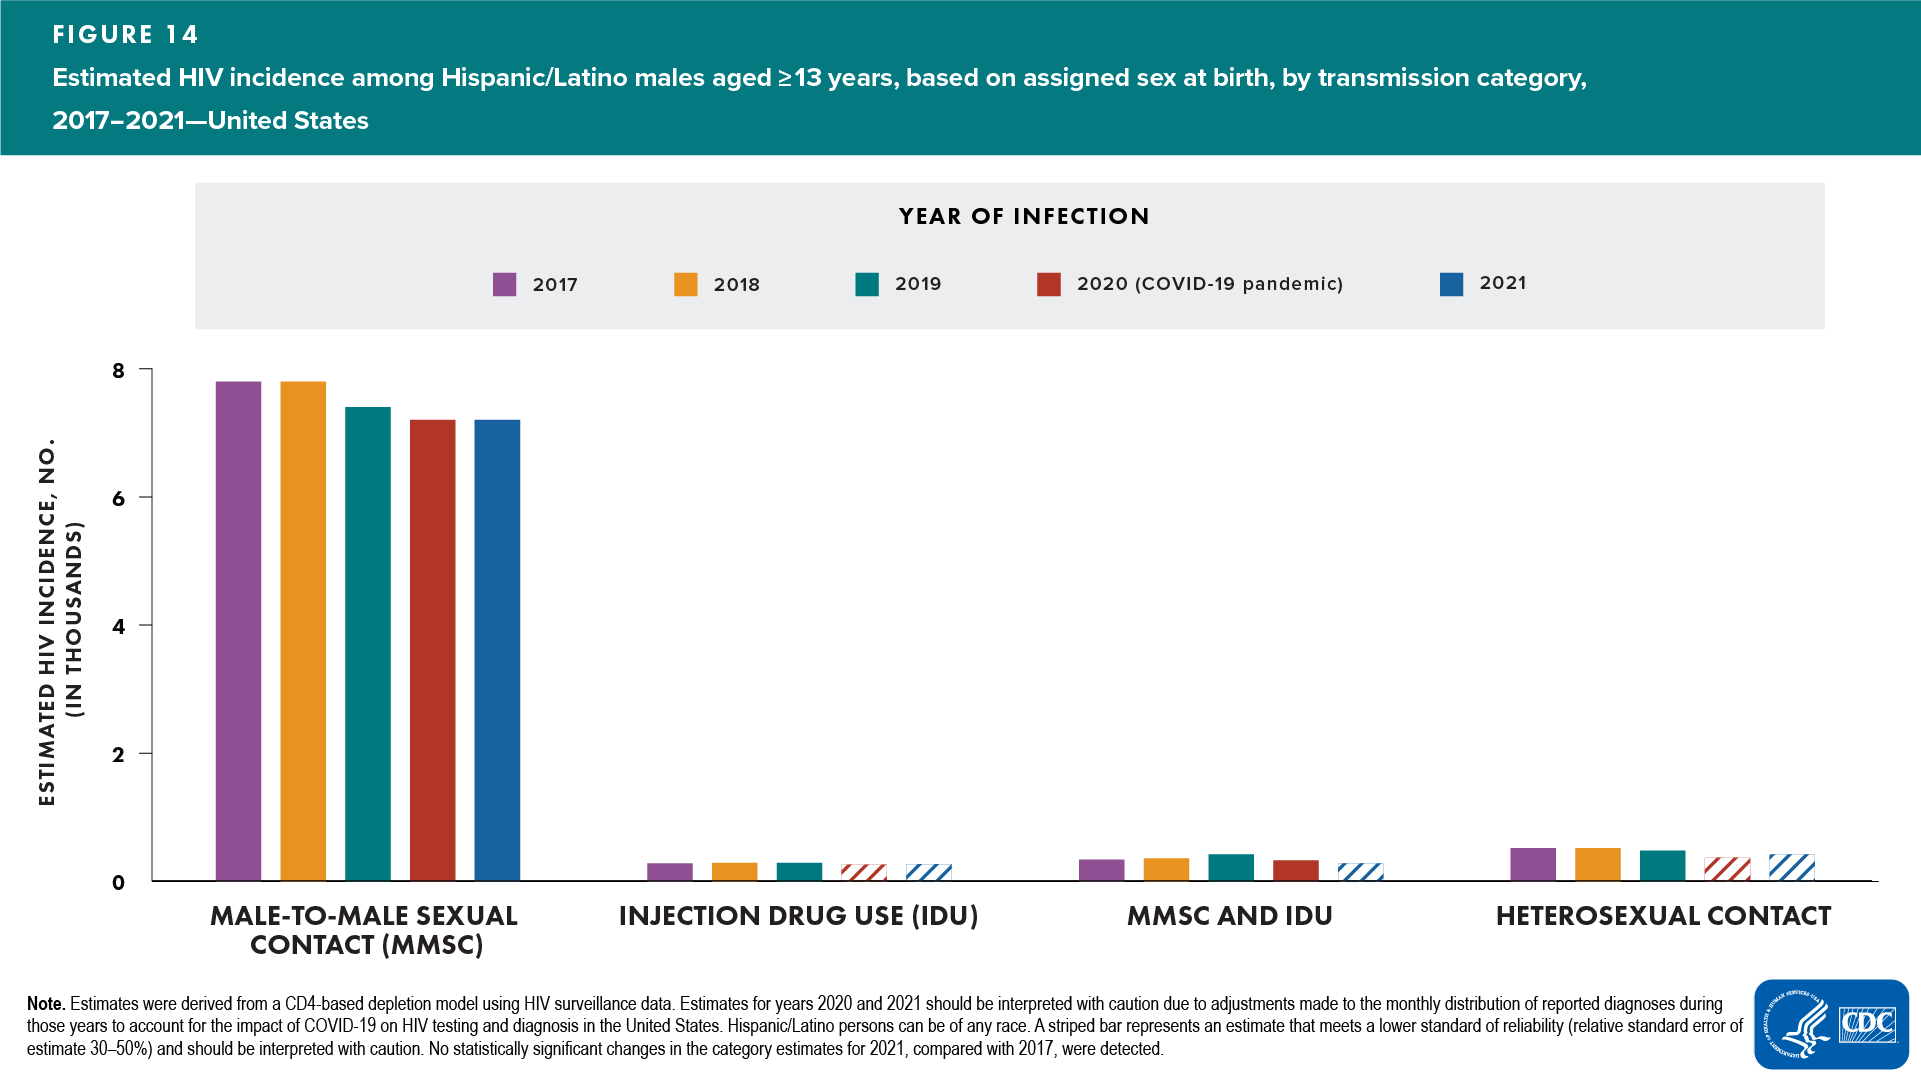
Among Hispanic/Latino males, no change was detected in the annual number of HIV infections in 2021, compared with 2017. Annual numbers of HIV infections in 2021, compared with 2017, were as follows:
- Age at infection—decreased: aged 13–24 years; no change detected: all other age groups (except aged ≥55 years, which had an RSE 30%–50% and should be interpreted with caution) (Table 3)
- Transmission category—no change detected: MMSC (Figure 14 and Table 3)
Note. Estimates for all other age and transmission category groups had RSEs of 30%–50% (interpret with caution).
In 2021, among Hispanic/Latino males, the percentages and rates of HIV infections were as follows:
- Largest percentages: aged 25–34 (44%) and 35–44 years (22%) (Table 3)
- Rate for Hispanic/Latino males (32.9) (Table 3) was 4 times that for White males (7.8)
Hispanic/Latino females
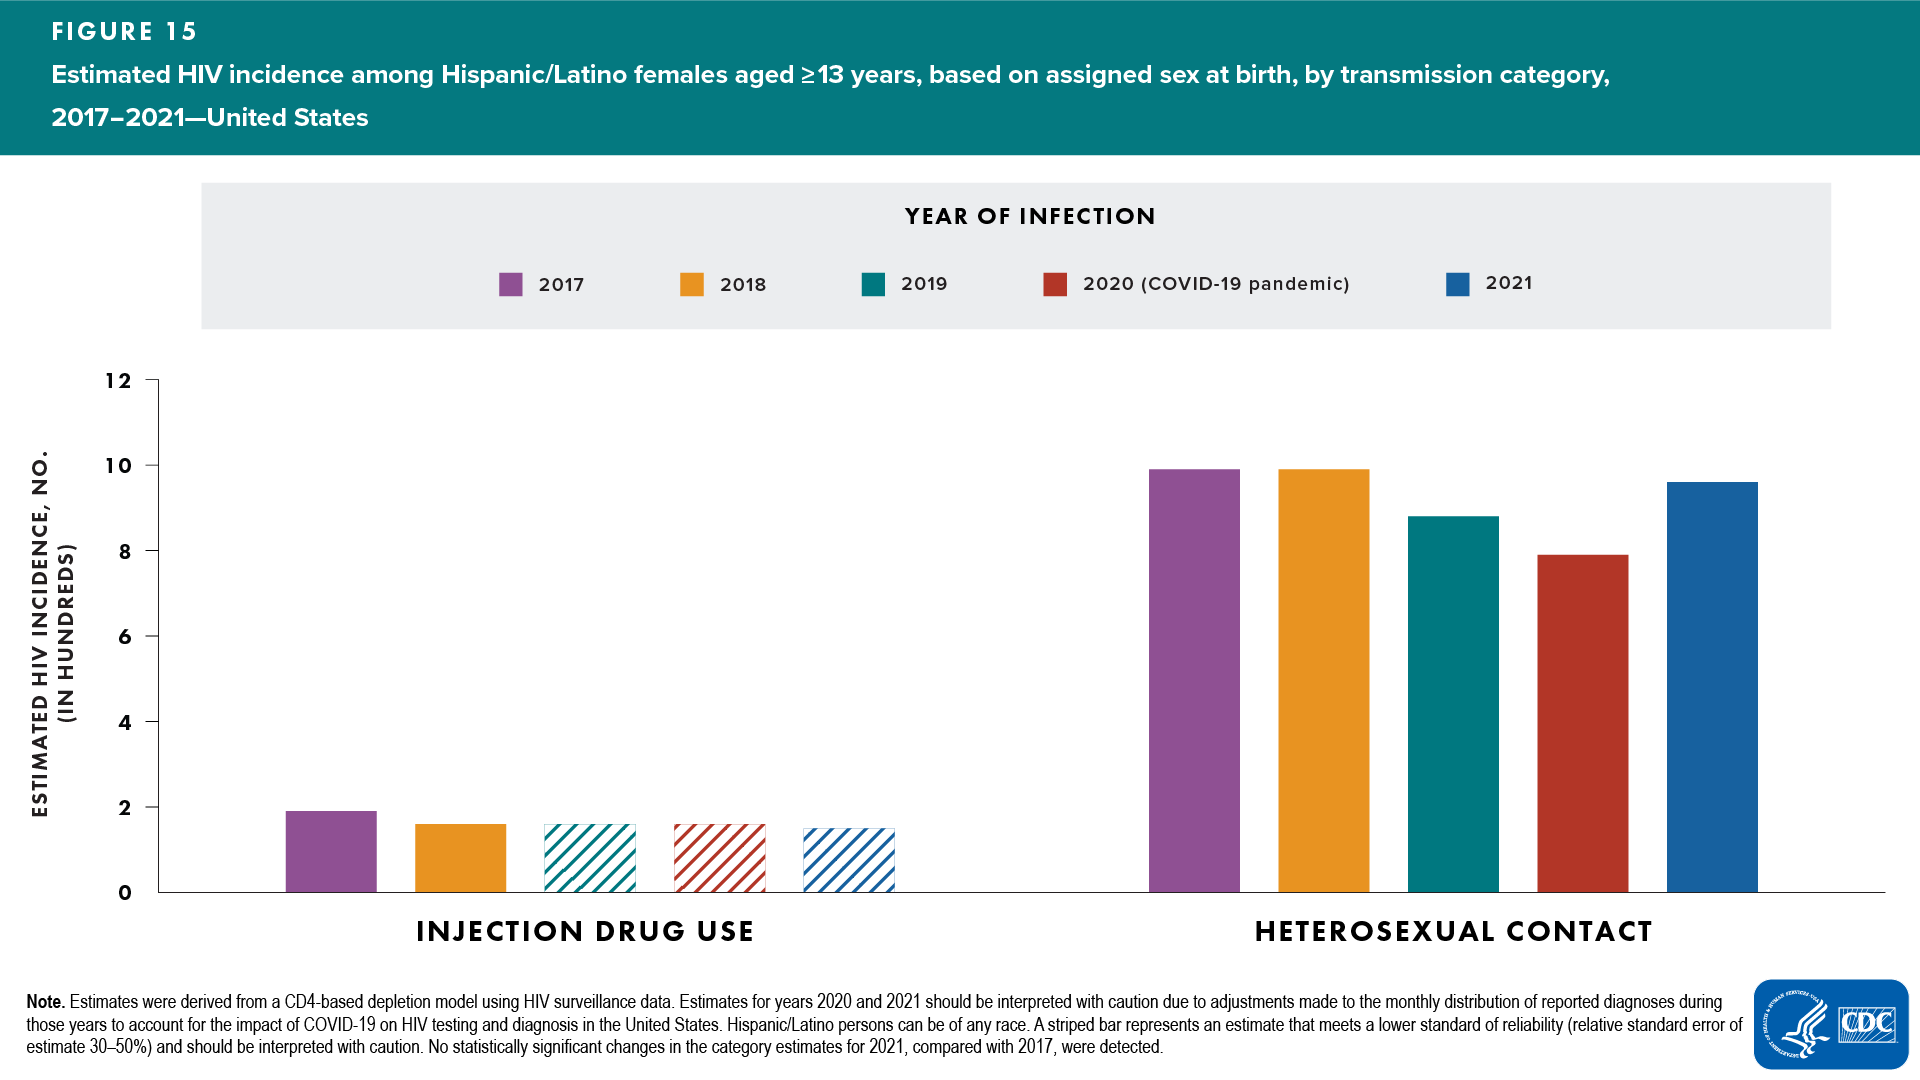
Among Hispanic/Latino females, no change was detected in the annual number of HIV infections in 2021, compared with 2017. Annual numbers of HIV infections in 2021, compared with 2017, were as follows:
- Age at infection—estimates for all other age and transmission category groups had RSEs of 30%–50% (interpret with caution) (Table 3)
- Transmission category—no change detected: heterosexual contact; injection drug use category had RSE of 30%–50% (interpret with caution) (Figure 15 and Table 3)
In 2021, among Hispanic/Latino females, most HIV infections (87%) were attributed to heterosexual contact (Table 3).
White Persons
In 2021, HIV incidence among White persons was as follows:
- No change was detected when compared with 2017 (Table 4)
- Accounted for 26% of all HIV infections (Table 1)
- 59% were attributed to MMSC, and 16% were attributed to heterosexual contact (Table 4)
- Among White persons, males accounted for 80% of HIV infections, most of which (73%) were attributed to MMSC (Table 4)
White males
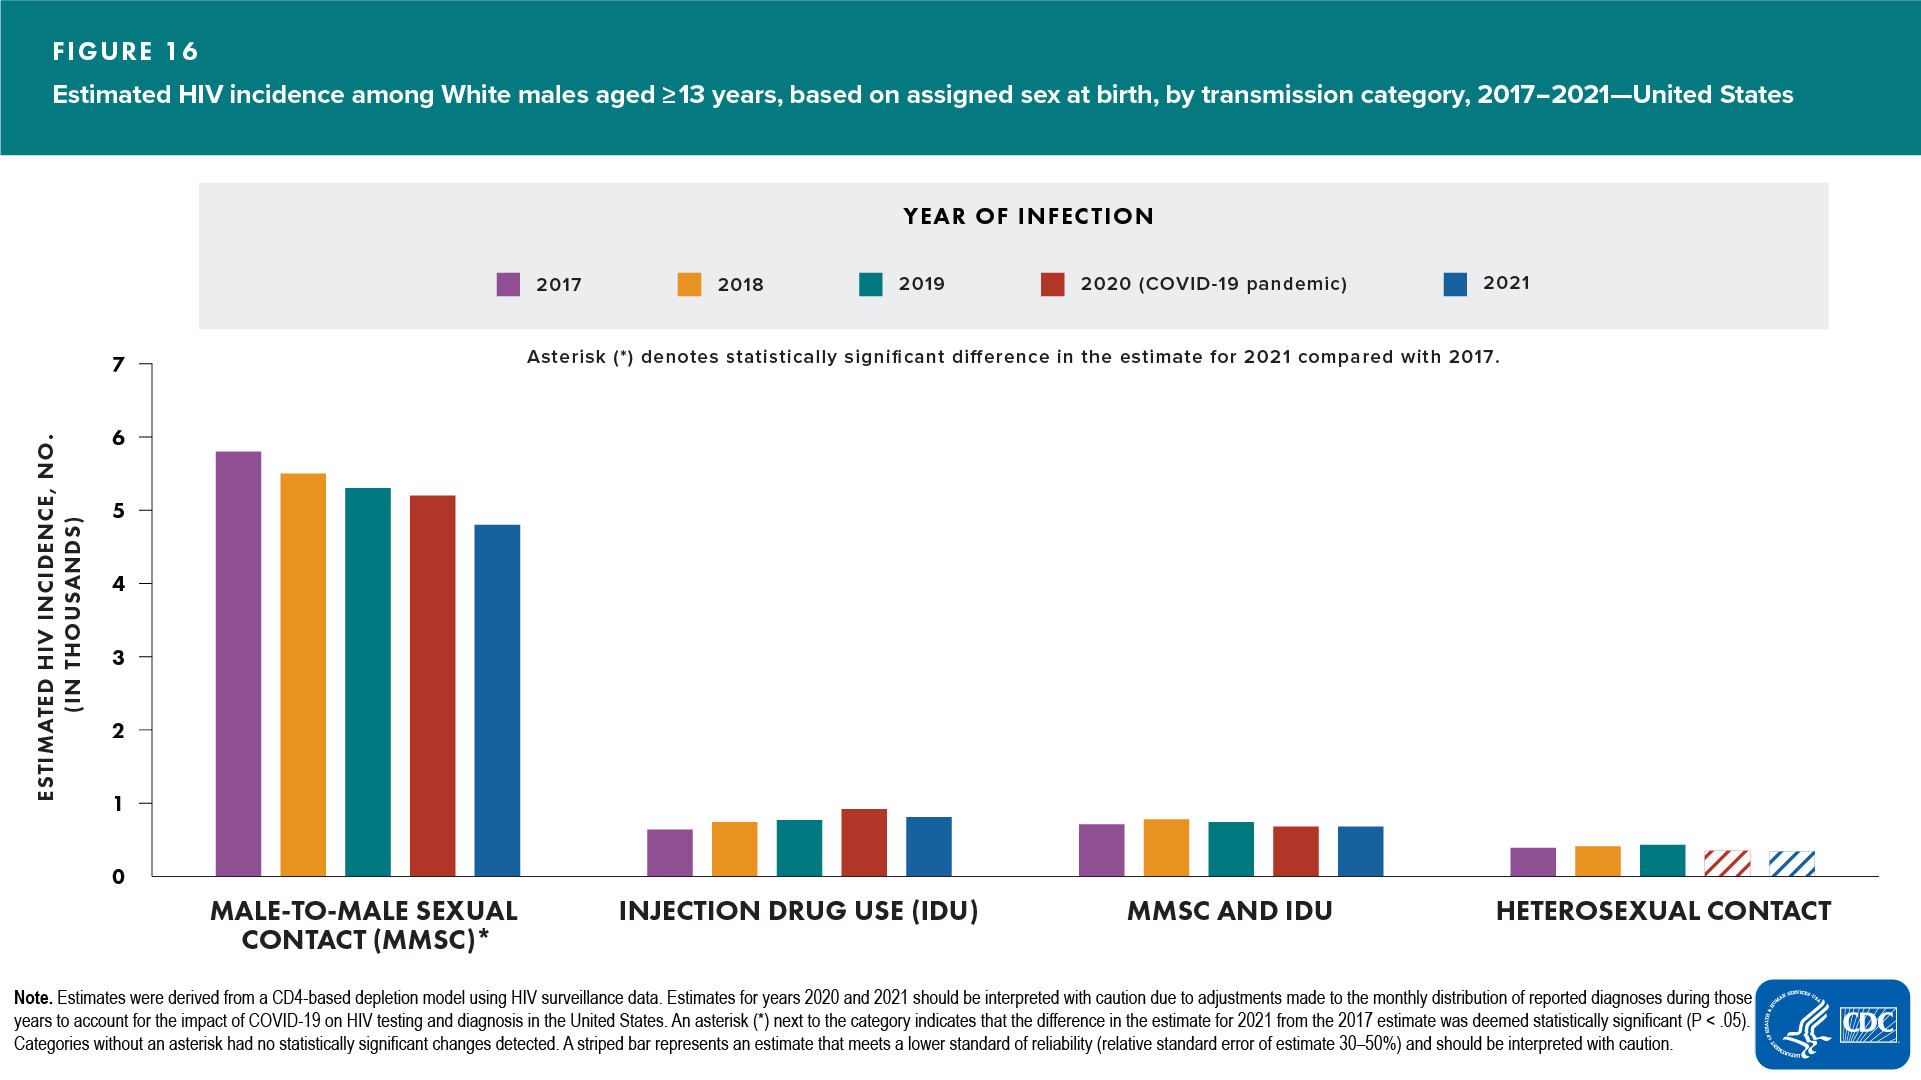
Among White males, no change was detected in the annual number of HIV infections in 2021, compared with 2017. Annual numbers of HIV infections in 2021, compared with 2017, were as follows:
- Age at infection
- Decreased—aged 13–24 years (Table 4)
- No change detected—all other age groups (Figure 16 and Table 4)
- Transmission category
- Decreased—MMSC
- No change detected—IDU, MMSC and IDU
Note. Estimates for heterosexual contact category had RSEs of 30%–50% (interpret with caution).
In 2021, among White males, the largest percentages of HIV infections, by age group, were among those aged 25–34 (39%) and 35–44 years (24%) (Table 4).
White females
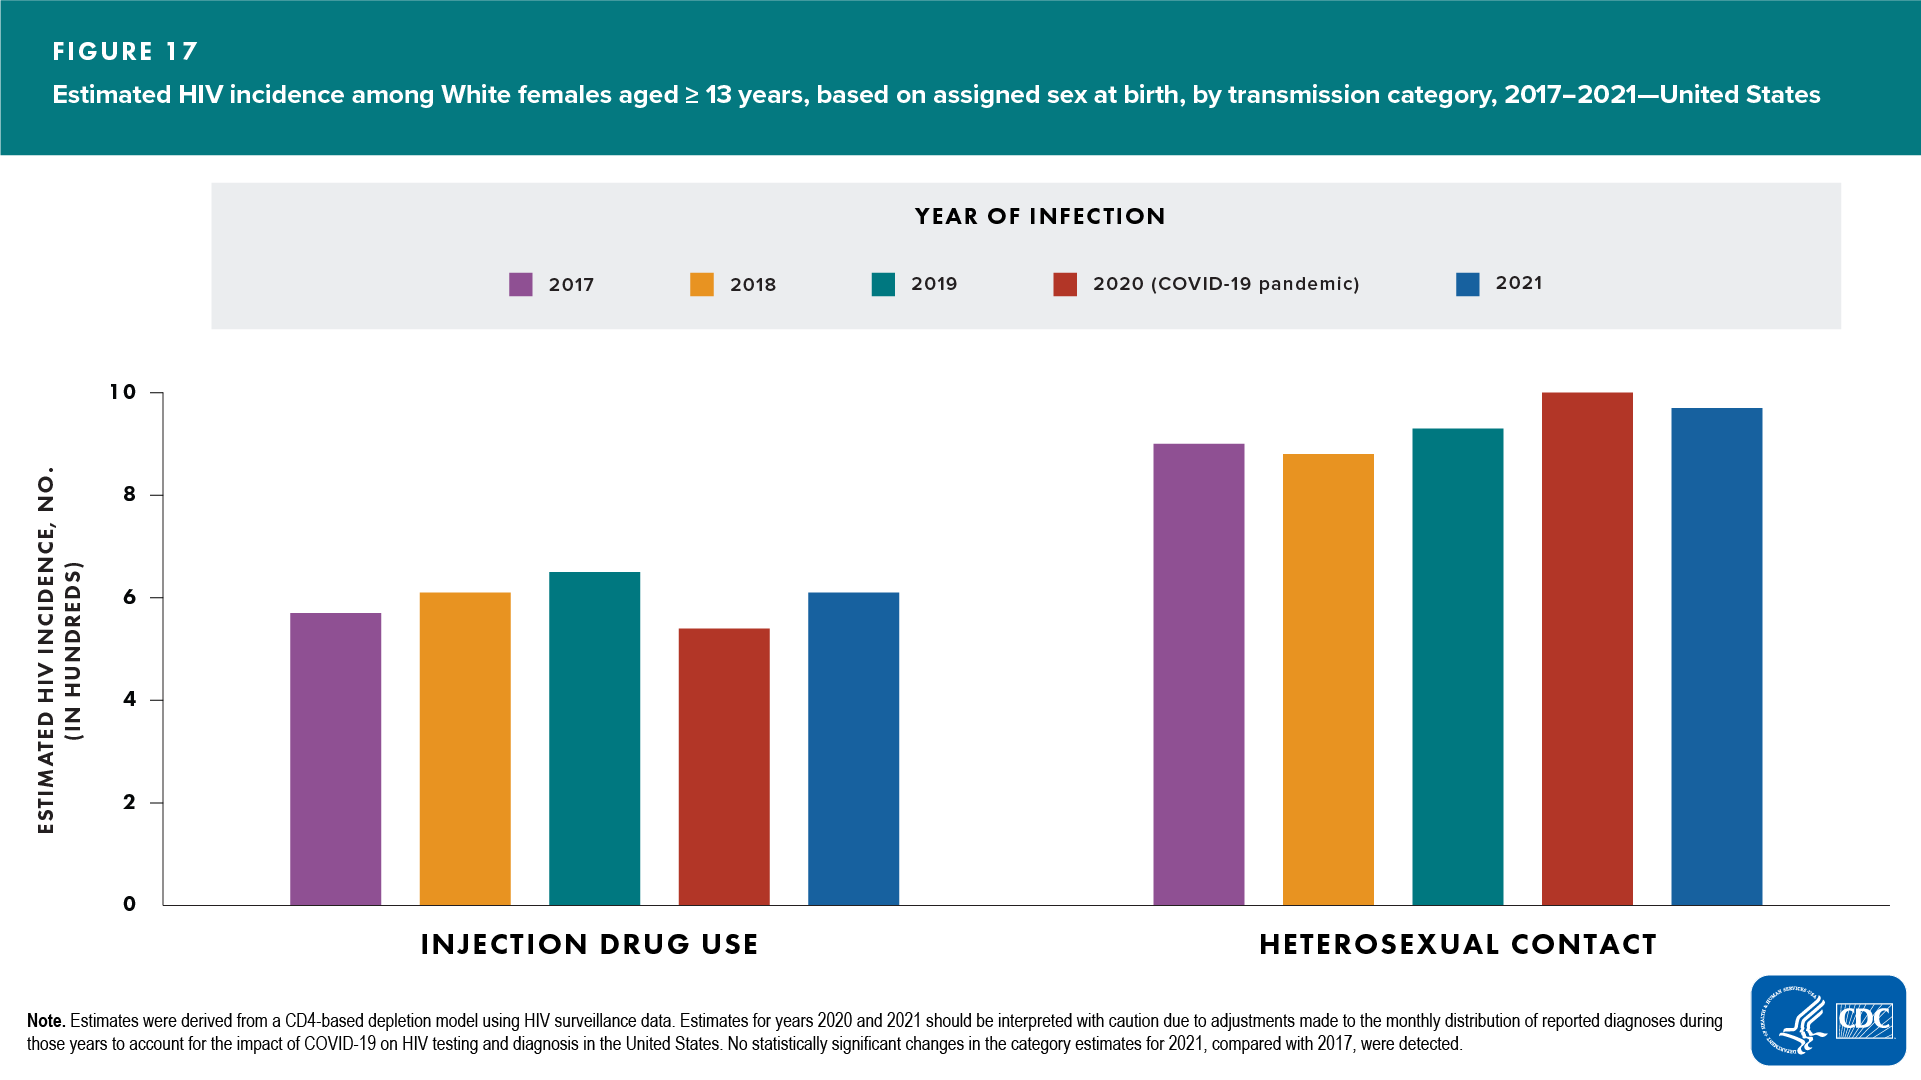
Among White females, no change was detected in the annual number of HIV infections in 2021, compared with 2017. The annual numbers of HIV infections in 2021, compared with 2017, were as follows:
- Age at infection—no change detected: aged 25–34 and 35–44 years (Table 4)
- Transmission category—no change detected: all transmission categories (Figure 17 and Table 4)
Note. Estimates for all other age groups had RSEs of 30%–50% (interpret with caution).
In 2021, among White females, most HIV infections (61%) were attributed to heterosexual contact (Table 4).
Prevalence: Persons Aged ≥13 Years Living with Diagnosed or Undiagnosed HIV Infection
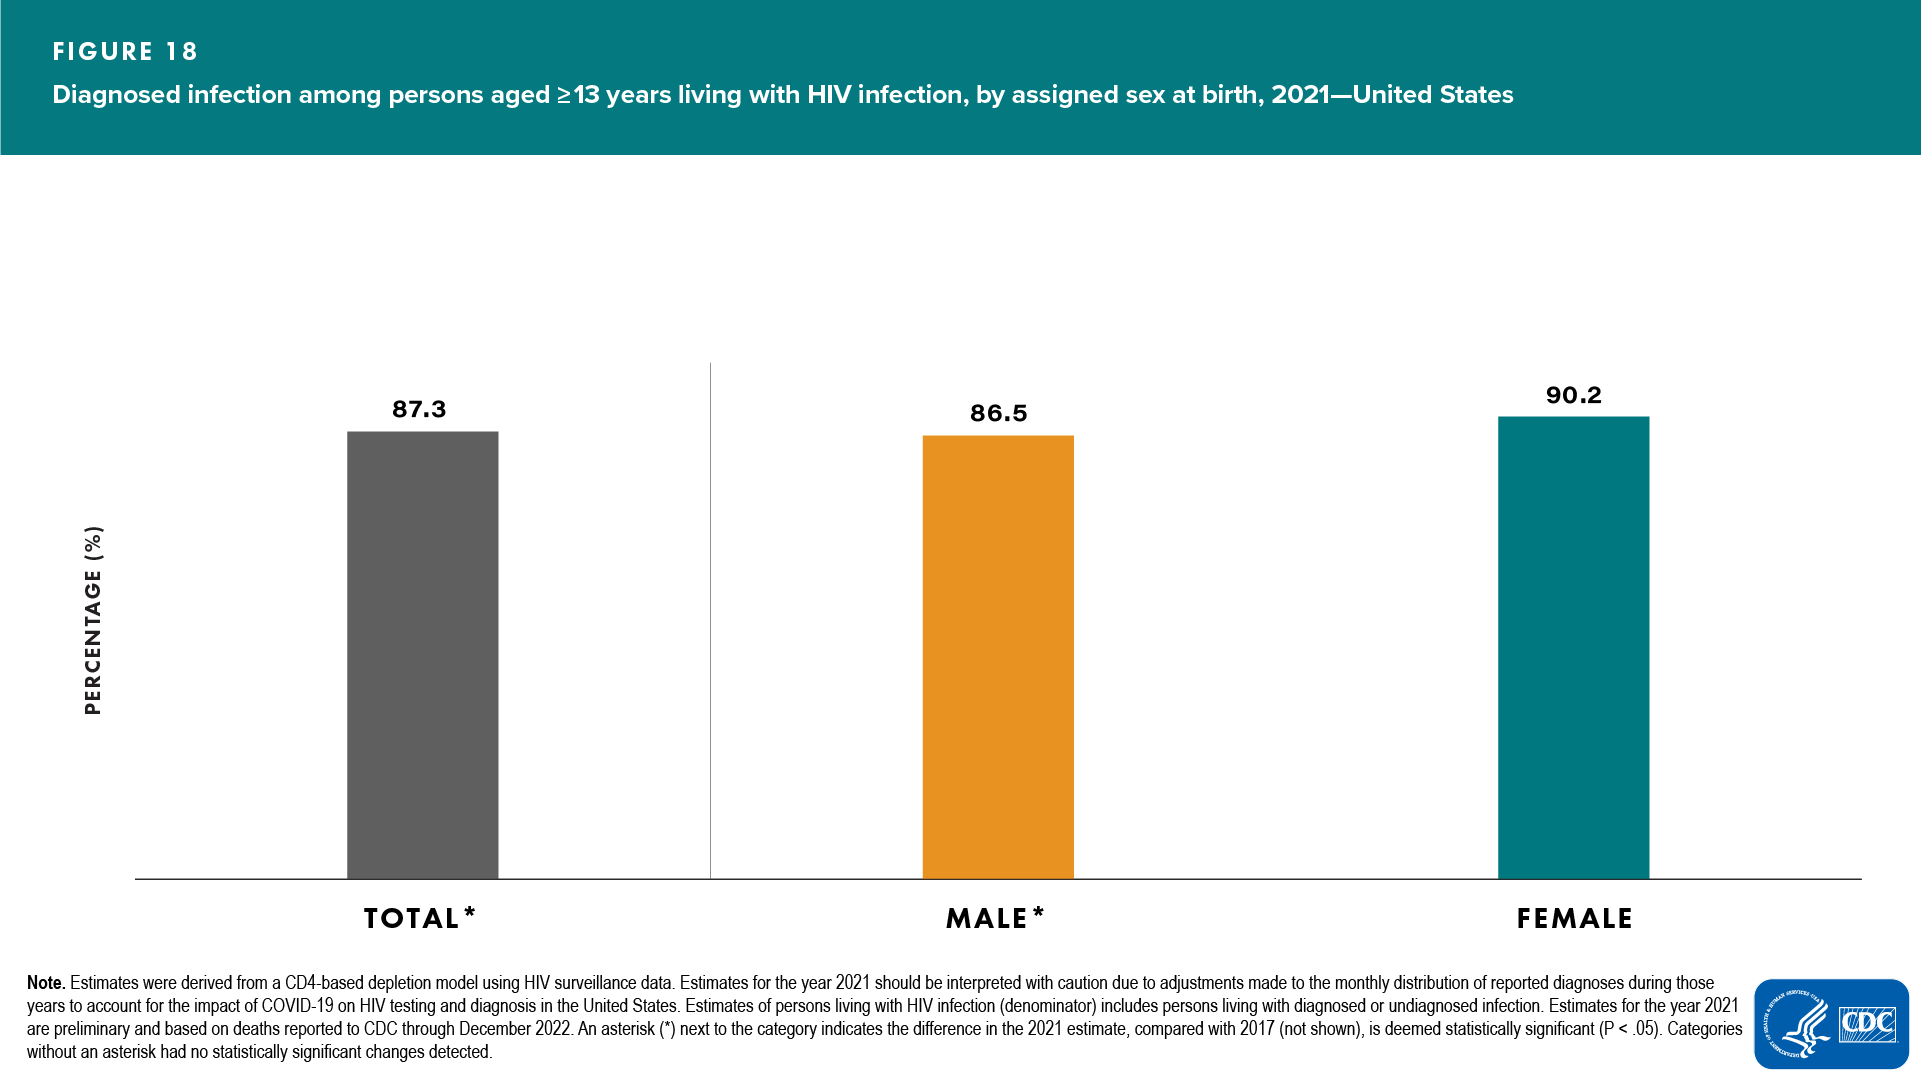
At year-end 2021, an estimated 1,212,400 persons aged ≥ 13 years were living with HIV infection (prevalence), including 1,058,900 (87.3%) persons with diagnosed HIV; the prevalence rate was 432.7 (Table 8). The percentage of diagnosed infections among persons living with HIV at year-end 2021 increased compared with 2017 (Table 8). The prevalence of HIV in the U.S. population among persons aged ≥13 years was 0.4%.
At year-end 2021, estimated numbers and percentages of HIV prevalence (diagnosed and undiagnosed infection) among persons ≥13 years were as follows:
ASAB
- Prevalence rates and percentages—males (686.1; 78%); females (186.9; 22%) (Table 7)
- Percentage of diagnosed HIV infection was smaller among males (86.5%) than among females (90.2%) (Figure 18 and Table 8)
- Percentage of persons living with diagnosed HIV infection in 2021, compared with 2017, increased among males, but no change was detected among females (Table 8)
Age Group
- Highest prevalence rates—aged 45–54 years (646.4), followed by persons aged 35–44 years (549.1) (Table 7)
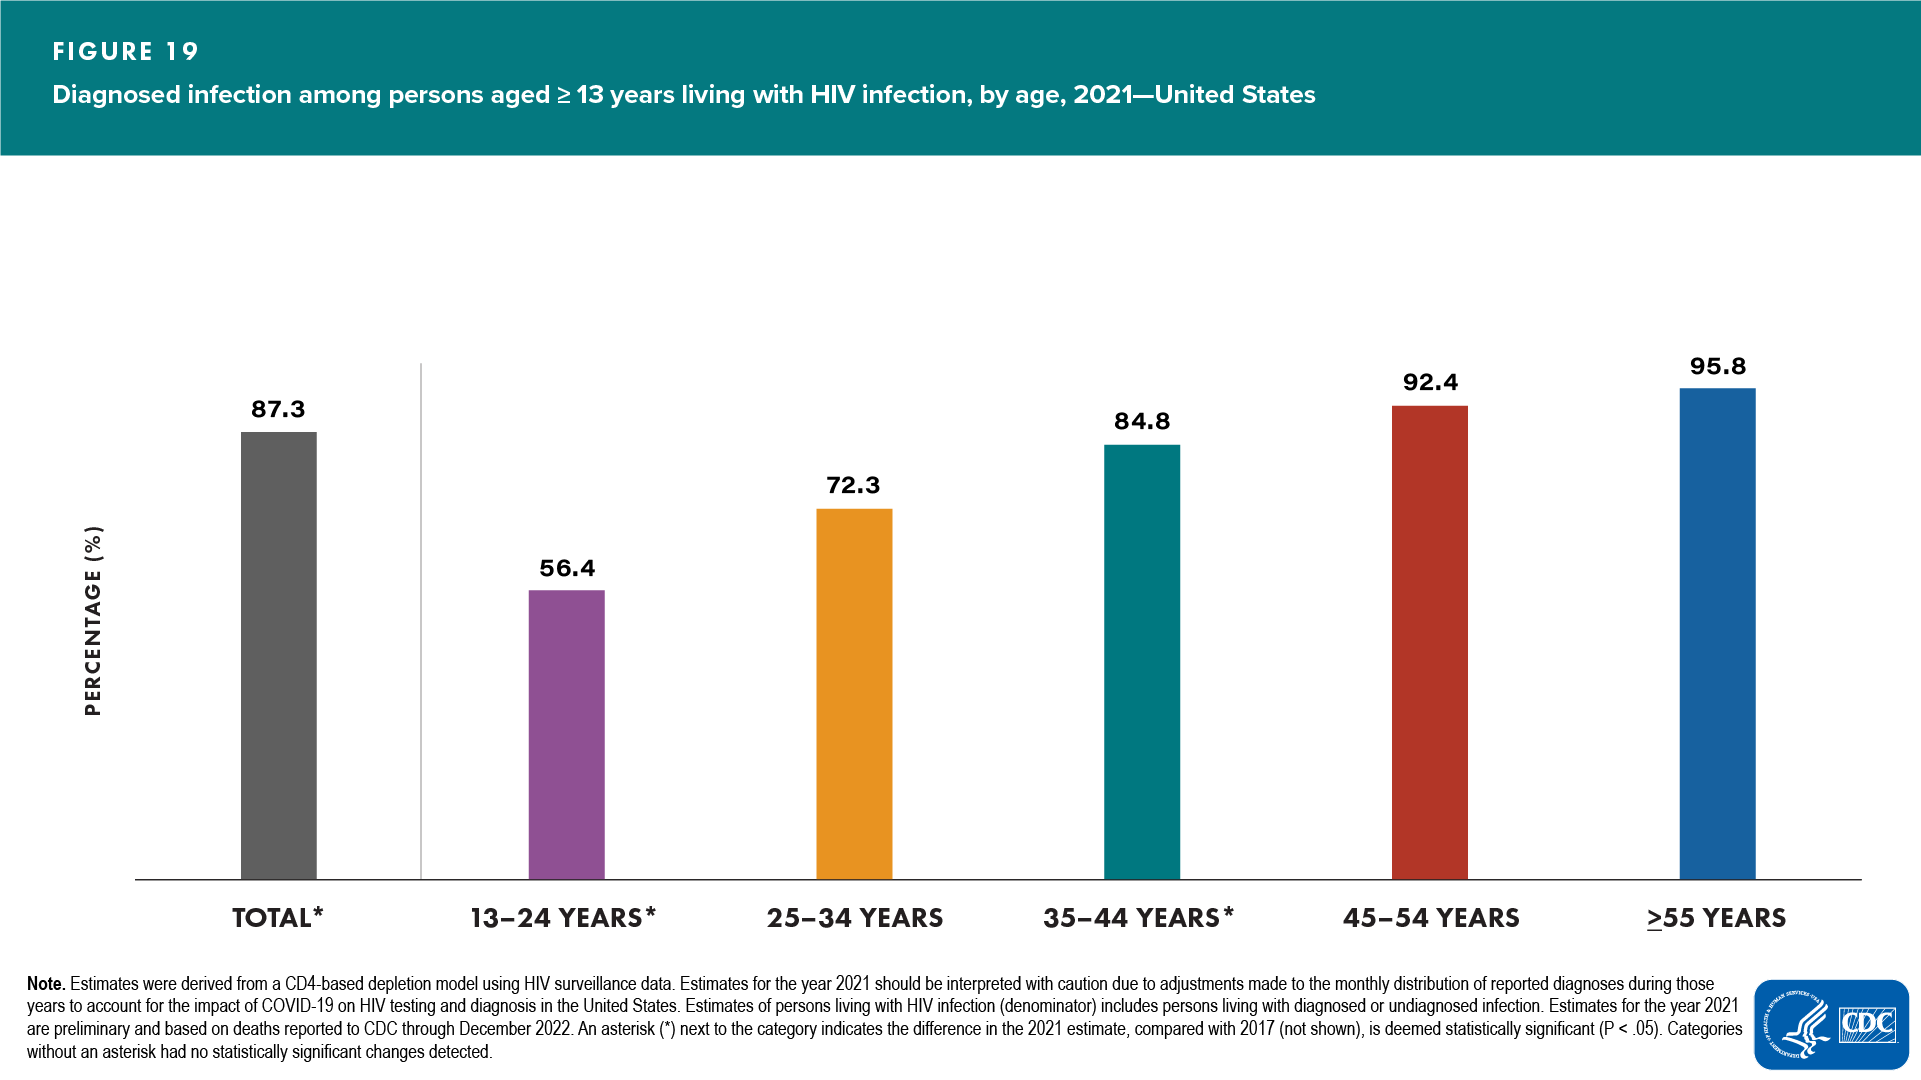
- Smallest percentages of diagnosed infection: aged 13–24 years (56.4%), followed by persons aged 25–34 years (72.3%) (Figure 19 and Table 8)
- Percentages of persons living with diagnosed HIV infection in 2021, compared with 2017, were as follows (Table 8):
- Increased—aged 13–24 years
- Decreased—aged 35–44 years
- No change detected—aged 25–34, 44–54, and ≥55 years
Race/Ethnicity
- Highest prevalence rates—Black/African American persons (1,404.2), followed by multiracial persons (1,168.6) (Table 7)
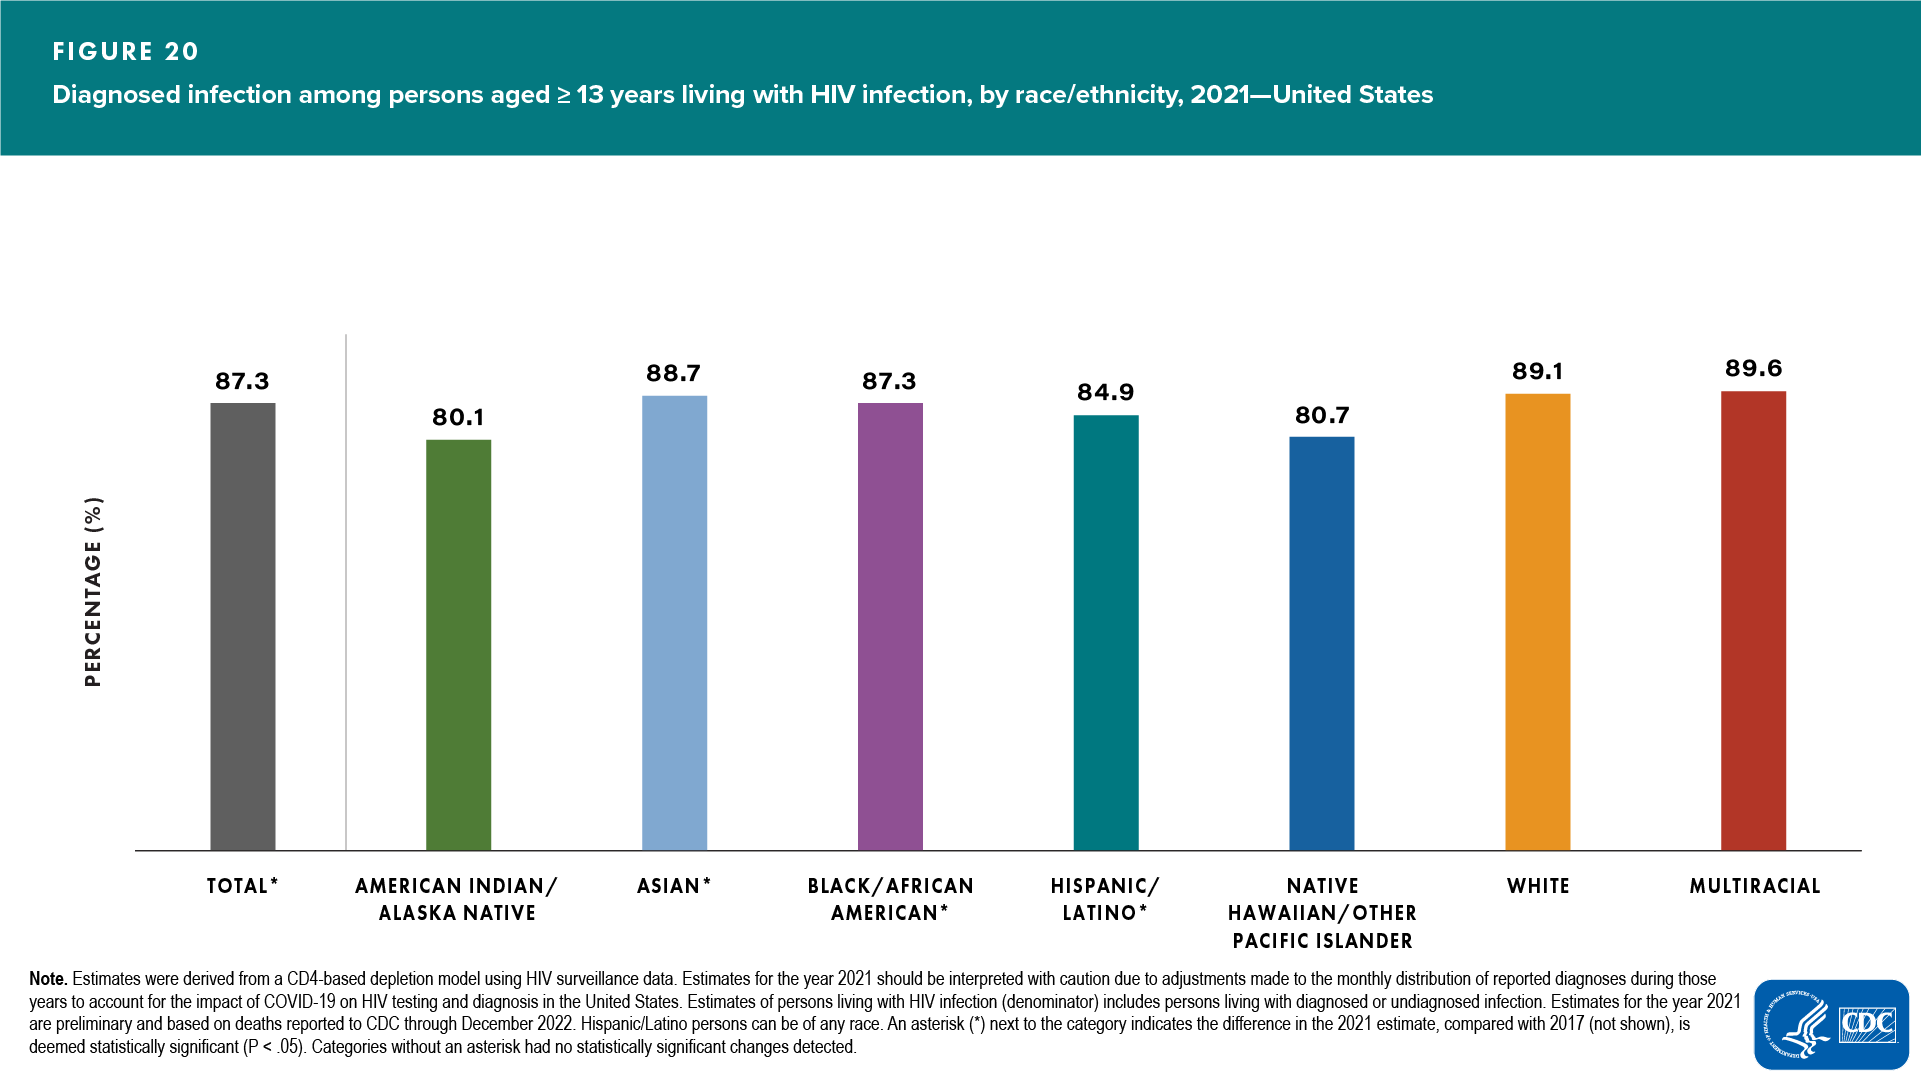
- Smallest percentages of diagnosed HIV infection: American Indian/Alaska Native persons (80.1) followed by Native Hawaiian/other Pacific Islander persons (80.7) (Figure 20 and Table 8)
- Percentages of persons living with diagnosed HIV infection in 2021, compared with 2017, were as follows (Table 8):
- Increased—Asian, Black/African American, and Hispanic/Latino persons
- Decreased—none
- No change detected—American Indian/Alaska Native, Native Hawaiian/other Pacific Islander, White, and multiracial persons
ASAB and Transmission Category
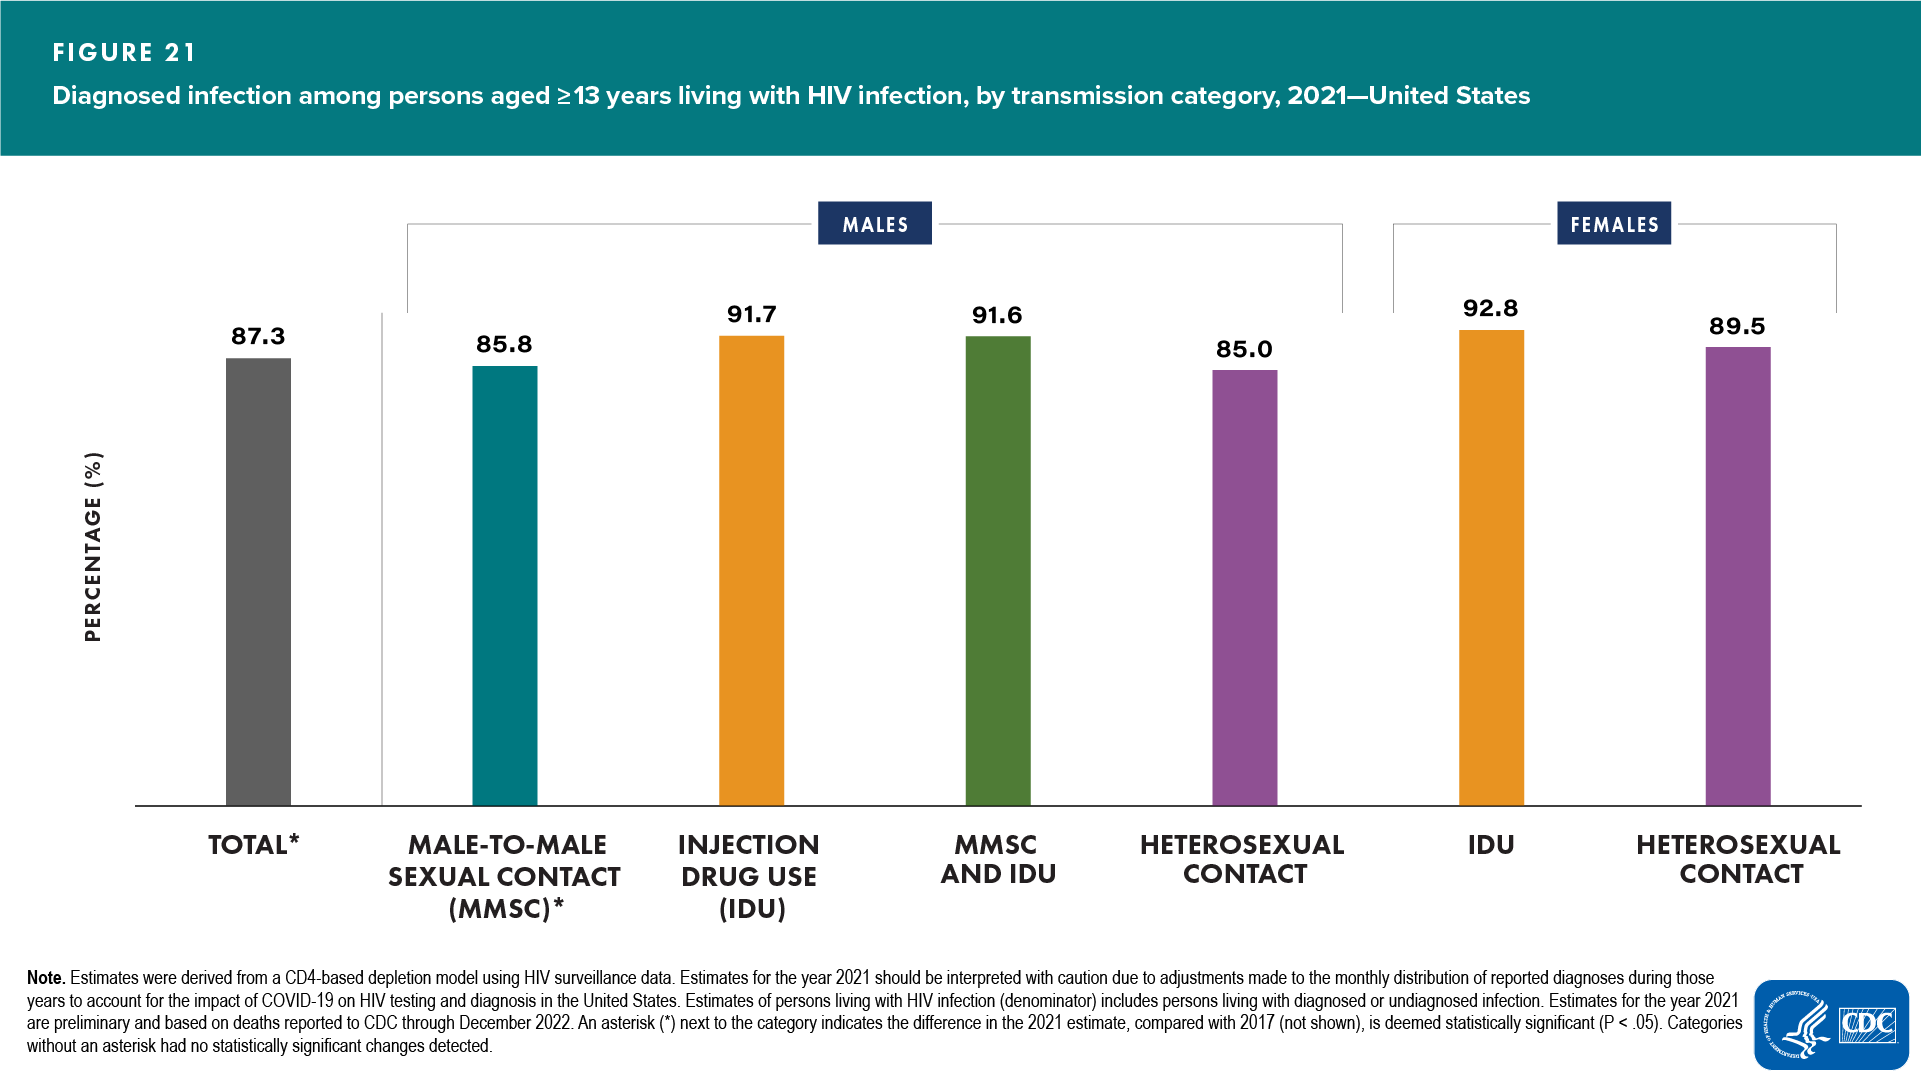
- Among males, smallest percentage with diagnosed infection: males with infection attributed to heterosexual contact (85.0%) (Figure 21 and Table 8)
- Among females, smallest percentages with diagnosed infection: females with infection attributed to heterosexual contact (89.5%) and MMSC (85.8%) (Figure 21 and Table 8)
- Percentages of persons living with diagnosed HIV infection in 2021, compared with 2017, were as follows (Table 8):
- Increased—males: MMSC
- Decreased—none
- No change detected—all other transmission categories among males; all transmission categories among females
Region
- Highest prevalence rates—South (530.7), followed by the Northeast (512.4) (Table 8)
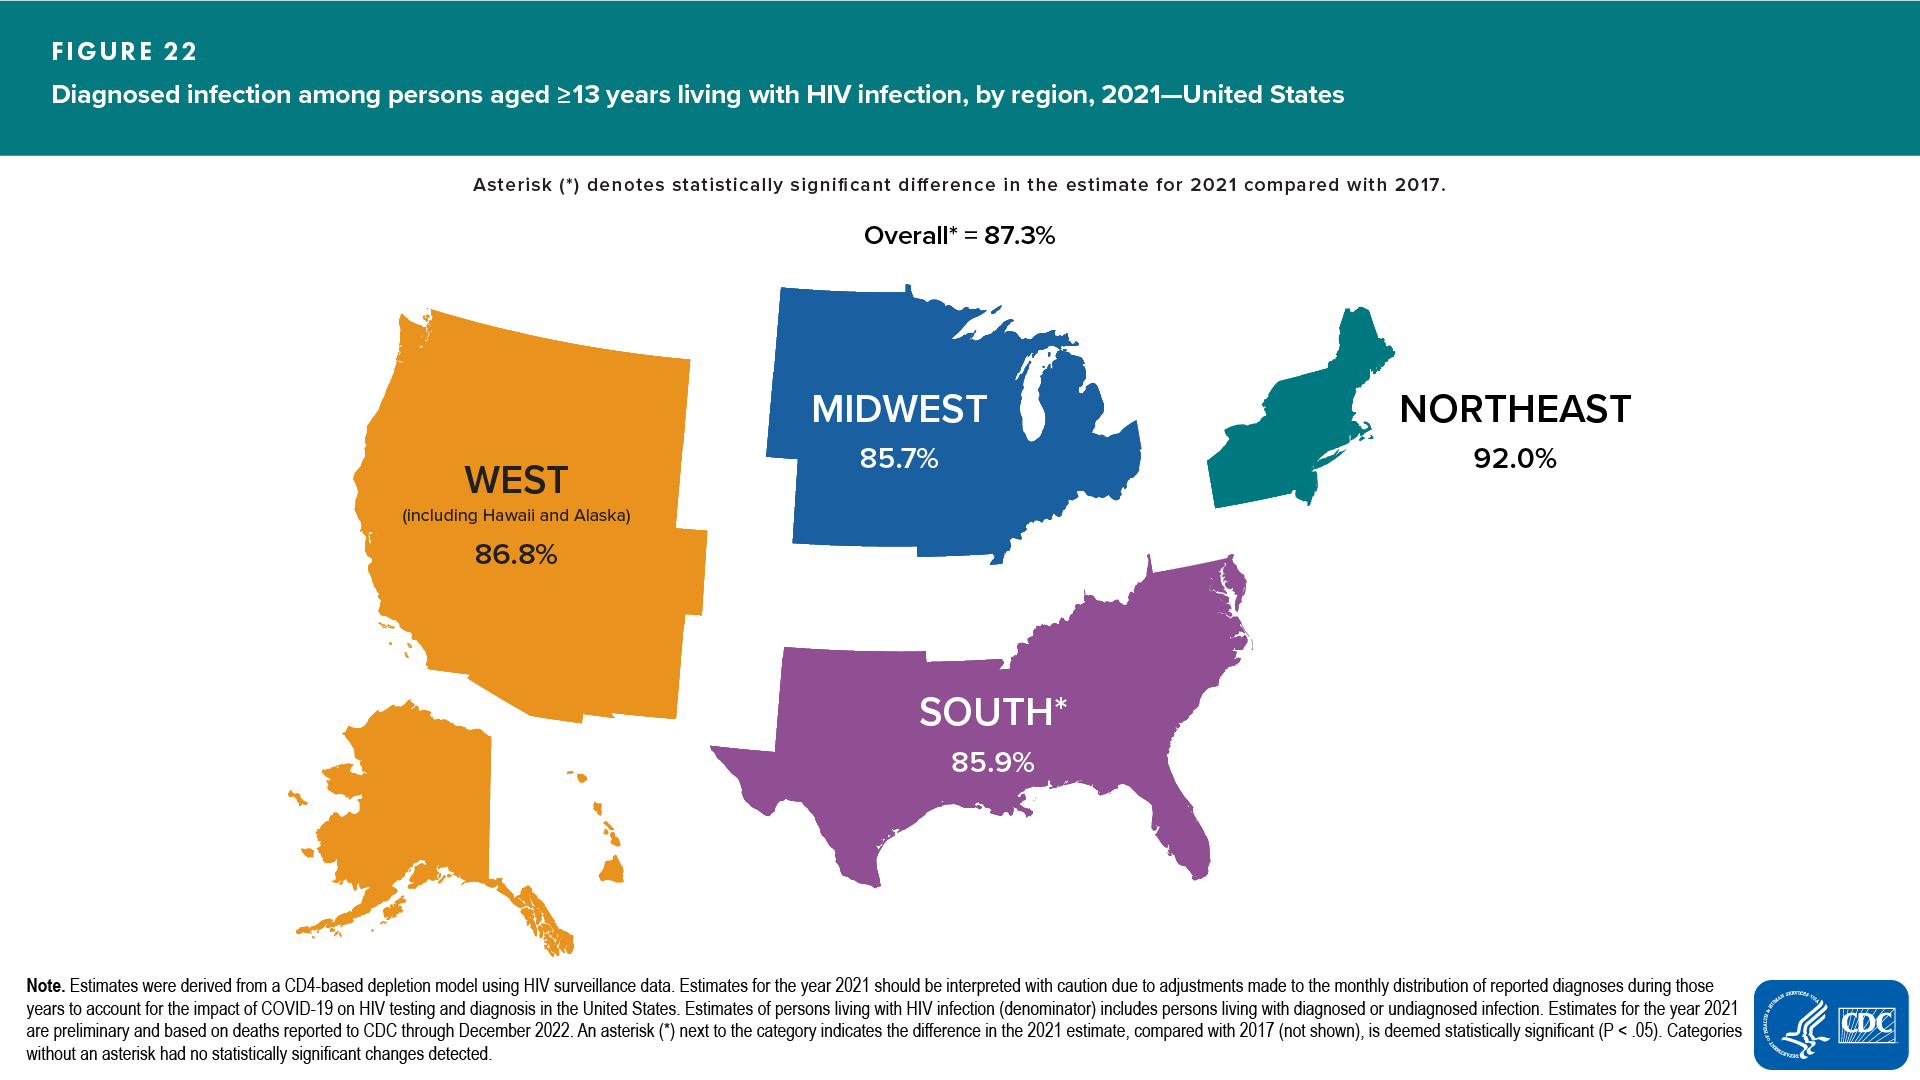
- Smallest percentages of diagnosed HIV infection: Midwest (85.7), followed by the South (85.9) (Table 8)
- Percentages of persons living with diagnosed HIV infection in 2021, compared with 2017, increased in the South, but no changes were detected in any other regions (Table 8)
Area of Residence
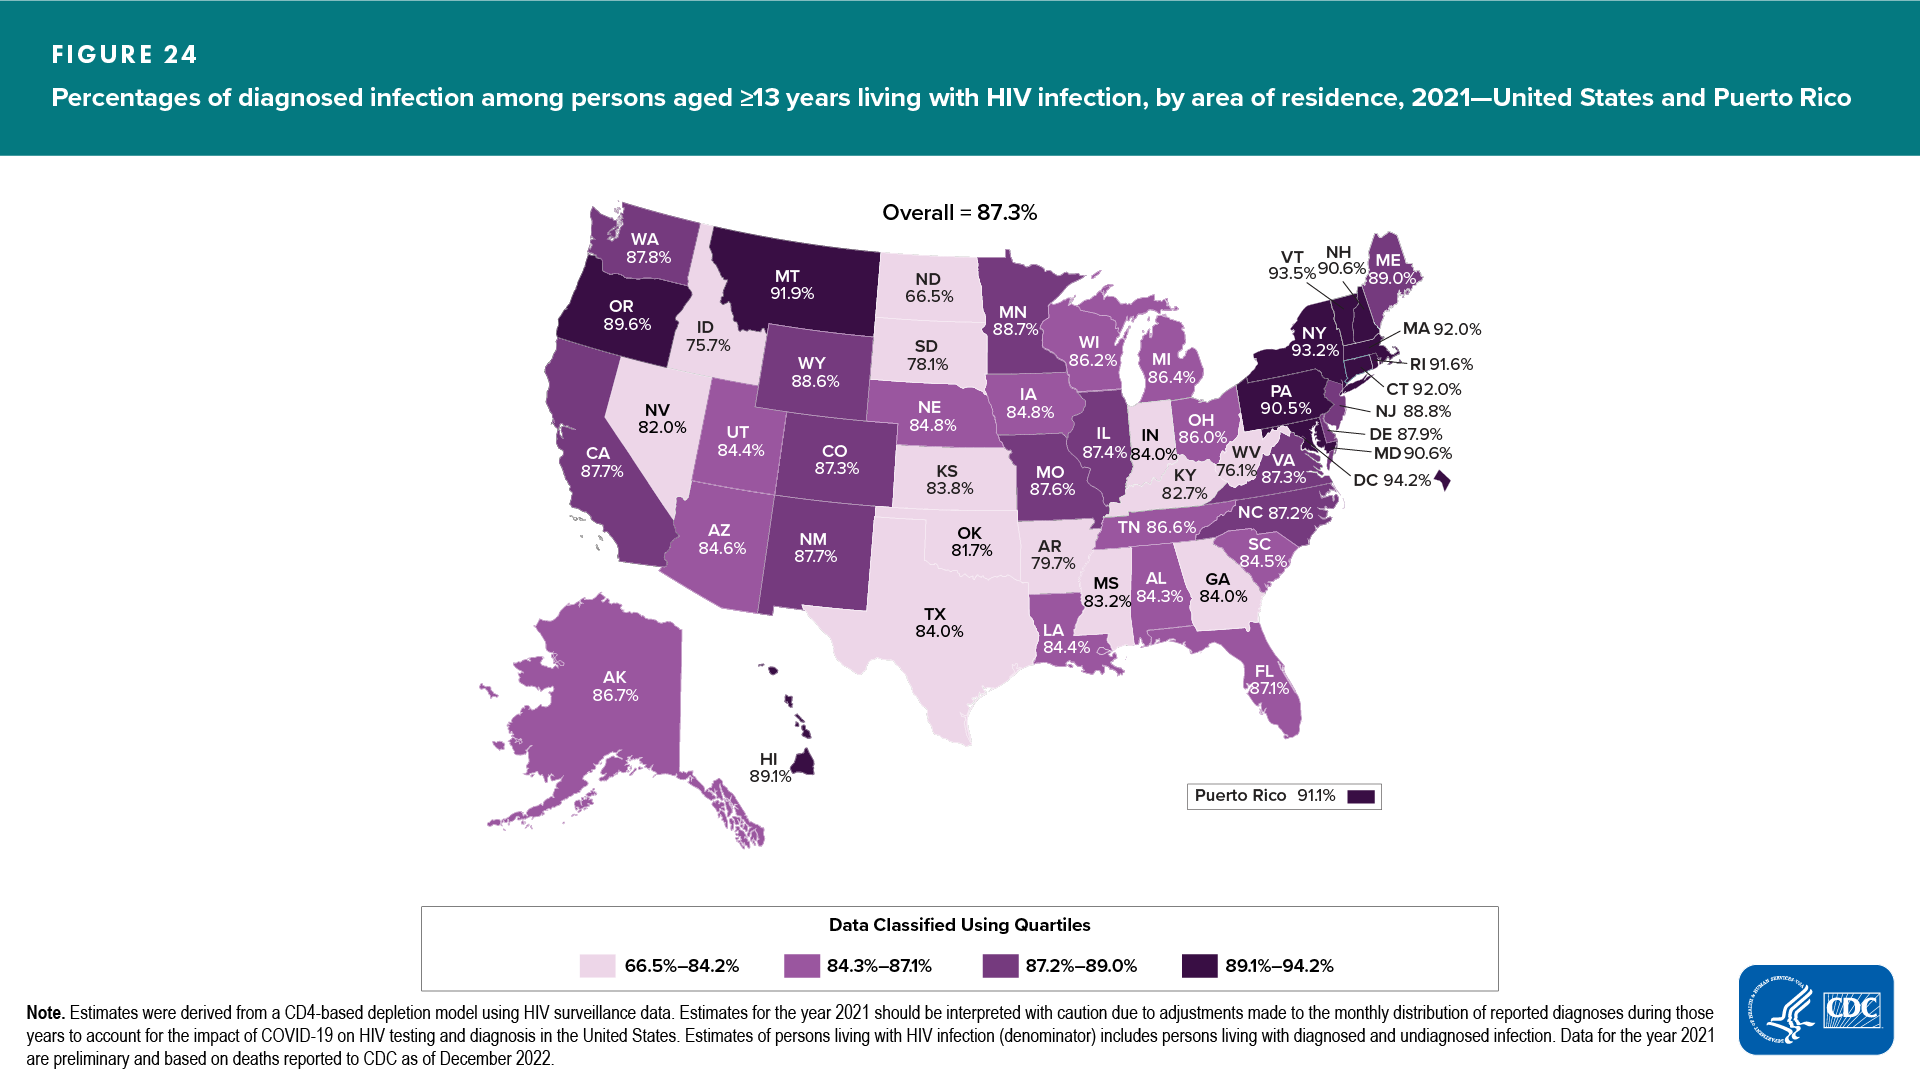
- Percentages of diagnosed HIV infection ranged from 66.5% in North Dakota to 94.2% in the District of Columbia (Table 13)
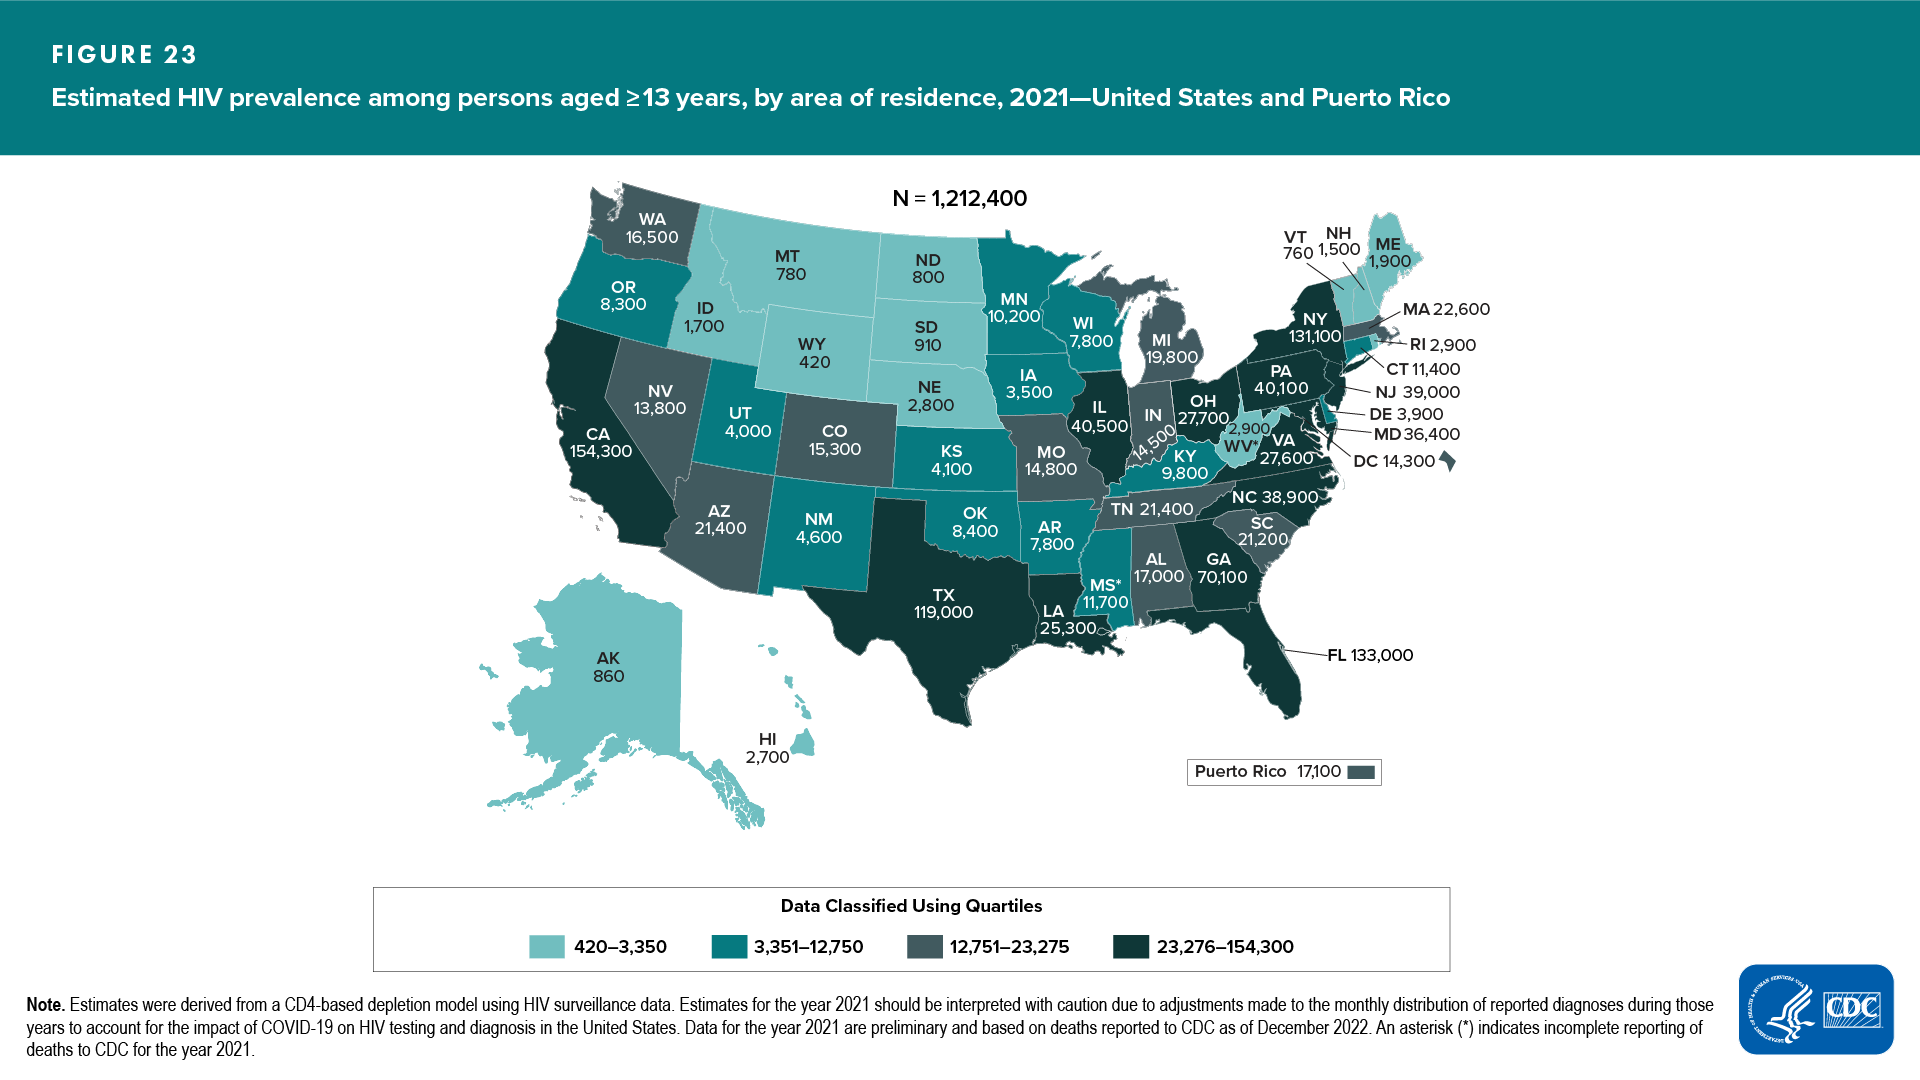
- Five areas accounted for 50% of persons living with HIV infection (diagnosed or undiagnosed): California, Florida, Georgia, New York, and Texas (Figure 23 and Table 13)
- Among persons living with HIV infection (diagnosed or undiagnosed), 13 areas had the lowest percentages of persons with diagnosed HIV (≤84.2%): Arkansas, Georgia, Idaho, Indiana, Kansas, Kentucky, Mississippi, Nevada, North Dakota, Oklahoma, South Dakota, Texas, and West Virginia (Figure 24)
- Percentage of persons living with diagnosed HIV infection in 2021, compared with 2017: no changes were detected in any areas
HIV Prevalence by Race/Ethnicity
Black/African American Persons
At year-end 2021, an estimated 487,500 Black/African American persons aged ≥13 years were living with HIV infection, including 425,519 (87.3%) living with diagnosed HIV (Table 9).
HIV prevalence among Black/African American persons was as follows:
- Of the estimated number of all persons living with diagnosed or undiagnosed HIV infection, 40% were Black/African American, 69% of whom were male (Table 9)
- Prevalence rate for Black/African American persons (1,404.2) (Table 9) was 7 times the rate for White persons (199.3) (Table 11)
- Prevalence rate for Black/African American males (2,027.0) was 2.5 times that for Black/African American females (840.2) (Table 9)
- Percentage (87.3%) living with diagnosed HIV infection in 2021, compared with 2017, increased (Table 9)
Black/African American males (Table 9)
At year-end 2021, an estimated 334,400 Black/African American males were living with HIV infection (85.7% of whom were living with diagnosed HIV), and HIV prevalence was as follows:
- Age—largest percentage: aged ≥55 years (32%)
- Transmission category—largest percentage: MMSC (69%)
Percentages living with diagnosed infection in 2021, compared with 2017:
- Increased—overall, among persons aged 13–24 years, and among males with infection attributed to MMSC
- Decreased—none
- No change detected—all other age groups and transmission categories
Black/African American females (Table 9)
At year-end 2021, an estimated 153,100 Black/African American females were living with HIV infection (90.7% of whom were living with diagnosed HIV), and HIV prevalence was as follows:
- Age—largest percentage: aged ≥55 years (40%)
- Transmission category—largest percentage: heterosexual contact (84%)
Percentages living with diagnosed infection in 2021, compared with 2017:
- Increased—none
- Decreased—none
- No change detected—all age groups and transmission categories
Hispanic/Latino Persons
At year-end 2021, an estimated 297,200 Hispanic/Latino persons aged ≥13 years were living with HIV infection, including 252,342 (84.9%) who were living with diagnosed HIV (Table 10).
HIV prevalence among Hispanic/Latino persons was as follows:
- Of the estimated number of persons living with diagnosed or undiagnosed HIV infection, 25% were Hispanic/Latino (Table 8), of whom 83% were male (Table 10)
- Prevalence rate for Hispanic/Latino persons (603.0) (Table 10) was 3 times the rate for White persons (199.3) (Table 8)
- Prevalence rate for Hispanic/Latino males (995.8) was 5 times that for Hispanic/Latino females (201.8) (Table 10)
- Percentage living with diagnosed HIV infection in 2021, compared with 2017, increased (Table 10)
Hispanic/Latino males (Table 10)
At year-end 2021, an estimated 248,000 Hispanic/Latino males were living with HIV infection (83.8% of whom were living with diagnosed HIV), and HIV prevalence was as follows:
- Age—largest percentage: aged ≥55 years (29%) (Table 10)
- Transmission category—largest percentage: MMSC (78%)
Percentages living with diagnosed infection in 2021, compared with 2017:
- Increased—overall, aged 13–24 years, and MMSC
- Decreased—none
- No change detected—all other age groups and transmission categories
Hispanic/Latino females (Table 10)
At year-end 2021, an estimated 49,200 Hispanic/Latino females were living with HIV infection (90.6% of whom were living with diagnosed HIV), and HIV prevalence was as follows:
- Age—largest percentage: aged ≥55 years (41%)
- Transmission category—largest percentage: heterosexual contact (79%)
Percentages living with diagnosed infection in 2021, compared with 2017:
- Increased—none
- Decreased—none
- No change detected—all age groups and transmission categories
White Persons
At year-end 2021, an estimated 342,000 White persons aged ≥13 years were living with HIV infection, including 304,871 (89.1%) who were living with diagnosed HIV (Table 11).
HIV prevalence among White persons was as follows:
- Of the estimated number of persons living with diagnosed or undiagnosed HIV infection, 28% were White (Table 8), 87% of whom were male (Table 11)
- Prevalence rate—199.3 (Table 11)
- Prevalence rate for White males (349.8) was 7 times that for White females (52.5) (Table 11)
- Percentage living with diagnosed HIV infection in 2021, compared with 2017: no changes detected (Table 11)
White males (Table 11)
At year-end 2021, an estimated 296,400 White males were living with HIV infection (89.4% of whom were living with diagnosed HIV), and the percentages of HIV prevalence were as follows:
- Age—largest percentage: aged ≥55 years (49%); smallest percentage: aged 13–24 years (2%)
- Transmission category—largest percentage: MMSC (81%)
Percentages living with diagnosed infection in 2021, compared with 2017:
- Increased—aged 13–24 years
- Decreased—none
- No change detected—all other age groups and all transmission categories
White females (Table 11)
At year-end 2021, an estimated 45,600 White females were living with HIV infection (87.5% of whom were living with diagnosed HIV), and the percentages of HIV prevalence were as follows:
- Age—largest percentage: aged ≥55 years (41%); smallest percentage: aged 13–24 years (2%)
- Transmission category—largest percentage: heterosexual contact (67%)
Percentages living with diagnosed infection in 2021, compared with 2017:
- Increased—none
- Decreased—none
- No change detected—all age groups and transmission categories
