Estimated HIV Incidence and Prevalence in the United States, 2017–2021: Technical Notes

A. Surveillance of HIV Infection Overview
Estimates presented in this report are based on case reports from the 50 states and the District of Columbia (and for jurisdiction-level estimates only, Puerto Rico; Tables 6, 13, A1 and A2), all of which have laws or regulations that require confidential reporting to the jurisdiction (not to the Centers for Disease Control and Prevention [CDC]), by name, for all persons with confirmed diagnoses of HIV infection. After the removal of personally identifiable information, data from these reports were submitted to CDC’s National HIV Surveillance System (NHSS). Although AIDS cases have been reported to CDC since 1981, the date of implementation of HIV infection reporting has differed from jurisdiction to jurisdiction. All states, the District of Columbia, and Puerto Rico had fully implemented name-based HIV infection reporting by April 2008.
B. CD4 Model
CD4 cells, a type of white blood cell, aid in fighting infections. HIV targets CD4 cells and without treatment, HIV reduces the number of CD4 cells in a person’s body. When no treatment has been received, the CD4 cell count can be used to estimate the time since infection at the date of CD4 test. CDC used the first CD4 test result after HIV diagnosis and a CD4-based depletion model (referred to hereafter as the “CD4 model”) indicating disease progression or duration after infection [3–6], to estimate HIV incidence (estimated number of new HIV infections each year) and prevalence (persons living with diagnosed or undiagnosed infection) among persons aged ≥13 years during 2017–2021. Reporting of the first CD4 test result after diagnosis of HIV infection is a required data element on the HIV case report form. By December 2022, a CD4 test result had been reported to NHSS for 93.8% of persons with HIV diagnosed during 2017–2021. Completeness of reporting varied among states and local jurisdictions.
The following data were used:
- CD4 model parameters adapted for the United States (predominately HIV subtype B)
- Stratified by assigned sex at birth, transmission category, and age (Note. Race/ethnicity is not included in the cohort data used to estimate CD4 depletion.)
- NHSS data
- For HIV incidence estimation:
- All cases of diagnosed HIV infection during 2010–2021
- First CD4 test result at or after diagnosis but presumed to be before treatment
- CD4 data for persons with evidence of antiretroviral therapy (ART) use prior to their first CD4 test result were excluded from the CD4 model. CD4 counts for these persons were treated as missing and accounted for through weighting.
- CD4 data for persons who had a viral load result <200 cells/mm3 prior to their first CD4 test result were excluded from the CD4 model. CD4 counts for these persons were treated as missing and accounted for through weighting.
- Case information on stage of disease, geographic and demographic characteristics, transmission category, and vital status
- For estimation of HIV prevalence and percentage of diagnosed infections:
- Numbers of persons living with diagnosed HIV infection reported to NHSS (at year-end 2009)
- Annual numbers of deaths among persons with diagnosed HIV infection (during 2010–2021)
- For HIV incidence estimation:
B1. HIV Incidence and Prevalence Estimation
Applying the CD4 model to NHSS data, national and jurisdiction-level estimates of HIV incidence and prevalence were obtained in 5 steps:
- The date of HIV infection was estimated for each person with a CD4 test result by using the CD4-model [6]. Not all persons with diagnosed HIV had a CD4 test result. The number of persons with a CD4 test result was weighted to account for those without a CD4 test result; weighting was based on the year of HIV diagnosis, assigned sex at birth, race/ethnicity, transmission category, age at diagnosis, disease classification, and vital status at year-end 2021. For jurisdiction-level estimates weighting was based on area of residence at diagnosis. Because the CD4 model is based on transmission categories for persons aged ≥13 years, persons aged <13 years at diagnosis and persons with infection attributed to a pediatric risk factor, such as perinatal exposure, were excluded.
- The distribution of delay (from HIV infection to diagnosis) was used to estimate the annual number of HIV infections, which includes persons with diagnosed infection and persons with undiagnosed infection [3, 4].
- The number of persons with undiagnosed HIV infection was estimated by subtracting cumulative diagnoses (reported to NHSS) from cumulative infections.
- HIV prevalence, which represents counts of persons with diagnosed or undiagnosed HIV infection who were alive at the end of a given year, was estimated by adding the number of persons with undiagnosed HIV infection to the number of persons living with diagnosed HIV infection (reported to NHSS).
- The percentage of diagnosed (or undiagnosed) infections was determined by dividing the number of persons living with diagnosed (or undiagnosed) infections by the total HIV prevalence for each year.
After estimates were produced, confidence intervals were calculated. To reflect model uncertainty, numbers were rounded to the nearest 100 for estimates of >1,000 and to the nearest 10 for estimates of <1,000. Jurisdiction-level estimates for HIV prevalence (Tables 13 and A2) were produced by using NHSS case data that reflected the person’s most recent known address (i.e., at the end of the specified year).
B2. Relative Standard Errors
The relative standard error (RSE) was used to assess the reliability of each point estimate of HIV incidence, prevalence, and undiagnosed infection.
RSE is defined as follows:
where U95 and L95 are the upper and lower limits of the 95% confidence interval
- RSE of <30%—Estimate meets the standard of reliability and is displayed.
- RSE of 30%–50%—Estimate meets a lower standard of reliability and is displayed but should be interpreted with caution; RSE is designated by an asterisk (*).
- RSE of >50%—Estimate is statistically unreliable and is not displayed; these estimates are expressed by an ellipsis (…).
CDC’s National Center for Health Statistics (NCHS) encourages caution when using estimates with an RSE of ≥30% because they are subject to high estimation error [16]. Estimates that do not meet NCHS’s requirement for a minimum degree of reliability are typically not published.
Confidence intervals were calculated by using the estimate of the population value and its associated standard error. The confidence intervals reflect the uncertainty of the estimate and represent the likely range in which the true population value lies [3].
B3. Rates
Rates per 100,000 population were calculated for (1) estimated numbers of HIV infections (incidence) and (2) estimated numbers of persons living with diagnosed or undiagnosed HIV infection (prevalence). The population denominators used to compute the rates for the 50 states, the District of Columbia, and Puerto Rico were based on the Vintage 2021 postcensal estimates file (for years 2017–2021) from the U.S. Census Bureau [17]. Rates for transmission categories are not provided in this report because of the absence of denominator data from the U.S. Census Bureau, the source of data used for calculating all rates in this report.
Rate per 100,000 population is defined as followsa,b,c:
a “incidence or prevalence” in the above equation refers to the total number of infections (incidence) or prevalent cases (prevalence) for the calendar year
b “population” in the denominator above refers to the total population for the calendar year
c the denominators in the above equation, used for calculating the rates specific to age, sex, and race/ethnicity were computed by applying the appropriate vintage estimates for age, sex, and race/ethnicity for the 50 states and the District of Columbia [17]
B4. Jurisdiction-level Estimates
Information only for persons residing in the jurisdiction of interest is used to model diagnosis delay and produce weights accounting for persons without a CD4 result. A person’s residence at diagnosis is selected when producing jurisdiction-level estimates for incidence, and most recent known address is selected to determine prevalence of infections (based on data reported to NHSS).
Estimates for the following jurisdictions should be interpreted with caution because the jurisdiction does not have laws requiring complete reporting of laboratory data or has incomplete reporting. Areas without laws: Idaho. Areas with incomplete reporting: New Jersey, Pennsylvania, and Puerto Rico.
Prevalence estimates for the year 2021 are preliminary and based on deaths reported to CDC as of December 2022. The following jurisdictions had incomplete reporting of deaths for the year 2021 and should be interpreted with caution: Mississippi and Puerto Rico.
B5. Persons Living with Diagnosed HIV Infection
Numbers of persons aged ≥13 years living with diagnosed infection presented in Tables 8–13 and A2 are reported numbers, not estimates. These numbers are based on case reports with vital status information reported to CDC through December 2022; data for the year 2021 are preliminary. Persons reported to the NHSS are assumed alive unless their deaths have been reported to CDC.
Reported numbers of persons aged ≥13 years living with diagnosed HIV infection presented in this report (Tables 8–13 and A2) differ from the numbers published in the 2021 HIV Surveillance Report because of differences in case selection [14]. In this report, the tabulation for the number of persons aged ≥13 years living with diagnosed HIV infection excluded cases among persons with infection attributed to pediatric-related HIV transmission categories (e.g., perinatal exposure). Numbers of persons living with diagnosed HIV infection presented in the 2021 HIV Surveillance Report include all persons aged ≥13 years living with diagnosed HIV infection at the end of the specified year, regardless of HIV transmission category.
B6. Statistical Assessments of Differences (z test)
We used the z test to assess differences between estimated numbers of HIV infections and between estimated percentages of persons living with diagnosed HIV infection in 2021, compared with 2017. Differences were deemed statistically significant when P<.05. A statistically significant difference in the 2021 estimate, compared with the 2017 estimate, is indicated with a footnote indicator on the 2021 estimate (Tables 1–6, 8–13, A1 and A2).
C. HIV Diagnoses Data Adjustments to Address COVID-19 Pandemic
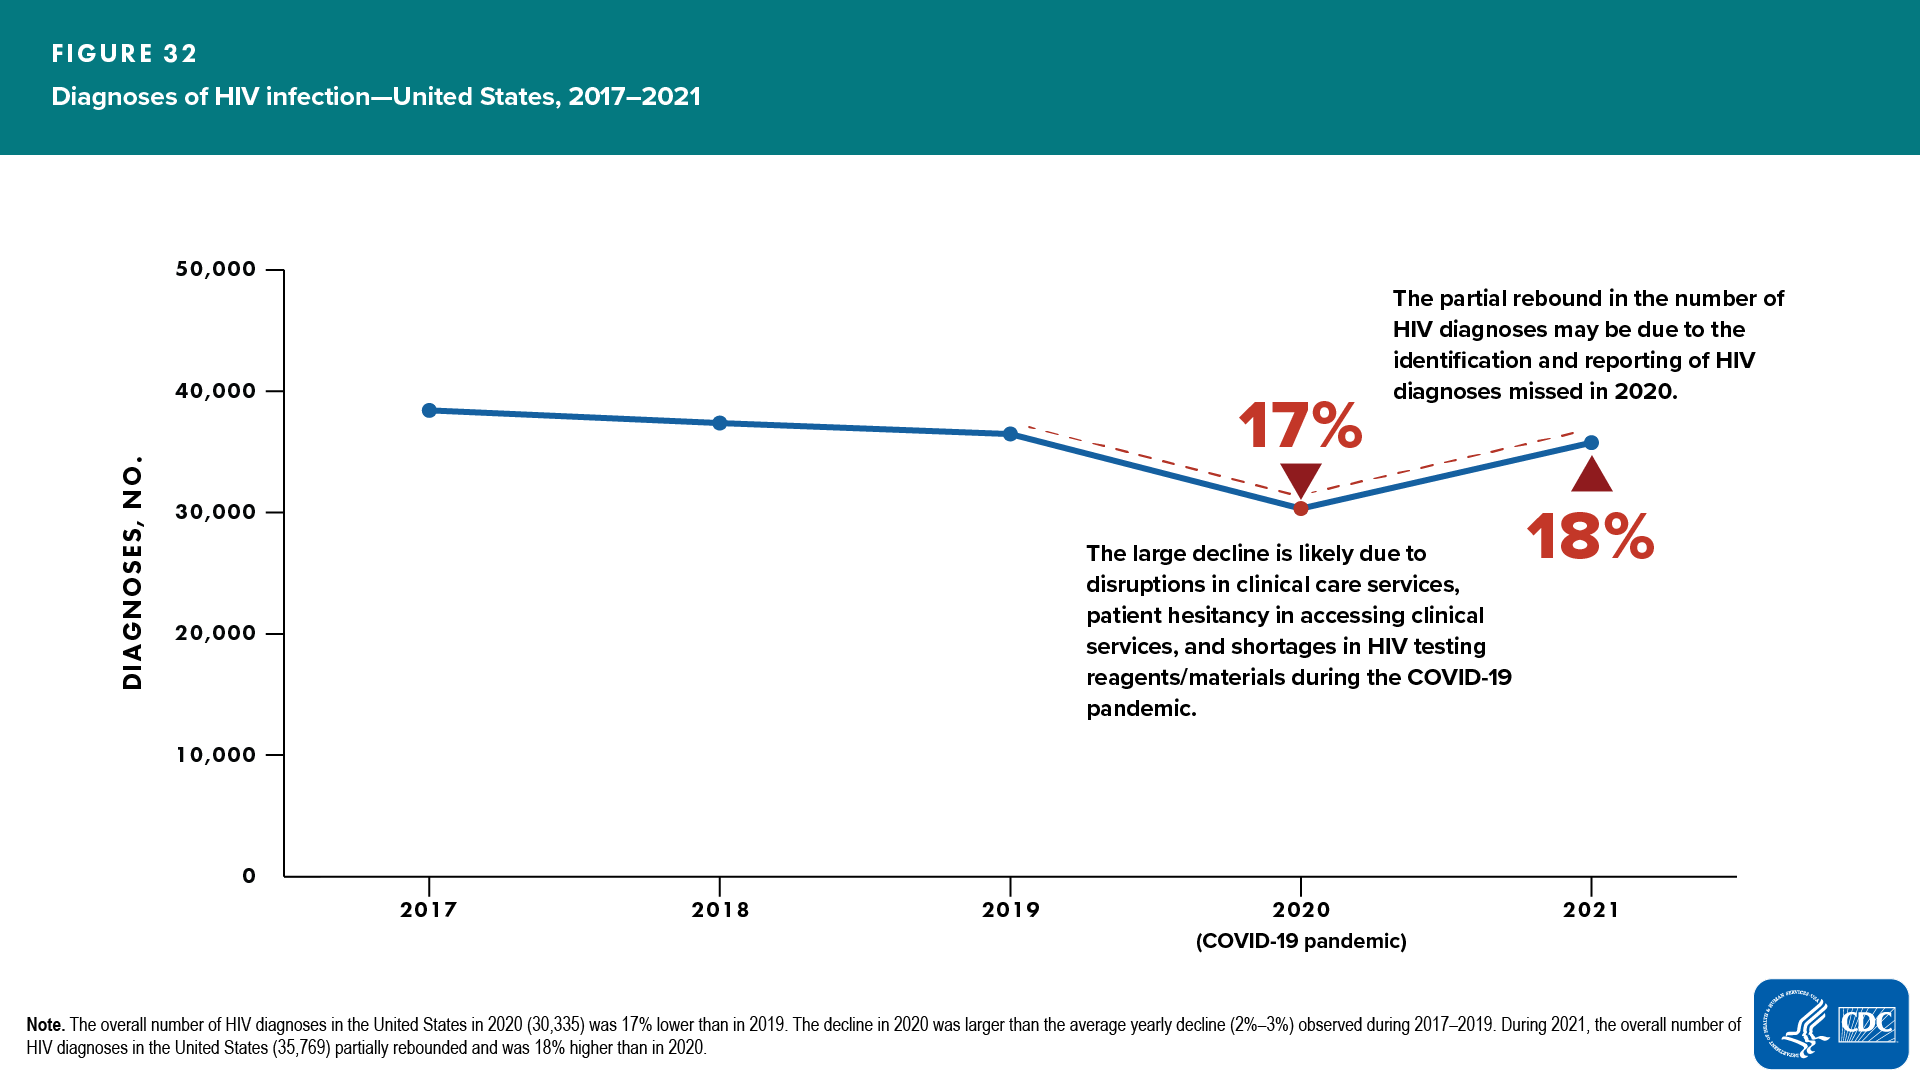
HIV diagnosis is a primary data element used in the CD4 model for estimating HIV incidence and prevalence. A key assumption of the CD4 model is stable HIV testing during the most recent years of the analysis. HIV diagnoses declined 17% from 2019 to 2020 [7, 8]. The steep reduction in diagnoses in 2020 was likely due to disruptions in HIV testing and other clinical care services, patient hesitancy in accessing clinical services, and shortages in HIV testing reagents/materials during the COVID-19 pandemic [8–13] (Figure 32).
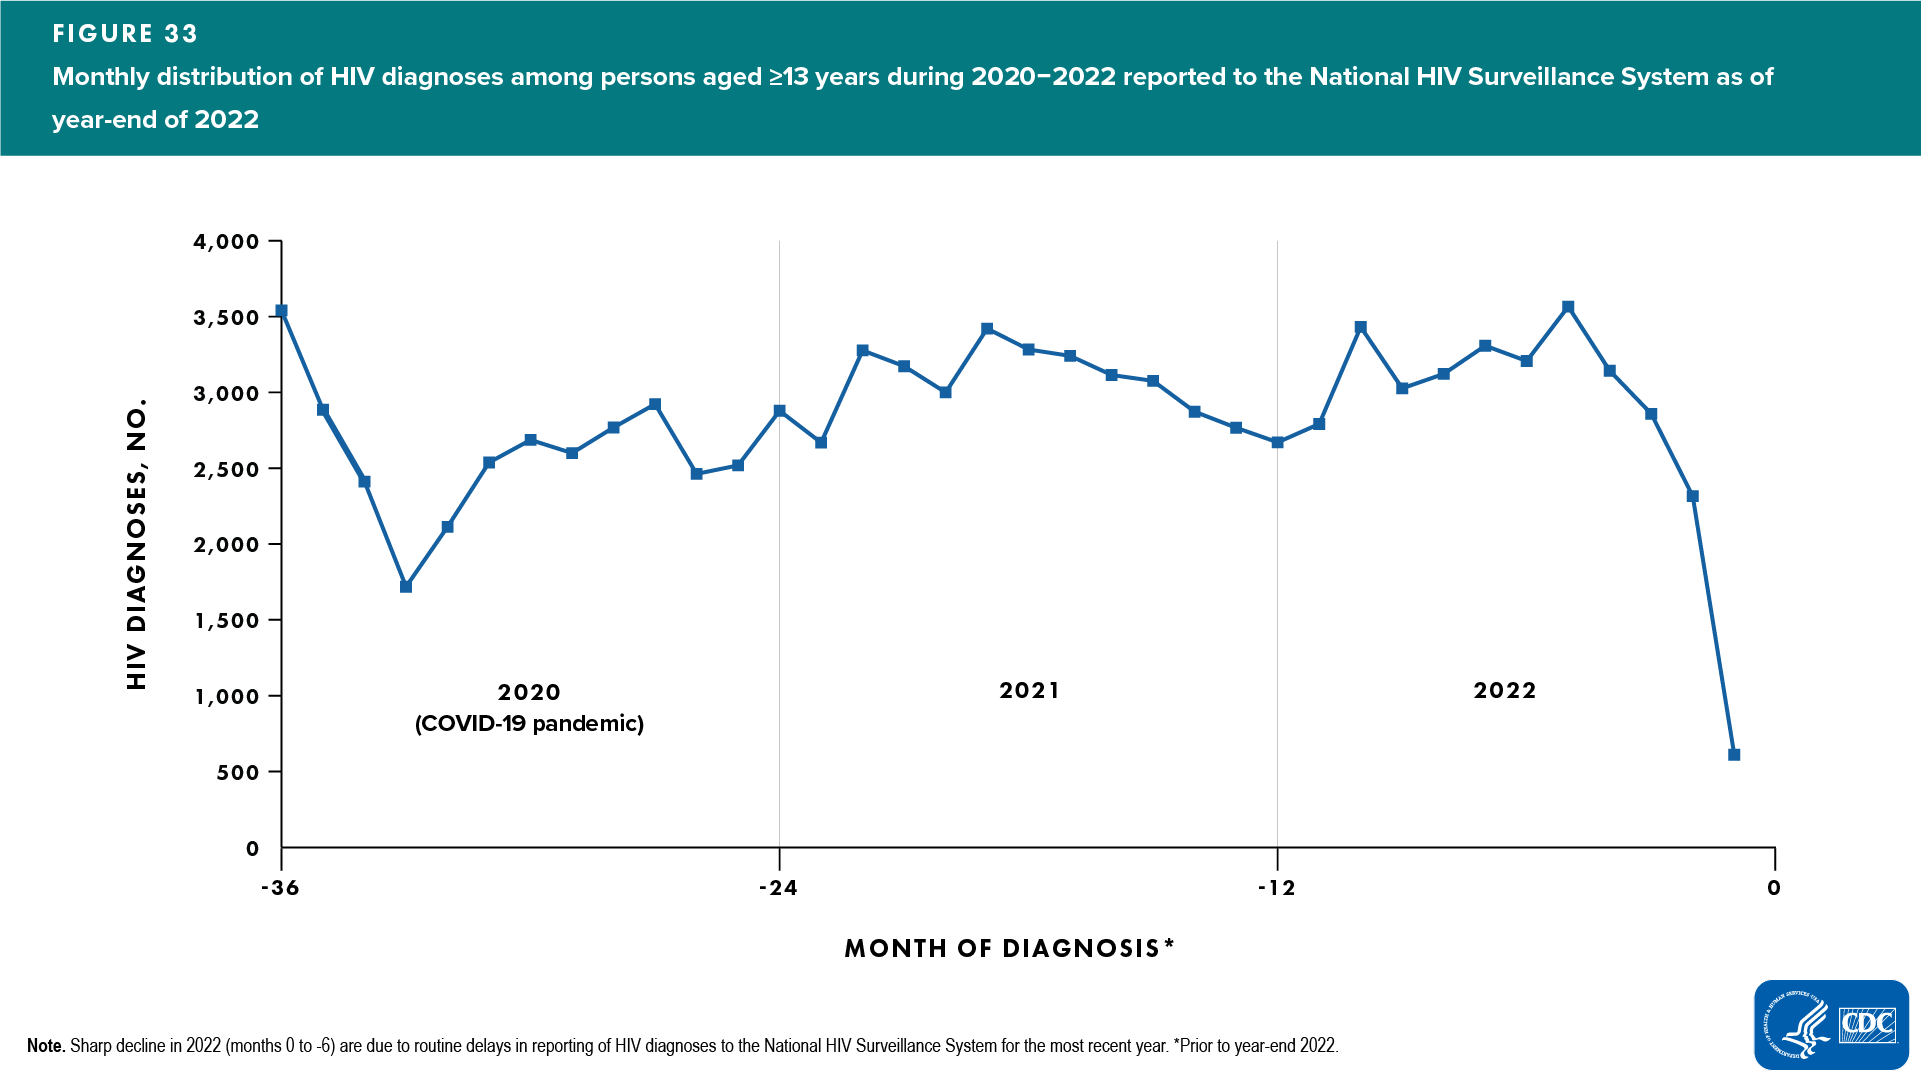
In addition to the sharp decline in the overall annual number of diagnoses, there was a sharp decline in diagnoses reported during the early months of 2020 (February–April) when nationwide shelter in place orders were in effect (Figure 33). Consequently, the COVID-19 pandemic contributed to excess delays in HIV diagnosis which violates the assumption of stable testing [18].
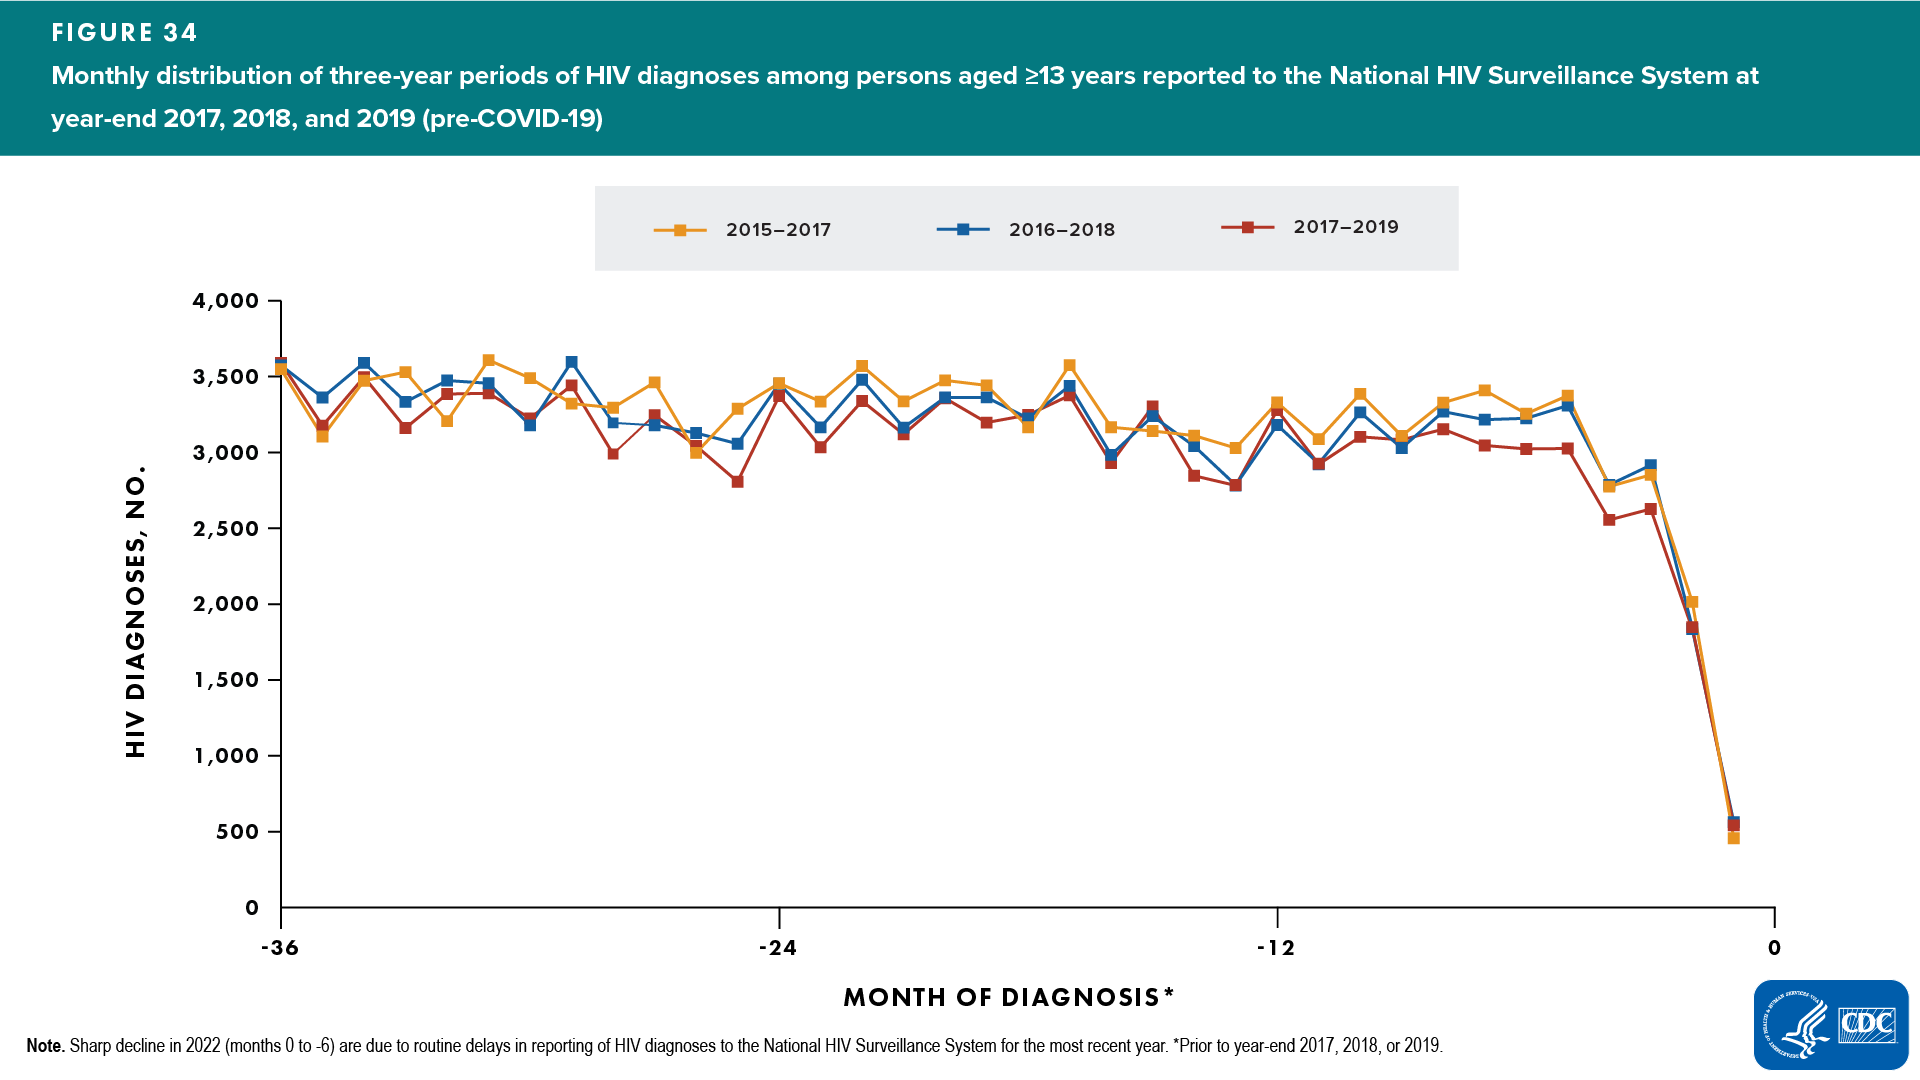
To satisfy the assumption of stable HIV testing required for using the CD4 model, CDC developed an Adjusted Diagnoses Method by which the monthly distribution of HIV diagnoses reported to CDC during 2020–2022 (years affected by COVID-19) was adjusted to match the average monthly distribution of diagnoses reported during the previous 3 sets of 3-year pre-COVID periods (2015–2017, 2016–2018, 2017–2019). It is possible for the total number of diagnoses in each of the 3-year period to be different (depending on incidence and testing rate), while the monthly distribution of reported diagnoses during each of those three years can be the same. A 3-year period was used to adjust the monthly distribution of reported HIV diagnoses because COVID-19 has affected three years of diagnoses data reported to CDC (2020, 2021, and 2022). Three sets of 3-year periods (2015–2017, 2016–2018, 2017–2019) were used to produce more stable estimates for a 3-year monthly distribution (Figure 34).
The adjusted monthly diagnoses for years 2020–2022 were calculated using the following steps:
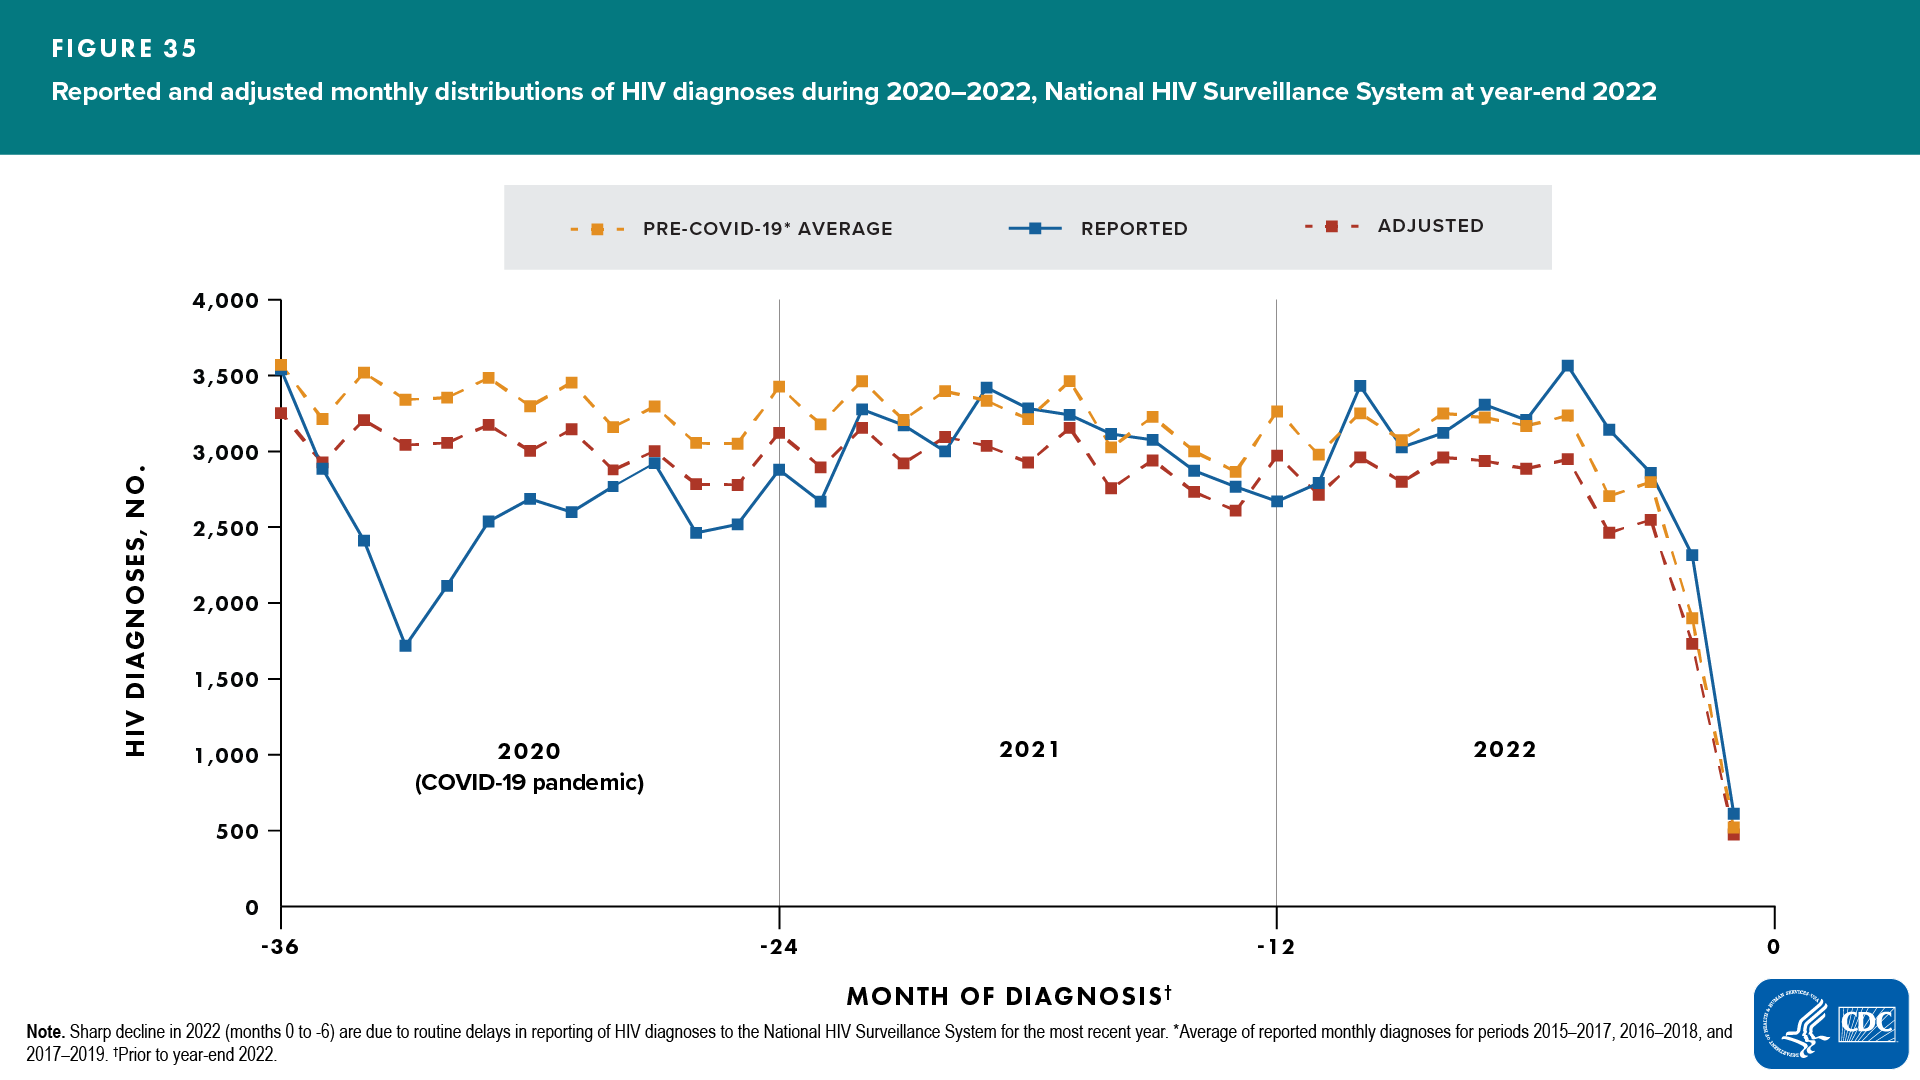
- The monthly average of reported numbers of diagnoses from 3 sets of pre-COVID 3-year periods (2015–2017, 2016–2018, 2017–2019; Figure 34) was calculated and used as a “template” for the typical 3-year pattern of HIV diagnoses in the United States (Figure 35, “Average” line).
- The 3-year pattern “template” was used as a guide to recreate the pattern of monthly diagnoses reported during 2020–2022. The “template” was scaled (by a factor of K) to keep the same averaged pattern but to match the total cumulative number of reported diagnoses during years 2020–2022 (Figure 35, “Adjusted” line).
Adjusted Number of Diagnoses for a month in 2020–2022 =
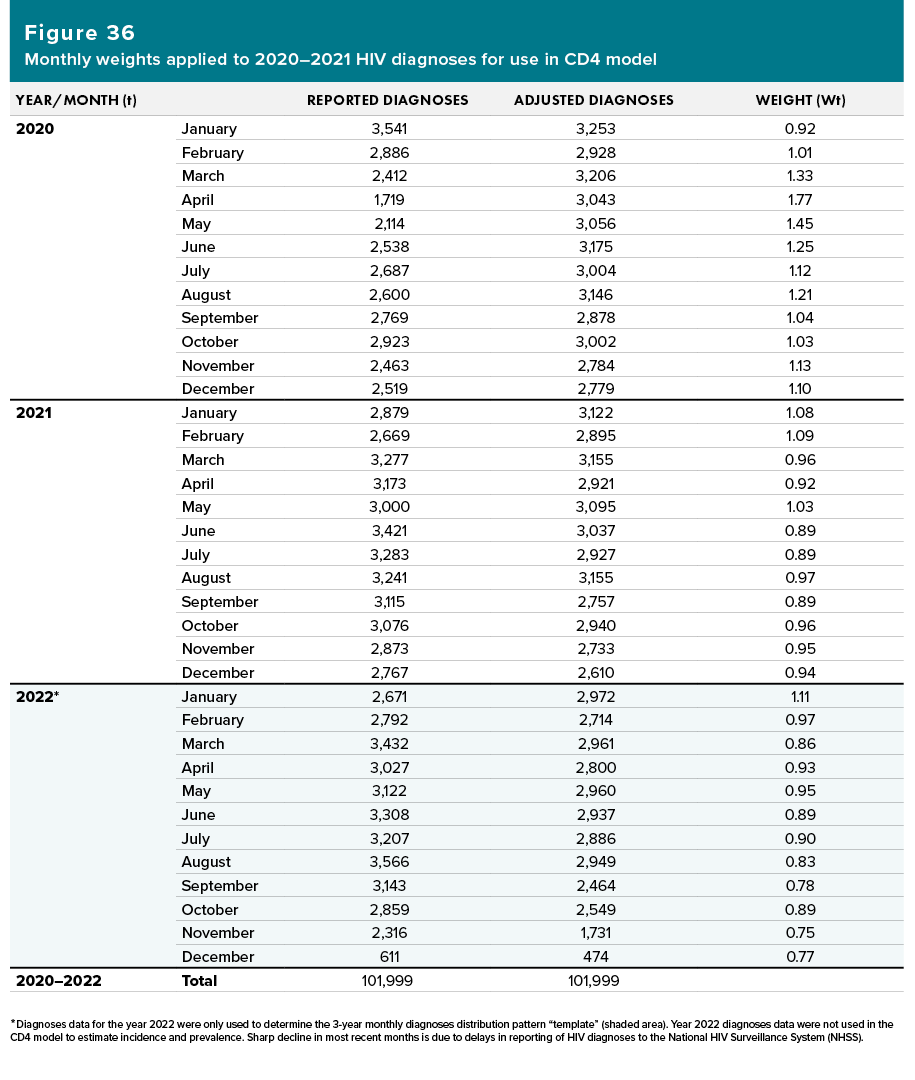
- Monthly weights were calculated based on the reported monthly reported diagnoses data for years 2020–2022 and the adjusted monthly diagnoses derived from the previous step. (Note. The cumulative number of diagnoses reported during years 2020–2022 is not adjusted; see Figure 36.)
The reported monthly diagnoses data and monthly weights for years 2020–2021 were used in the CD4 model to estimate incidence and prevalence. Diagnoses data for the year 2022 were only used to determine the 3-year monthly diagnoses distribution pattern “template” (Figure 36, shaded area). Diagnoses data for the year 2022 were not included in the diagnoses data used in the CD4 model to estimate incidence and prevalence.
- Effects of covariates (assigned sex at birth, age, race/ethnicity, transmission category) were considered in the process of producing monthly weights.
Assumptions of Adjusted Diagnoses Method. Estimates for years 2020 and 2021 should be interpreted with caution. We interpret the use of adjusted diagnoses as how HIV diagnoses would have been reported to CDC if COVID-19 did not cause excess delays. The validity of the adjustments made to the monthly distribution of HIV diagnoses for 2020 and 2021 relies on the following three assumptions:
- That there were longer-than-normal delays in the time from acquiring HIV infection to diagnosis during 2020 and 2021 because of the adverse impact of COVID-19 on HIV testing and diagnosis in the United States during those years. This assumption is supported by published studies [18, 19].
- That all delayed HIV diagnoses were recovered and reported to CDC by December 2022. If this assumption is not true, incidence estimates produced for years 2020 and 2021, based on the adjusted data, may be lower than they should be.
- That there would have been a similar pattern (relative distribution) of monthly reported HIV diagnoses during 2020‒2022 compared to previous years if COVID-19 had not delayed any diagnoses.
Important note. HIV incidence and prevalence estimates for years presented in this report may change in the future when more diagnoses data have been reported to CDC. The most recent years’ estimates are the most unreliable due to delays in reporting of diagnoses to CDC.
D. Tabulation and Presentation of Data
Numbers and percentages in this surveillance supplemental report (except numbers of persons living with diagnosed HIV infection) were estimated by using the CD4 depletion model [3–6]. The estimated numbers and rates of HIV incidence and the estimated numbers, rates, and percentages of persons living with diagnosed or undiagnosed infection are presented with associated 95% confidence intervals in the tables. The data are organized into 2 sections: National Profile and Special Focus Profiles. For both the National Profile and Special Focus Profiles, figures are presented. The tables are organized into 3 sections:
- Tables 1‒6: numbers and rates of estimated HIV incidence among persons aged ≥13 years
- Tables 7‒13: numbers and rates of estimated HIV prevalence among persons aged ≥13 years (persons living with diagnosed or undiagnosed infection); numbers and percentages of persons living with undiagnosed infection (Table 7) or living with diagnosed infection (Tables 8‒13)
- Appendix
- Table A1: numbers and rates of estimated HIV incidence among persons aged ≥13 years residing in Ending the HIV Epidemic Phase I jurisdictions
- Table A2: numbers and rates of estimated HIV prevalence among persons aged ≥13 years (persons living with diagnosed or undiagnosed infection); numbers (reported to NHSS) and estimated percentage of persons living with diagnosed infection residing in Ending the HIV Epidemic Phase I jurisdictions
D1. Age
For this report, age assignments are based on the following:
- For presentations of estimated HIV incidence (Tables 1–5), age group assignment (e.g., 13–24 years) is based on age at infection
- For presentations of estimated HIV prevalence (Tables 7–12), age group assignment is based on age as of December 31 of the specified year
D2. Assigned Sex at Birth (ASAB)
Sex designations in this report are based on a person’s assigned sex at birth. Data for gender are not provided in this report because the small numbers for transgender persons and persons of additional gender identity yield unreliable estimates.
D3. Race and Ethnicity
In the Federal Register for October 30, 1997, the Office of Management and Budget (OMB) announced the Revisions to the Standards for the Classification of Federal Data on Race and Ethnicity. Implementation by January 1, 2003, was mandated [20].
More information on race and ethnicity can be found in the Technical Notes of the 2021 HIV Surveillance Report at https://www.cdc.gov/hiv/library/reports/hiv-surveillance.html.
D4. Transmission Categories
Transmission category is the term for the classification of cases that summarizes a person’s (aged ≥13 years) possible HIV risk factors; the summary classification results from selecting, from the presumed hierarchical order of probability, the 1 (single) risk factor most likely to have been responsible for transmission.
More information on transmission categories can be found in the Technical Notes of the 2021 HIV Surveillance Report at https://www.cdc.gov/hiv/library/reports/hiv-surveillance.html.
D5. Geographic Designations
The 4 regions of residence used in this report are defined by the U.S. Census Bureau as follows:
Northeast: Connecticut, Maine, Massachusetts, New Hampshire, New Jersey, New York, Pennsylvania, Rhode Island, and Vermont
Midwest: Illinois, Indiana, Iowa, Kansas, Michigan, Minnesota, Missouri, Nebraska, North Dakota, Ohio, South Dakota, and Wisconsin
South: Alabama, Arkansas, Delaware, District of Columbia, Florida, Georgia, Kentucky, Louisiana, Maryland, Mississippi, North Carolina, Oklahoma, South Carolina, Tennessee, Texas, Virginia, and West Virginia
West: Alaska, Arizona, California, Colorado, Hawaii, Idaho, Montana, Nevada, New Mexico, Oregon, Utah, Washington, and Wyoming
E. Limitations of Data, Assumptions, and Reliability
E1. Limitations
The CD4 model can be used to produce estimates of HIV incidence, prevalence, and undiagnosed infection for any population, at any level of stratification for which surveillance data are available. However, when stratifying variables to produce estimates for select populations, one must take the following into consideration:
- Reliability of estimates, as measured by RSE (primary consideration). Smaller populations generally result in less reliable estimates.
- Stratification variables. Assigned sex at birth, race/ethnicity, transmission category, and age are acceptable variables for stratifications. Other variables should be used with caution because the modeling for diagnosis delay does not account for them.
- Completeness of CD4 data. By December 2022, a CD4 test result had been reported to NHSS for 93.8% of persons with HIV infection diagnosed during 2017–2021. However, completeness of reporting varied among states and local jurisdictions.
- Impact of migration (for geographic analyses). Geographic areas are assumed to be closed (people get infected, receive a diagnosis, and die in the area under consideration) or balanced (approximately the same number of infected people moved into or out of the area under consideration). Smaller geographic areas are less likely to be closed or balanced; estimates should be interpreted with caution.
Important note. HIV incidence and prevalence estimates for years presented in this report may change in the future when more diagnoses data have been reported to CDC. The most recent years’ estimates are the most unreliable due to delays in reporting of diagnoses to CDC.
E2. Assumptions of CD4 Model
The CD4 model relies on a series of assumptions:
- The CD4 depletion model is accurate.
- Persons received no treatment before the first CD4 test.
- All data adjustments (e.g., multiple imputation for missing values of transmission category, weighting to account for cases without a CD4 test, adjusted monthly distribution of diagnoses to address COVID-19 impact) are unbiased.
- The distribution of diagnosis delay is relatively stable (no significant change in testing over time).
- A person’s HIV infection, diagnosis, and death occur in a closed population (no migration).
Suggested Readings
- CDC. HIV Surveillance Report, 2021; vol.34. https://www.cdc.gov/hiv/library/reports/hiv-surveillance.html. Published May 2023. Accessed May 2023.
- CDC [Branson BM, Handsfield HH, Lampe MA, et al]. Revised recommendations for HIV testing of adults, adolescents, and pregnant women in health-care settings. MMWR 2006;55(RR-14):1–17. https://www.cdc.gov/mmwr/indrr_2006.html. Accessed May 3, 2023.
- CDC [Selik RM, Mokotoff ED, Branson B, Owen SM, Whitmore S, Hall HI]. Revised surveillance case definition for HIV infection—United States, 2014. MMWR 2014;63(RR-03):1–10. https://www.cdc.gov/mmwr/indrr_2014.html. Accessed May 3, 2023.
- CDC [Schneider E, Whitmore S, Glynn MK, Dominguez K, Mitsch A, McKenna MT]. Revised surveillance case definitions for HIV infection among adults, adolescents, and children aged <18 months and for HIV infection and AIDS among children aged 18 months to <13 years—United States, 2008. MMWR 2008;57(RR-10):1–12. https://www.cdc.gov/mmwr/preview/mmwrhtml/rr5710a1.htm. Accessed May 3, 2023.
- Hall HI, Song R, Tang T, et al. HIV trends in the United States: Diagnoses and estimated incidence. JMIR Public Health Surveill 2017;3(1):e8. doi:10.2196/publichealth.7051
- Satcher Johnson A, Song R. Incident and prevalent HIV infections attributed to sexual transmission in the United States, 2018. Sex Transm Dis 2021;48(4):285–291. doi:10.1097/OLQ.0000000000001354
- Satcher Johnson A, Song R, Hall HI. Estimated HIV incidence, prevalence, and undiagnosed infections in US states and Washington, DC, 2010–2014. J Acquir Immune Defic Syndr 2017;76(2):116–122. doi:10.1097/QAI.0000000000001495
- Singh S, Song R, Satcher Johnson A, McCray E, Hall HI. HIV incidence, HIV prevalence, and undiagnosed HIV infections in men who have sex with men, United States. Ann Intern Med 2018;168(10):685–694. doi:10.7326/M17-2082

- HHS. What is ‘Ending the HIV Epidemic: A Plan for America’? https://www.hiv.gov/federal-response/ending-the-hiv-epidemic/overview. Published October 4, 2019. Accessed May 3, 2023.
- Rodger AJ, Cambiano V, Bruun T, et al. Sexual activity without condoms and risk of HIV transmission in sero-different couples when the HIV-positive partner is using suppressive antiretroviral therapy. JAMA 2016;316(2):171–181. doi:10.1001/jama.2016.5148
- Song R, Hall HI, Green TA, Szwarcwald CL, Pantazis N. Using CD4 data to estimate HIV incidence, prevalence, and percent of undiagnosed infections in the United States. J Acquir Immune Defic Syndr 2017;74(1):3–9. doi:10.1097/QAI.0000000000001151
- Hall HI, Song R, Szwarcwald CL, Green T. Time from infection with the human immunodeficiency virus to diagnosis, United States. J Acquir Immune Defic Syndr 2015; 69(2):248–251. doi:10.1097/QAI.0000000000000589
- Lodi S, Phillips A, Touloumi G, et al; for CASCADE Collaboration in EuroCoord. Time from human immuno-deficiency virus seroconversion to reaching CD4+ cell count thresholds <200, <350, and <500 cells/mm3: assessment of need following changes in treatment guidelines. Clin Infect Dis 2011;53(8):817–825. doi:10.1093/cid/cir494
- Touloumi G, Pantazis N, Pillay D, et al; for CASCADE Collaboration in EuroCoord. Impact of HIV-1 subtype on CD4 count at HIV seroconversion, rate of decline, and viral load set point in European seroconverter cohorts. Clin Infect Dis 2013;56(6):888–897. doi:10.1093/cid/cis1000
- CDC [Schuchat A, CDC COVID-19 Response Team]. Public health response to the initiation and spread of pandemic COVID-19 in the United States, February 24–April 21, 2020. MMWR 2020;69(18):551–556. doi:10.15585/mmwr.mm6918e2
- CDC. HIV Surveillance Report, 2020; vol. 33. https://www.cdc.gov/hiv/library/reports/hiv-surveillance.html. Published May 2022. Accessed May 3, 2023.
- Delaney KP, Jayanthi P, Emerson B, et al. Impact of COVID-19 on commercial laboratory testing for HIV in the United States. 2021 CROI, March 6–10, 2021. Abstract 739.
- Moitra E, Tao J, Olsen J, et al. Impact of the COVID-19 pandemic on HIV testing rates across four geographically diverse urban centres in the United States: an observational study. Lancet Reg Health Am 2022;7:100159. doi:10.1016/j.lana.2021.100159
- Chang JJ, Chen Q, Hechter RC, Dionne-Odom J, Bruxvoort K. Changes in HIV and STI testing and diagnoses during the COVID-19 pandemic. 2022 CROI, February 12–16 and 22–24, 2022. Oral Abstract 142.
- Hoover KW, Zhu W, Gant ZC, et al. HIV services and outcomes during the COVID-19 pandemic—United States, 2019–2021. MMWR 2022;71(48):1505–1510. doi:10.15585/mmwr.mm7148a1
- CDC [DiNenno EA, Delaney KP, Pitasi MA, et al.] HIV testing before and during the COVID-19 pandemic—United States, 2019–2020. MMWR 2022;71(25):820–824. doi:10.15585/mmwr.mm7125a2
- CDC. HIV Surveillance Report, 2021; vol. 34. https://www.cdc.gov/hiv/library/reports/hiv-surveillance.html Published May 2023. Accessed May 2023.
- Collins J, Niakan K, Schweitzer K, Silseth S. Study of the impact of COVID-19 on HIV testing, diagnosis, and treatment in the United States. Published October 2022. Milliman White Paper available at https://www.milliman.com/en/insight/impact-of-covid-19-on-hiv. Accessed May 3, 2023.
- Klein RJ, Proctor SE, Boudreault MA, Turczyn KM. Healthy People 2010 criteria for data suppression. Healthy People 2010 Stat Notes 2002;(No. 24):1–11. https://www.cdc.gov/nchs/data/statnt/statnt24.pdf. Accessed May 3, 2023.
- U.S. Census Bureau. Population and housing unit estimates datasets. https://www.census.gov/programs-surveys/popest/data/data-sets.html. May 3, 2023.
- Viguerie A, Song R, Johnson AS, Lyles CM, Hernandez A, Farnham PG. Isolating the effect of COVID-19–related disruptions on HIV diagnoses in the United States in 2020. J Acquir Immune Defic Syndr 2023;92(4):293–299. doi:10.1097/QAI.0000000000003140
- CDC [DiNenno EA, Delaney KP, Pitasi MA, et al]. HIV testing before and during the COVID-19 pandemic—United States, 2019–2020. MMWR 2022;71(25):820–824. doi:10.15585/mmwr.mm7125a2
- Office of Management and Budget. Revisions to the standards for the classification of federal data on race and ethnicity. Federal Register 1997;62:58782–58790. https://www.federalregister.gov/documents/1997/10/30/97-28653/revisions-to-the-standards-for-the-classification-of-federal-data-on-race-and-ethnicity. Accessed May 3, 2023.
