Social Determinants of Health among Adults with Diagnosed HIV Infection, 2019: Special Focus Profiles
The Special Focus Profiles section highlights disparities in rates of HIV diagnoses by SDH variables, including income inequality, and factors for special consideration in addressing health disparities that may be of particular interest to HIV prevention programs in state and local health departments.
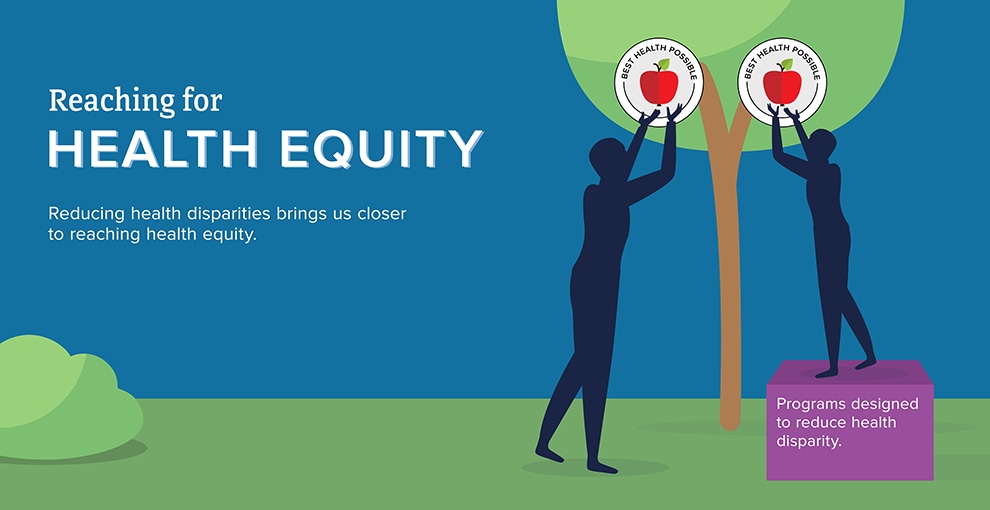
Health Disparities
Health disparities are avoidable differences in the incidence, prevalence, mortality, and causes of a disease and the related adverse health conditions that exist among specific population groups. Reducing health disparities, achieving health equity, and improving the health of all U.S. population groups are major goals of public health.
Most health disparities are related to SDH, the conditions in which people are born, grow, live, work, and age. Identification and awareness of differences among population health determinants and health outcomes are essential steps toward reducing health disparities. Most recent CDC reports show disparities by selected characteristics in many of the indicators for the EHE and NHSP initiatives. Success in achieving the goals of these initiatives will be determined to some extent by how effectively federal, state, and local agencies and private organizations work with communities to eliminate health disparities among populations experiencing a disproportionate burden of disease, disability, and death.
See Technical Notes for additional information on disparity measures.
Disparities—Poverty/Wealth, by Sex at Birth and Race/Ethnicity
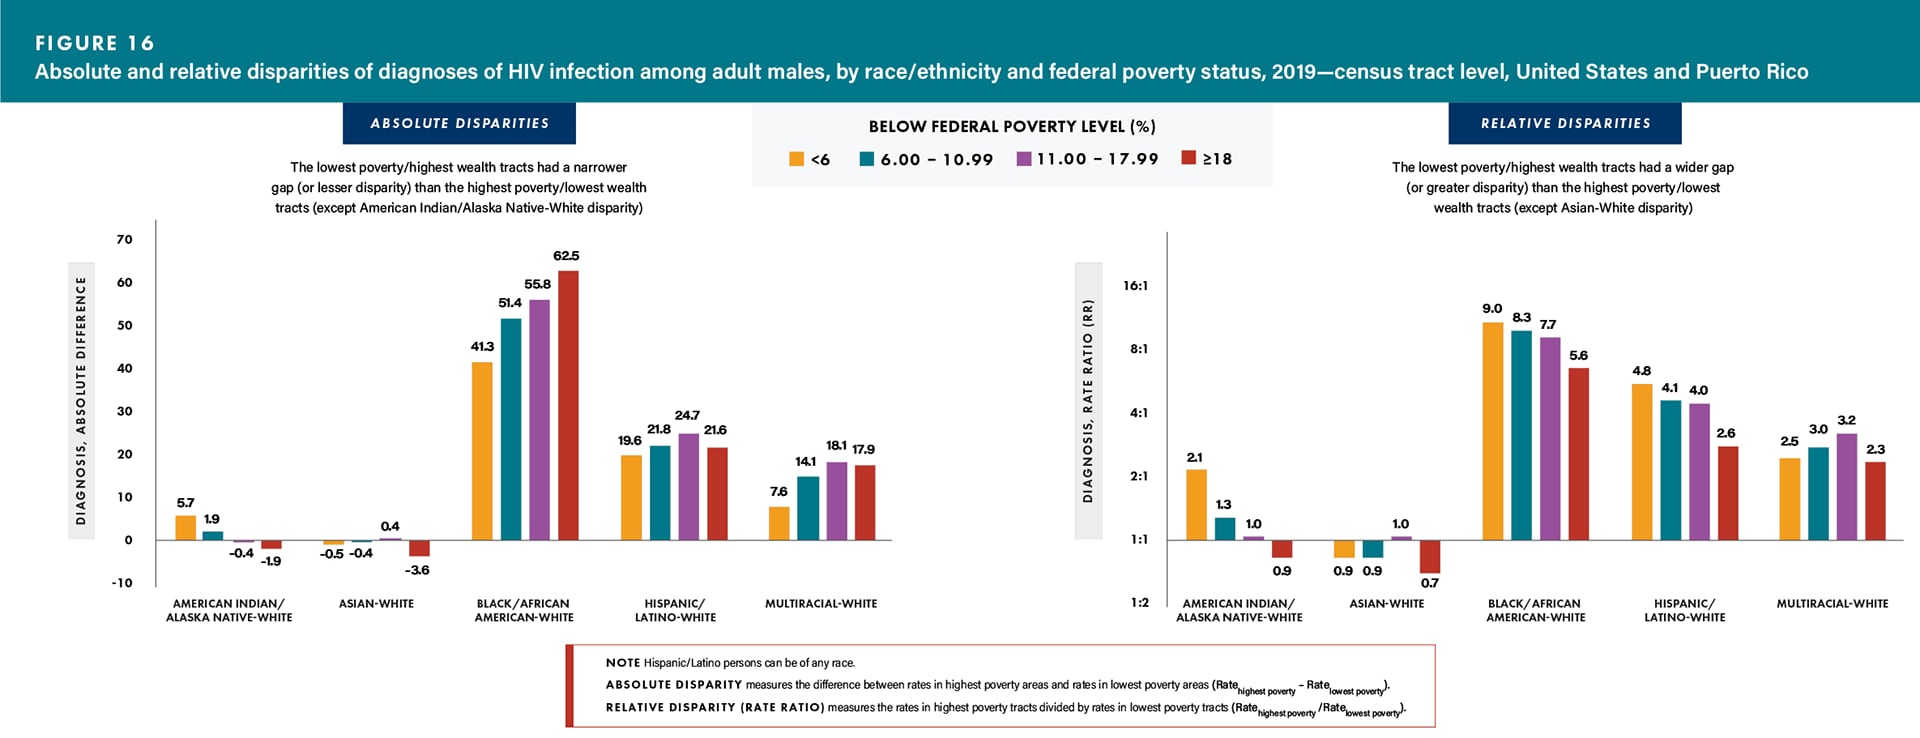
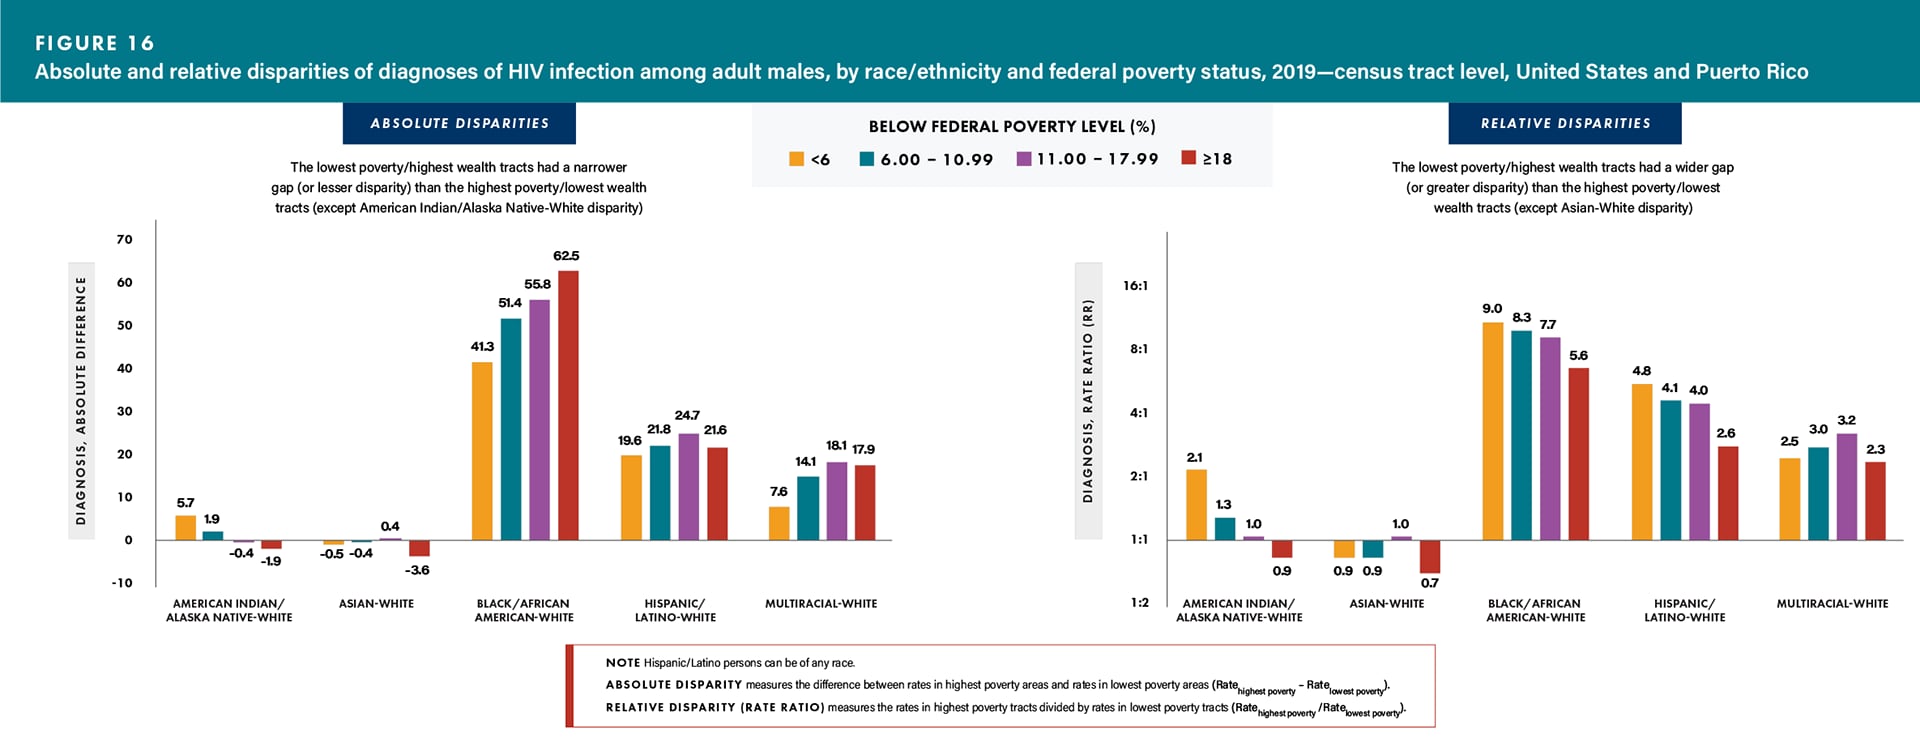
Highest poverty/lowest wealth: Among males residing in tracts with the highest poverty/lowest wealth, the relative disparities (rate ratios) of HIV diagnosis rates were as follows: Black/African American 5.6 times, Hispanic/Latino 2.6 times, and multiracial males 2.3 times as high as the rate for White males; the rate for White males was 1.4 times as high as the rate for Asian males (Figure 16 and Table 2).
Lowest poverty/highest wealth: Among males residing in tracts with the lowest poverty/highest wealth, the relative disparities (rate ratios) of HIV diagnosis rates were as follows: Black/African American 9.0 times, Hispanic/Latino 4.8 times, and multiracial males 2.5 times as high as the rate for White males; the rate for White males was 1.1 times as high as the rate for Asian males (Figure 16 and Table 2).
Changes in disparities:
- For absolute disparities, the lowest poverty/highest wealth tracts had a narrower gap (or lesser disparity) than in the highest poverty/lowest wealth tracts (except American Indian/Alaska Native–White disparity)
- For relative disparities, the lowest poverty/highest wealth tracts had a wider gap (or greater disparity) than in the highest poverty/lowest wealth tracts (except Asian–White disparity) (Figure 16).
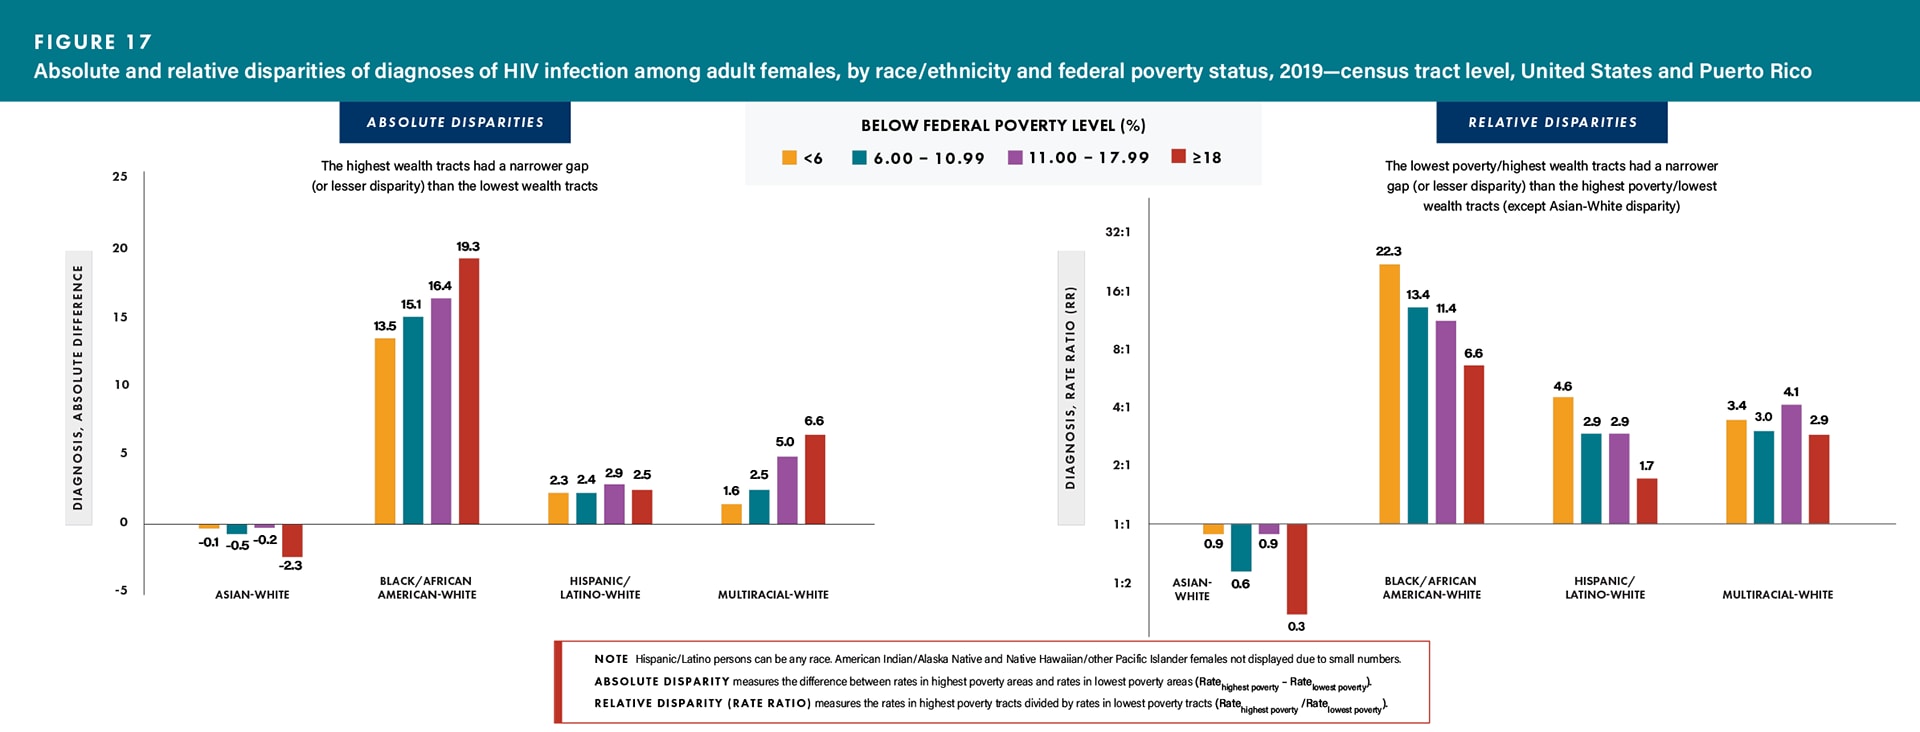
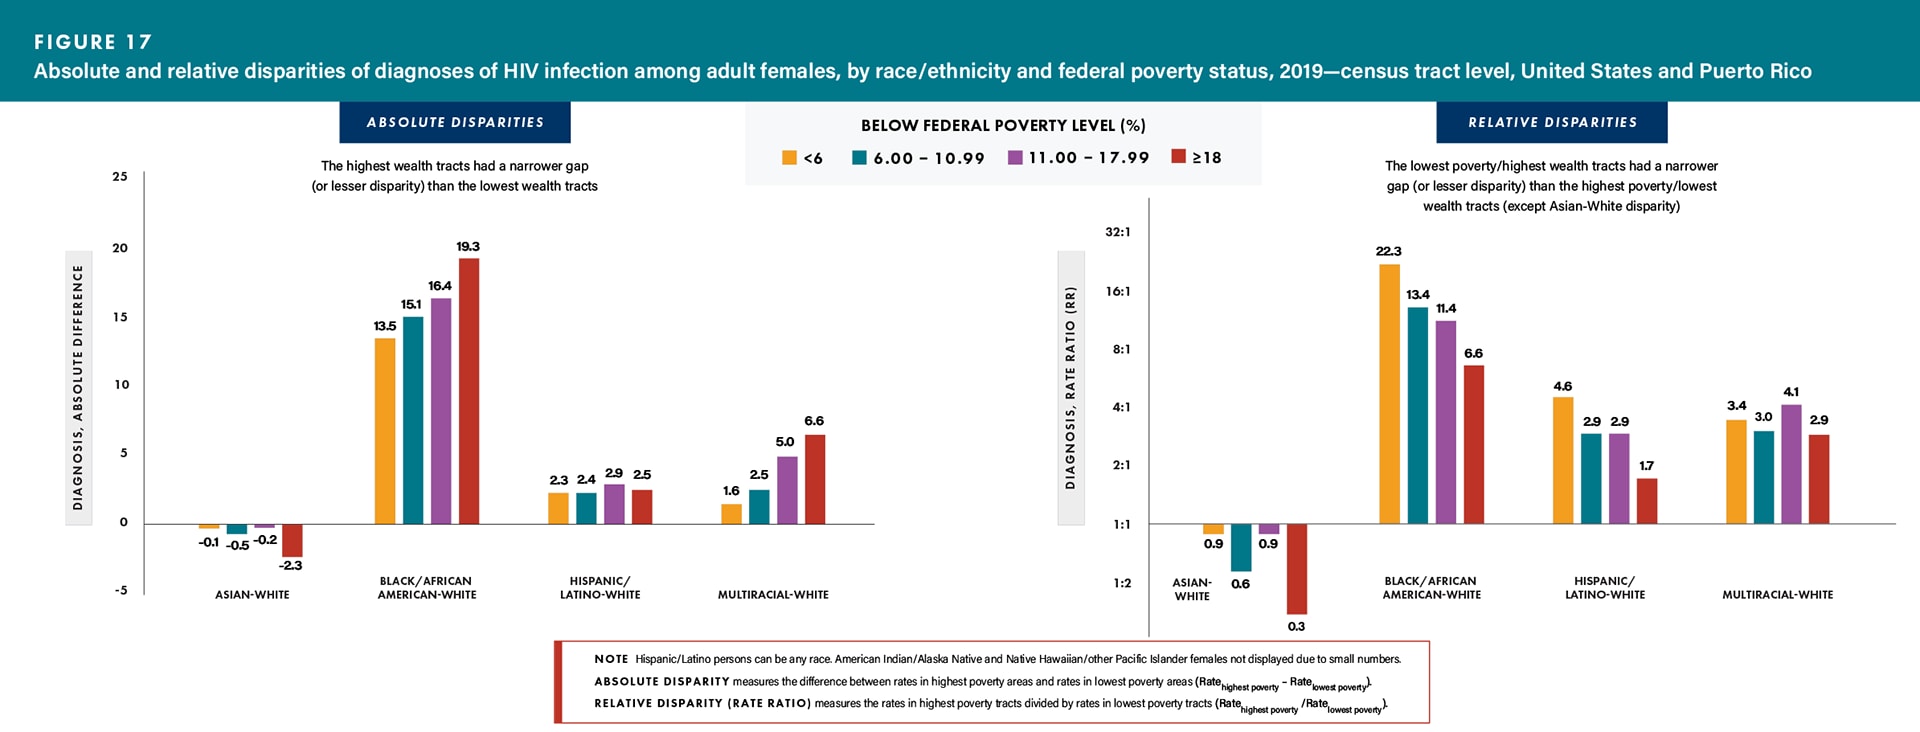
Highest poverty/lowest wealth: Among females residing in tracts with the highest poverty/lowest wealth, the relative disparities (rate ratios) of HIV diagnosis rates were as follows: Black/African American 6.6 times, Hispanic/Latino 1.7 times, and multiracial females 2.9 times as high as the rate for White females; the rate for White females was 2.9 times as high as the rate for Asian females (Figure 17 and Table 2).
Lowest poverty/highest wealth: Among females residing in tracts with the lowest poverty/highest wealth, the relative disparities (rate ratios) of HIV diagnosis rates were as follows: Black/African American 22.3 times, Hispanic/Latino 4.6 times, and multiracial females 3.5 times as high as the rate for White females; the rate for White females was 1.1 times as high as the rate for Asian females (Figure 17 and Table 2).
Changes in disparities:
- For absolute disparities, the lowest poverty/highest wealth tracts had a narrower gap (or lesser disparity) than in the highest poverty/lowest wealth tracts
- For relative disparities, the lowest poverty/highest wealth tracts had a wider gap (or greater disparity) than in the highest poverty/lowest wealth tracts (except Asian–White disparity) (Figure 17).
Disparities—Education, by Sex at Birth and Race/Ethnicity
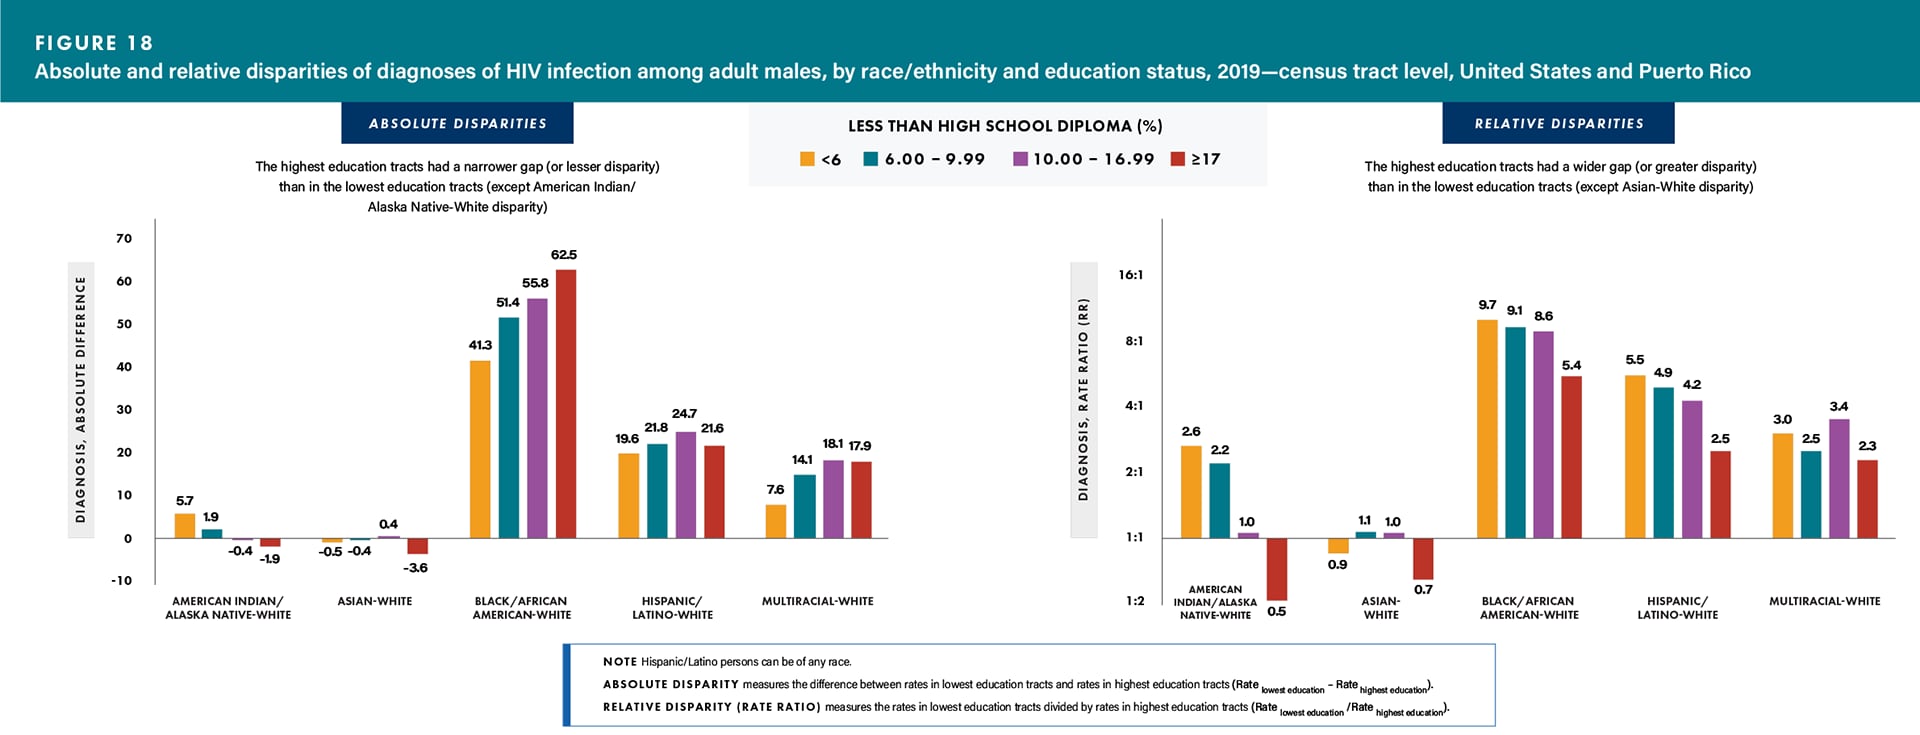
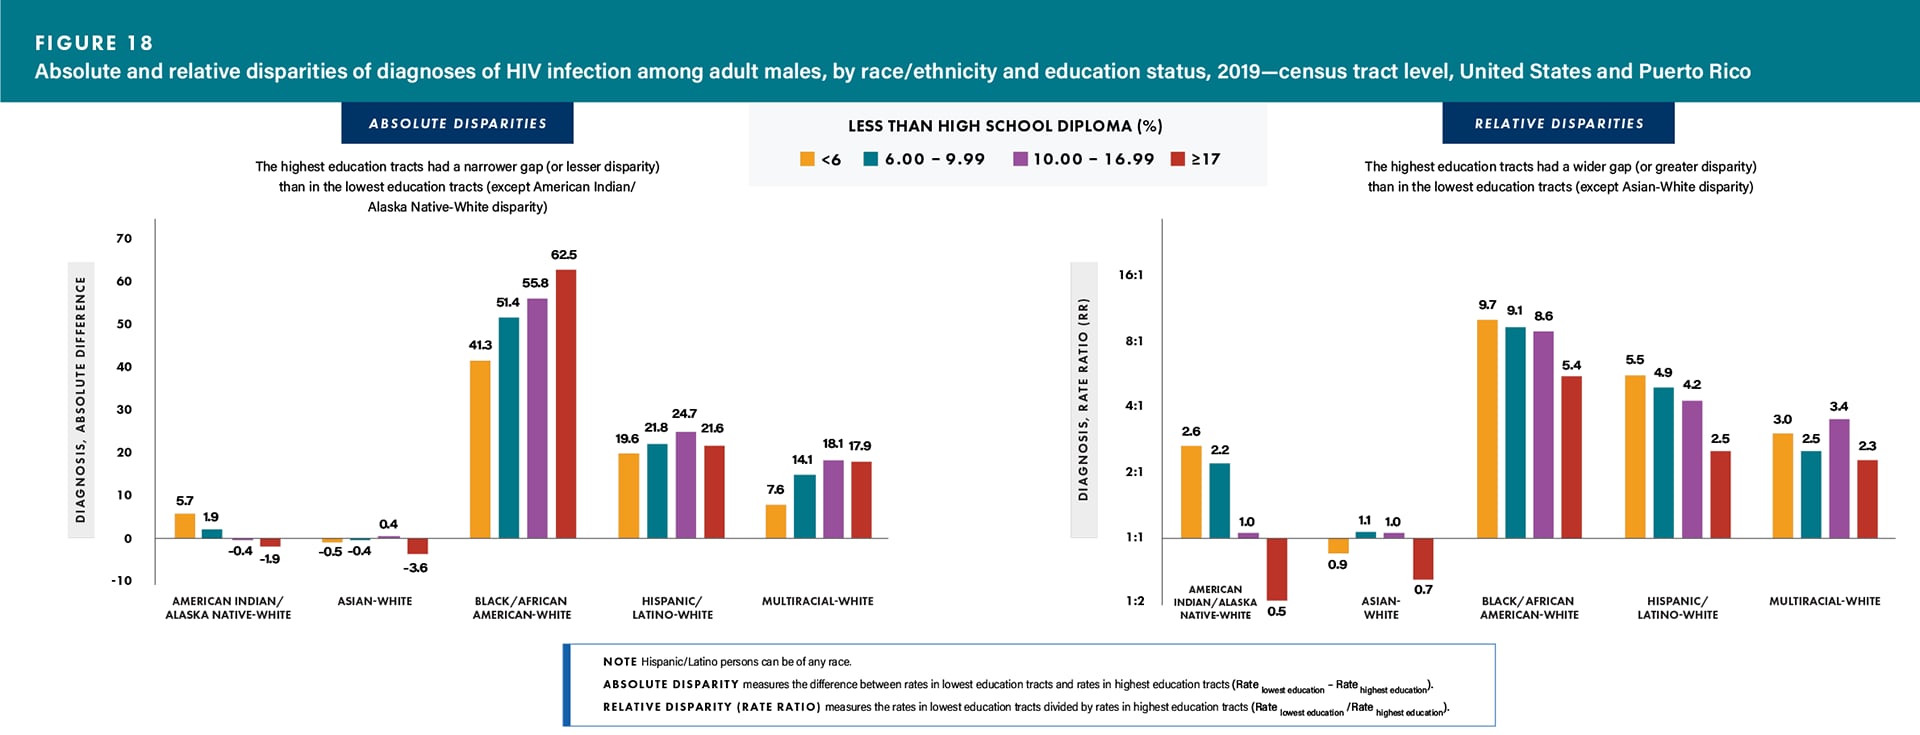
Lowest education: Among males residing in tracts with the lowest education, the relative disparities (rate ratios) of HIV diagnosis rates were as follows: Black/African American 5.4 times, Hispanic/Latino 2.5 times, and multiracial males 2.3 times as high as the rate for White males; the rate for White males was 1.5 times as high as the rate for Asian males (Figure 18 and Table 2).
Highest education: Among males residing in tracts with the highest education, the relative disparities (rate ratios) of HIV diagnosis rates were as follows: Black/African American 9.7 times, Hispanic/Latino 5.5 times, and multiracial males 3.0 times as high as the rate for White males; the rate for White males was 1.2 times as high as the rate for Asian males (Figure 18 and Table 2).
Changes in disparities:
- For absolute disparities, the highest education tracts had a narrower gap (or lesser disparity) than in the lowest education tracts (except American Indian/Alaska Native–White disparity)
- For relative disparities, the highest education tracts had a wider gap (or greater disparity) than in the lowest education tracts (except Asian–White disparity) (Figure 18).
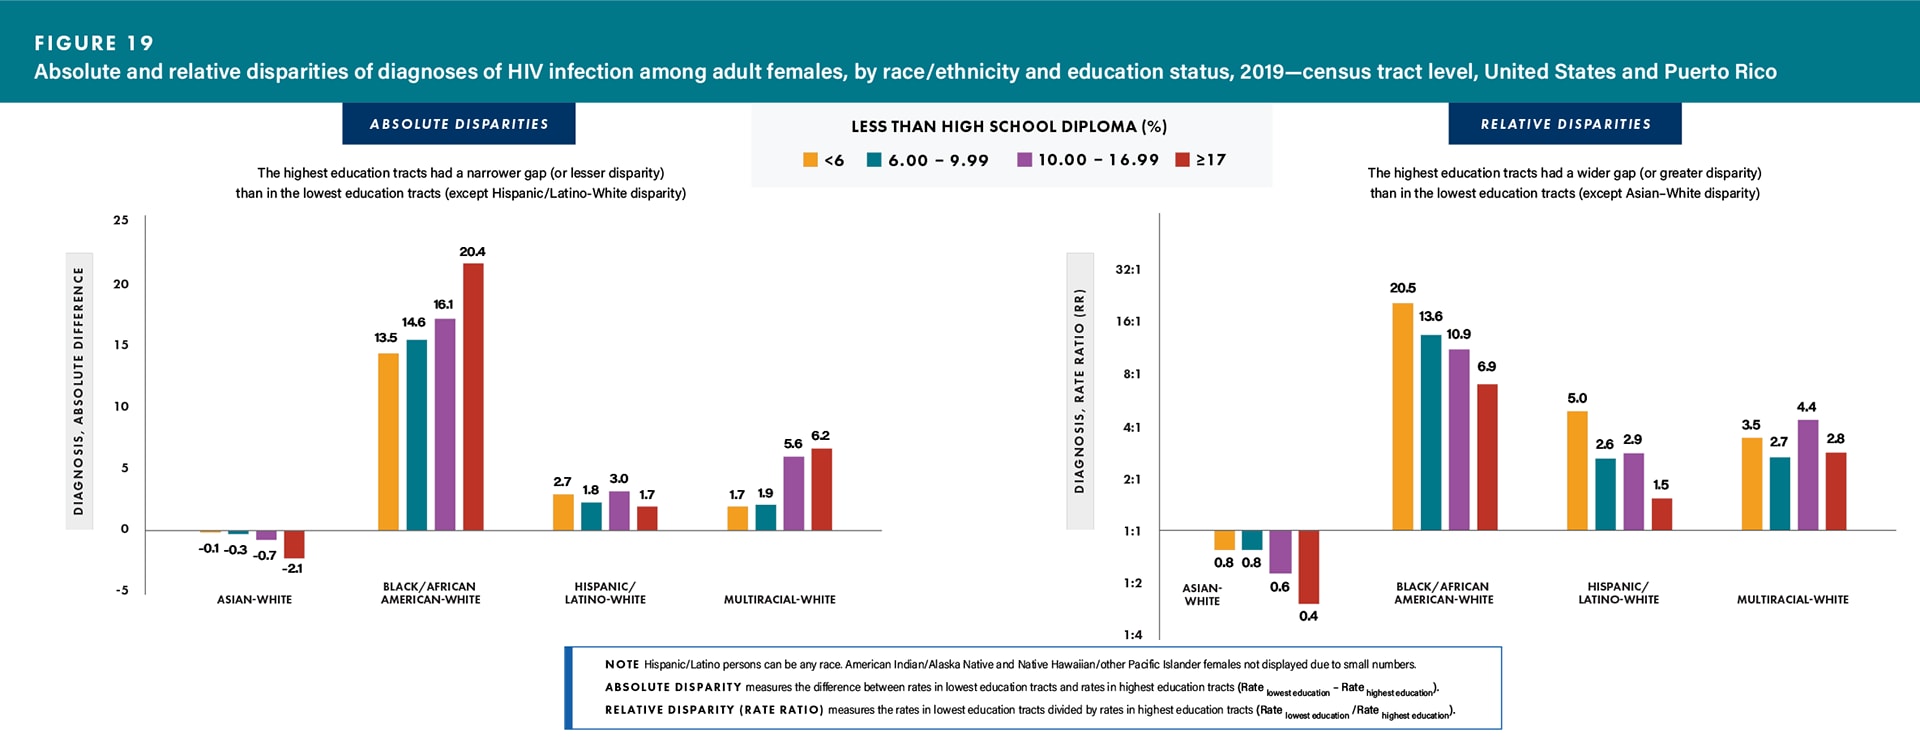
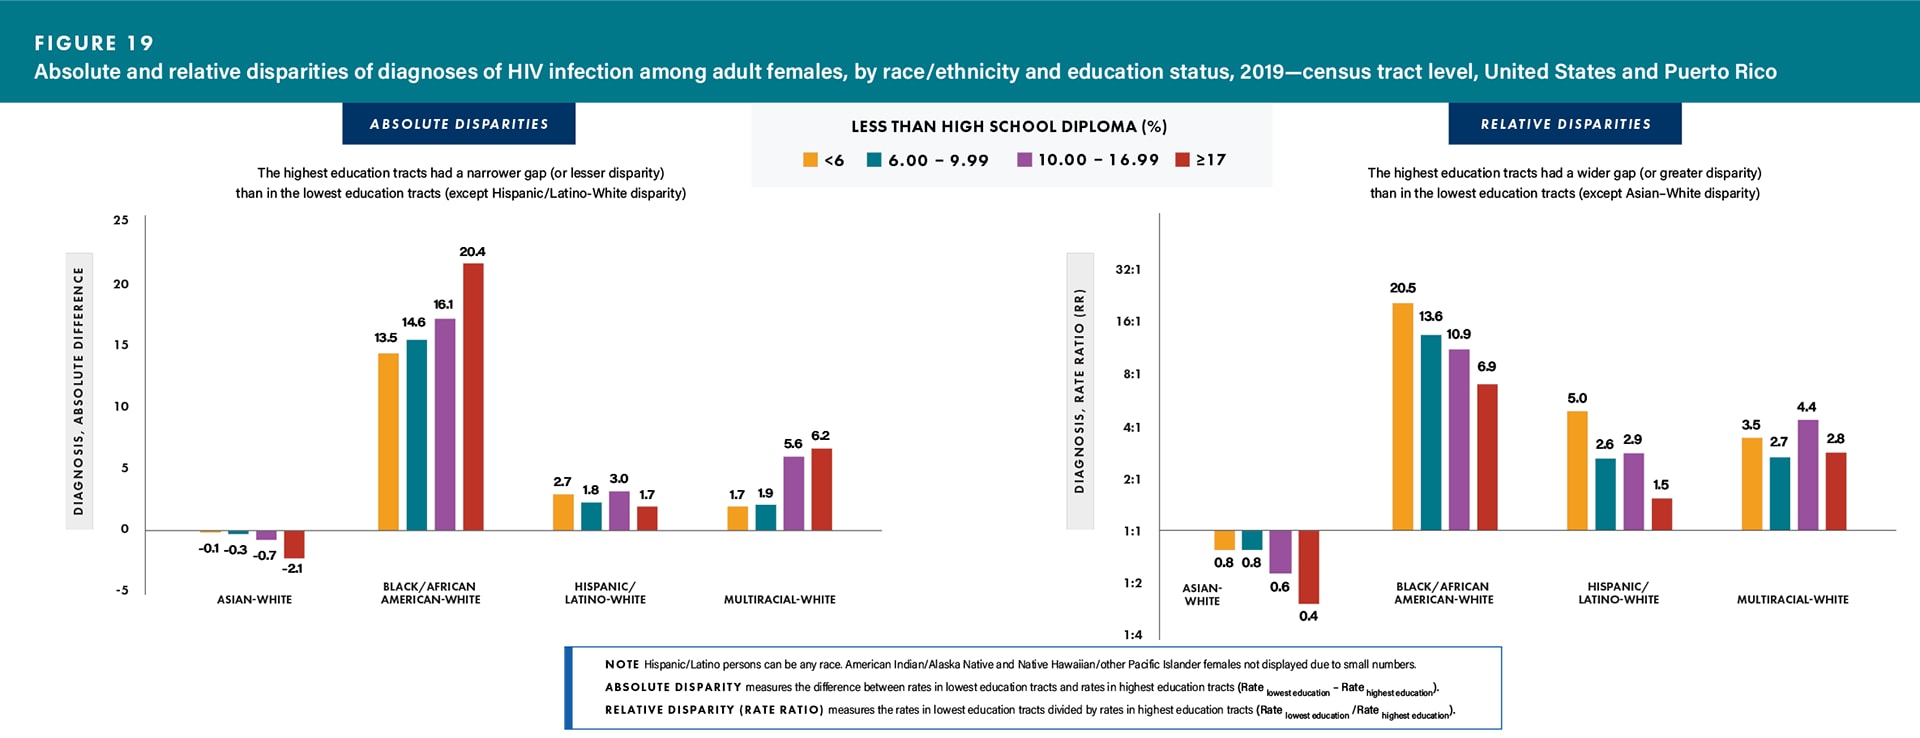
Lowest education: Among females residing in tracts with the lowest education, the relative disparities (rate ratios) of HIV diagnosis rates were as follows: Black/African American 6.9 times, Hispanic/Latino 1.5 times, and multiracial females 2.8 times as high as the rate for White females; the rate for White females was 2.6 times as high as the rate for Asian females (Figure 19 and Table 2).
Highest education: Among females residing in tracts with the highest education, the relative disparities (rate ratios) of HIV diagnosis rates were as follows: Black/African American 20.5 times, Hispanic/Latino 5.0 times, and multiracial females 3.5 times as high as the rate for White females; the rate for White females was 1.2 times as high as the rate for Asian females (Figure 19 and Table 2).
Changes in disparities:
- For absolute disparities, the highest education tracts had a narrower gap (or lesser disparity) than in the lowest education tracts (except Hispanic/Latino–White disparity)
- For relative disparities, the highest education tracts had a wider gap (or greater disparity) than in the lowest education tracts (except Asian–White disparity) (Figure 19).
Disparities—Income, by Sex at Birth and Race/Ethnicity
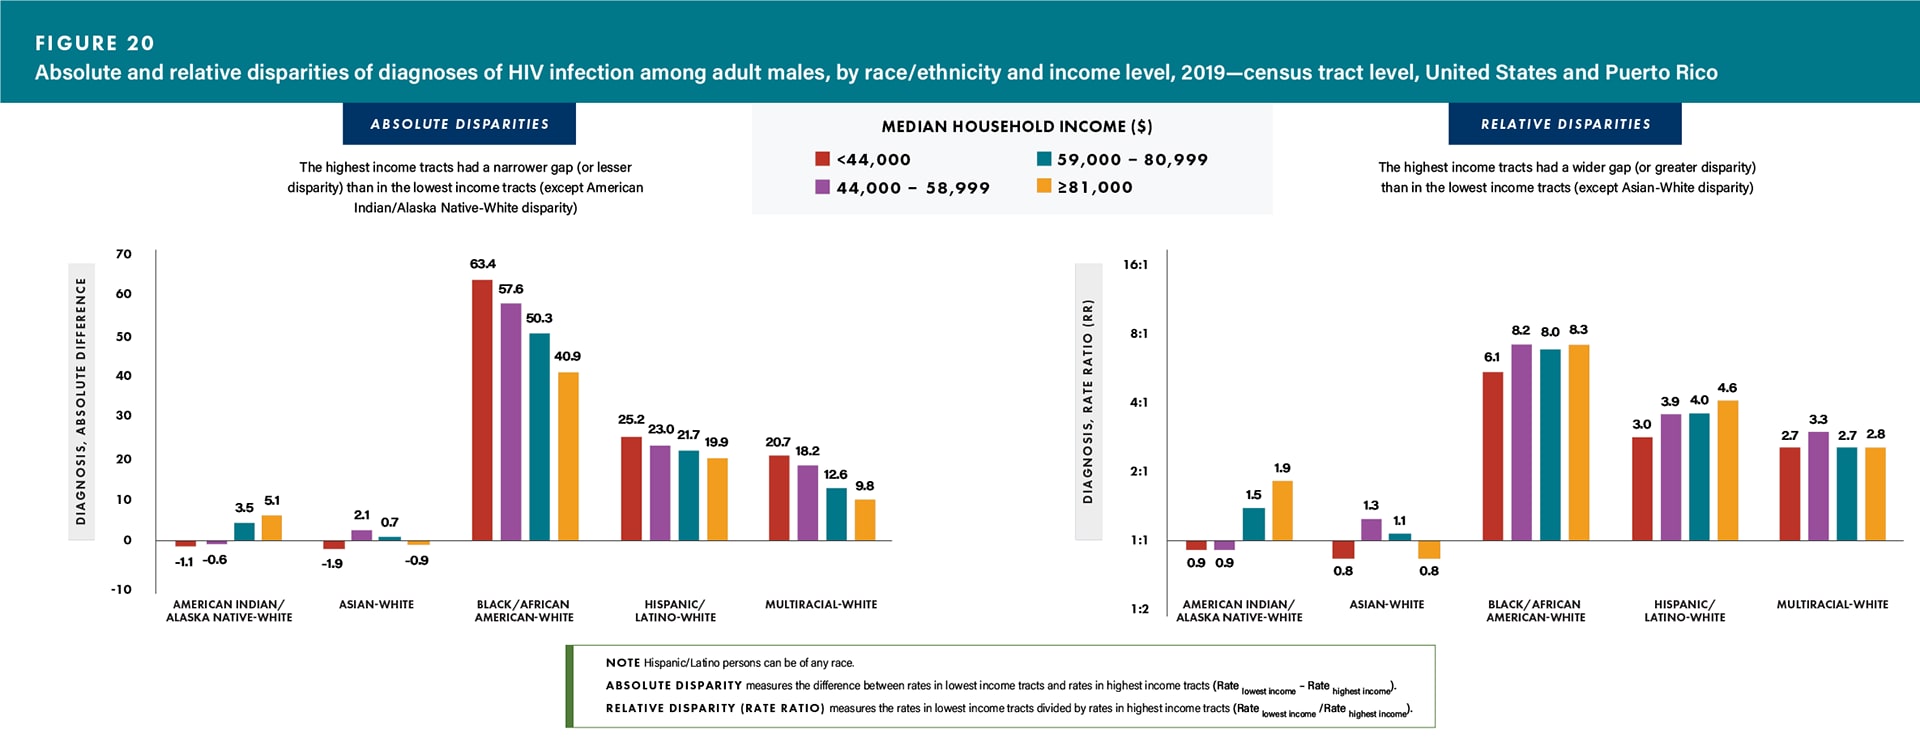
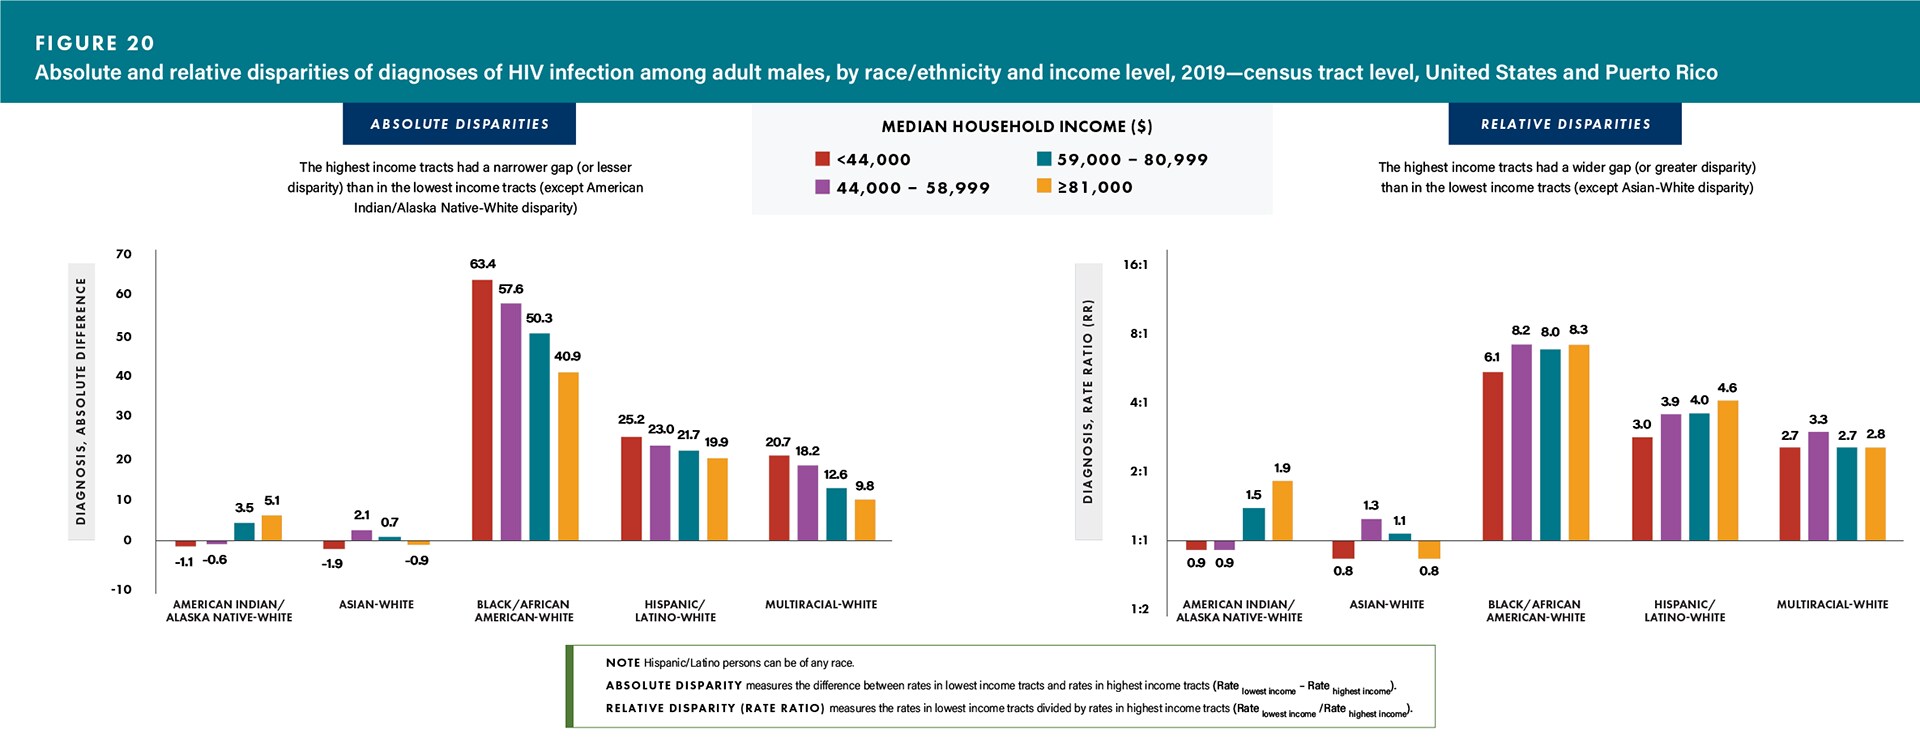
Lowest income: Among males residing in tracts with the lowest income, the relative disparities (rate ratios) of HIV diagnosis rates were as follows: Black/African American 6.1 times, Hispanic/Latino 3.0 times, and multiracial males 2.7 times as high as the rate for White males; the rate for White males was 1.2 times as high as the rate for Asian males (Figure 20 and Table 2).
Highest income: Among males residing in tracts with the highest income, the relative disparities (rate ratios) of HIV diagnosis rates were as follows: Black/African American 8.3 times, Hispanic/Latino 4.6 times, and multiracial males 2.8 times as high as the rate for White males; the rate for White males was 1.2 times as high as the rate for Asian males (Figure 20 and Table 2).
Changes in disparities:
- For absolute disparities, the highest income tracts had a narrower gap (or lesser disparity) than in the lowest income tracts (except American Indian/Alaska Native–White disparity)
- For relative disparities, the highest income tracts had a wider gap (or greater disparity) than in the lowest income tracts (except Asian–White disparity) (Figure 20).
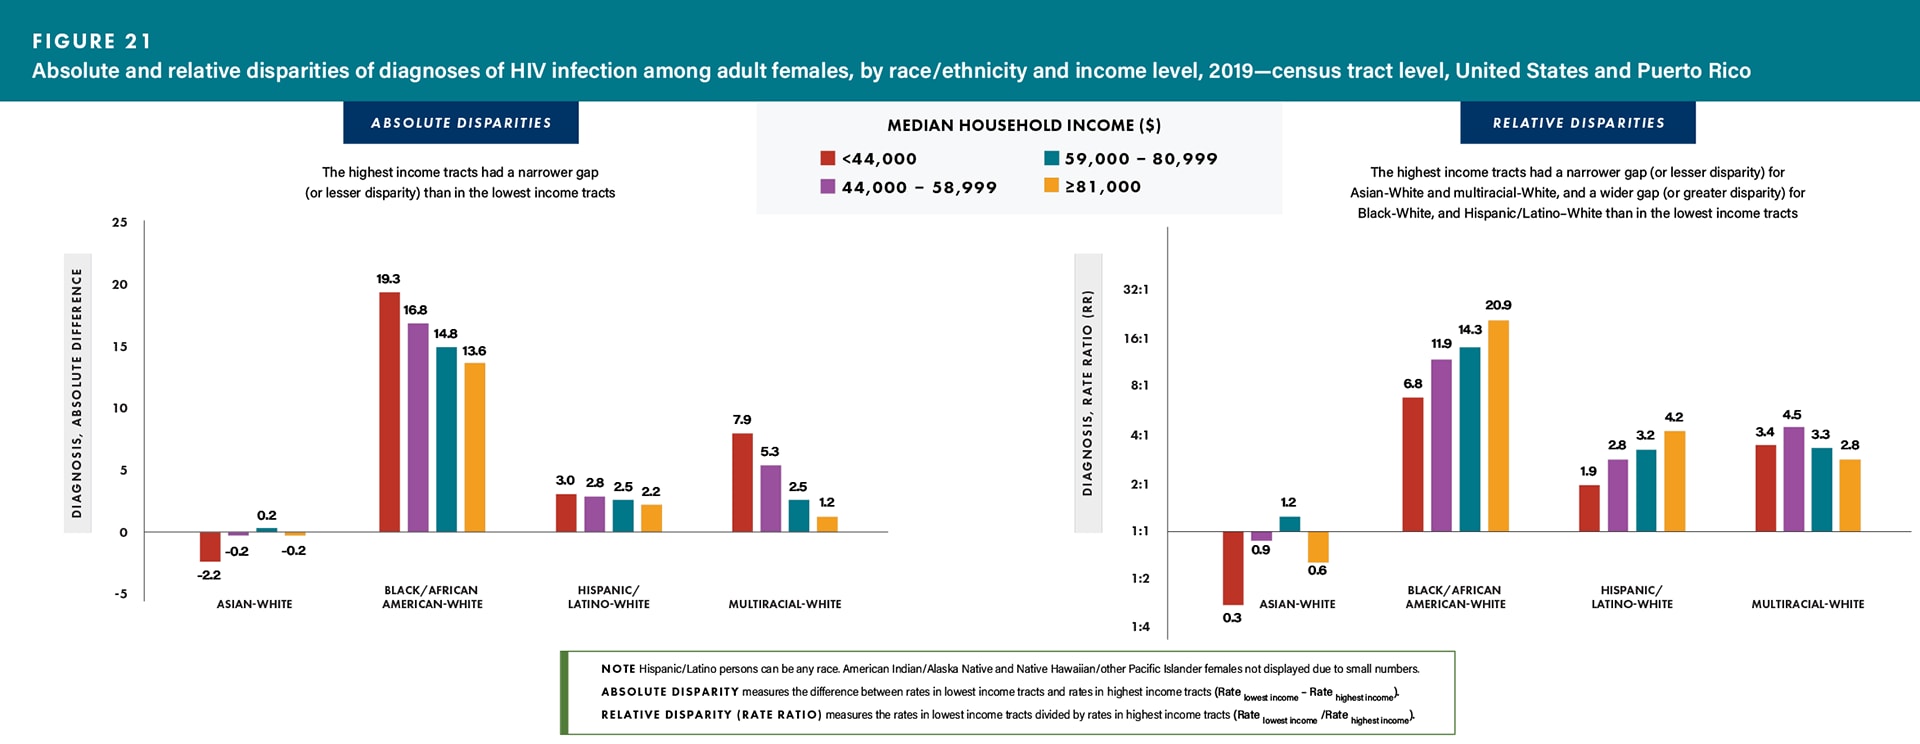
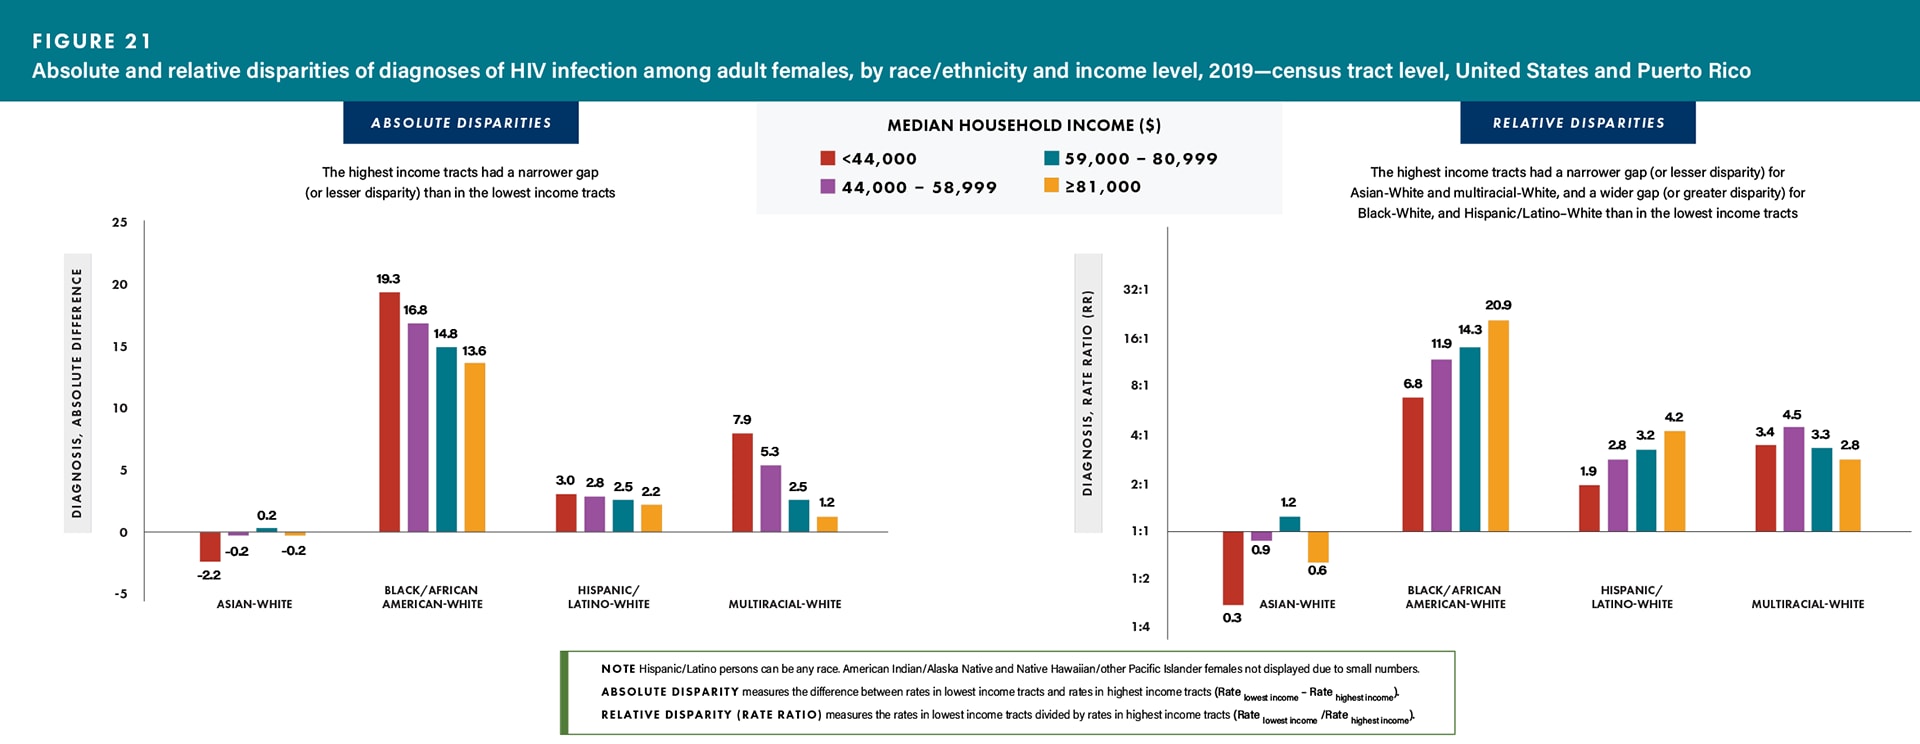
Lowest income: Among females residing in tracts with the lowest income, the relative disparities (rate ratios) of HIV diagnosis rates were as follows: Black/African American 6.8 times, Hispanic/Latino 1.9 times, and multiracial females 3.4 times as high as the rate for White females; the rate for White females was 2.9 times as high as the rate for Asian females (Figure 21 and Table 2).
Highest income: Among females residing in tracts with the highest income, the relative disparities (rate ratios) of HIV diagnosis rates were as follows: Black/African American 20.9 times, Hispanic/Latino 4.2 times, and multiracial females 2.8 times as high as the rate for White females; the rate for White females was 1.6 times as high as the rate for Asian females (Figure 21 and Table 2).
Changes in disparities:
- For absolute disparities, the highest income tracts had a narrower gap (or lesser disparity) than in the lowest income tracts
- For relative disparities, the highest income tracts had a narrower gap (or lesser disparity) for Asian–White and multiracial–White, and a wider gap (or greater disparity) for Black–White and Hispanic/Latino–White than in the lowest income tracts (Figure 21).
Disparities—Health Insurance Coverage, by Sex at Birth and Race/Ethnicity
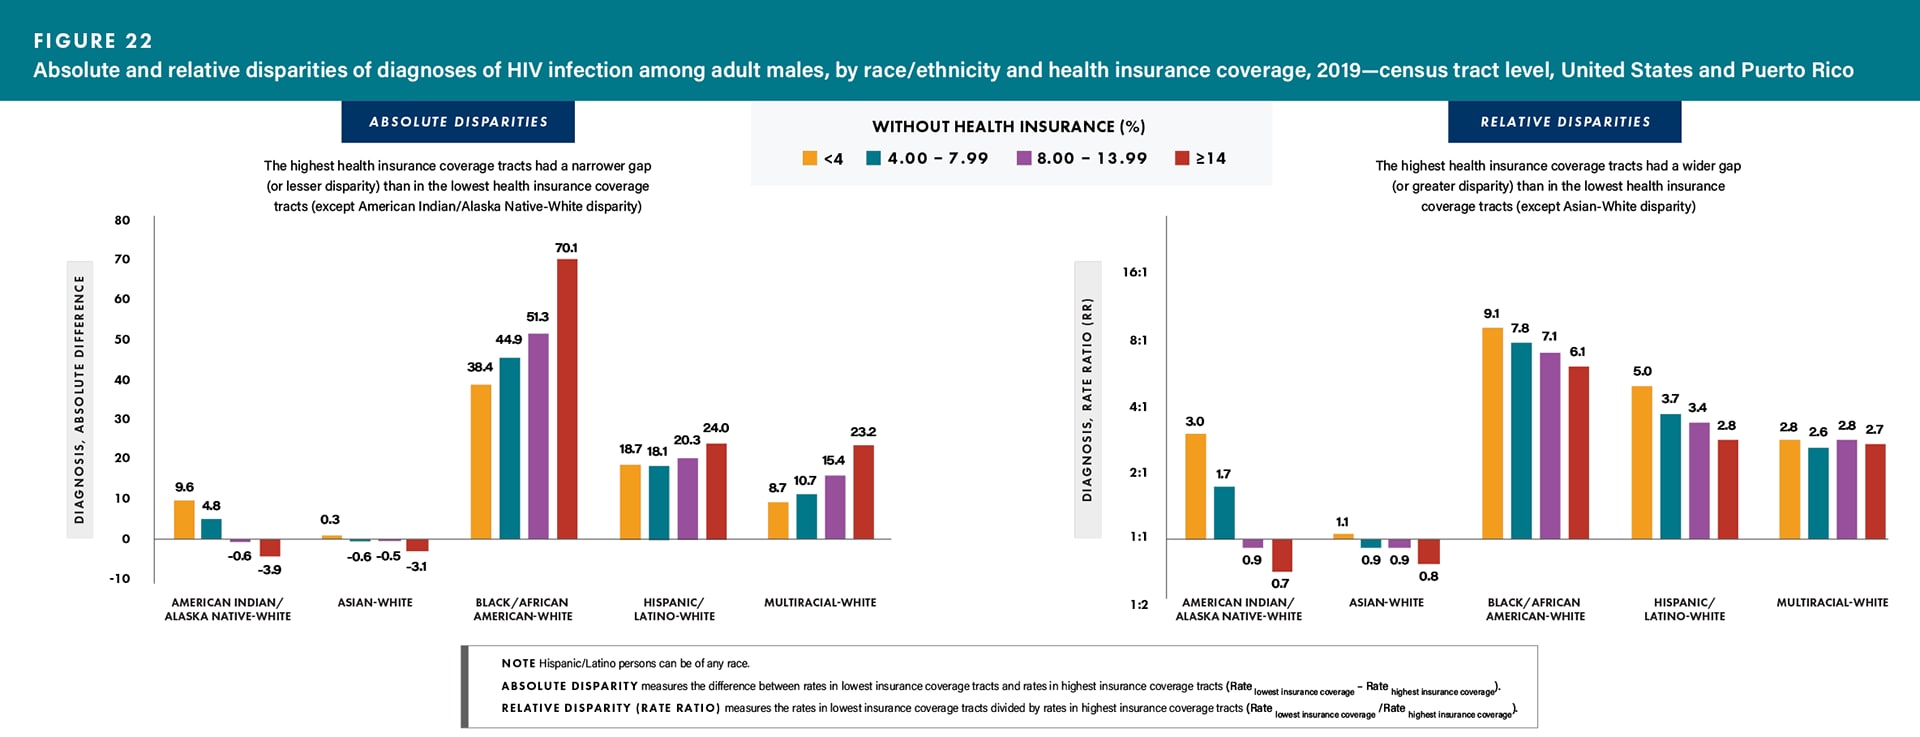
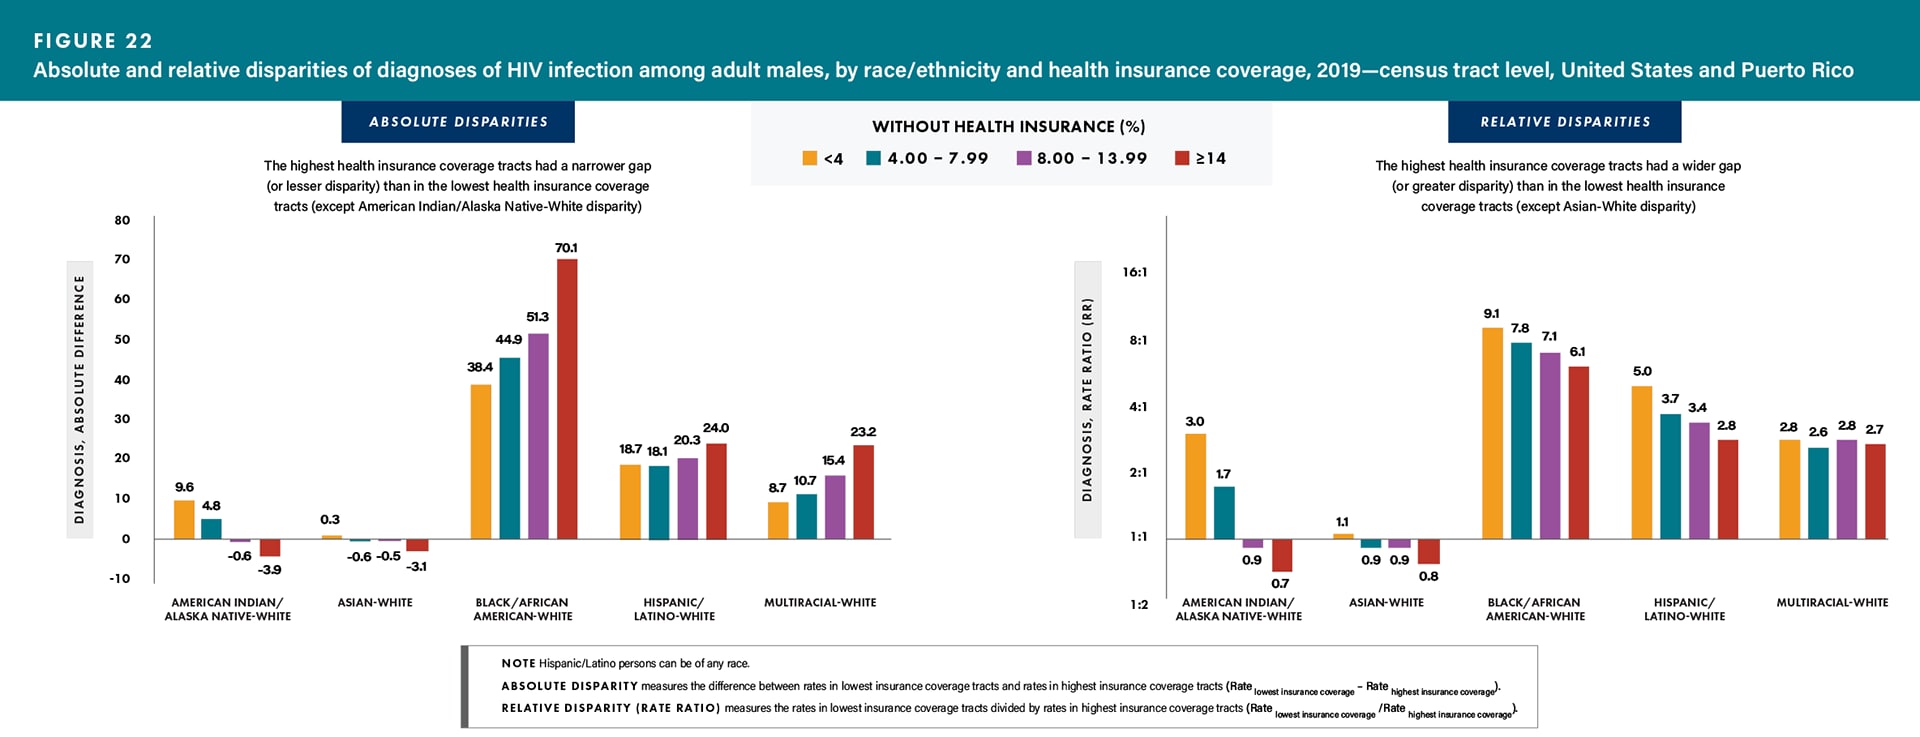
Lowest health insurance coverage: Among males residing in tracts with the lowest health insurance coverage, the relative disparities (rate ratios) of HIV diagnosis rates were as follows: Black/African American 6.1 times, Hispanic/Latino 2.8 times, and multiracial males 2.7 times as high as the rate for White males; the rate for White males was 1.3 times as high as the rate for Asian males (Figure 22 and Table 2).
Highest health insurance coverage: Among males residing in tracts with the highest health insurance coverage, the relative disparities (rate ratios) of HIV diagnosis rates were as follows: Asian 1.1 times, Black/African American 9.1 times, Hispanic/Latino 5.0 times, and multiracial males 2.8 times as high as the rate for White males (Figure 22 and Table 2).
Changes in disparities:
- For absolute disparities, the highest health insurance coverage tracts had a narrower gap (or lesser disparity) than in the lowest health insurance coverage tracts (except American Indian/Alaska Native–White disparity)
- For relative disparities, the highest health insurance coverage tracts had a wider gap (or greater disparity) than in the lowest health insurance coverage tracts (except Asian–White disparity) (Figure 22).
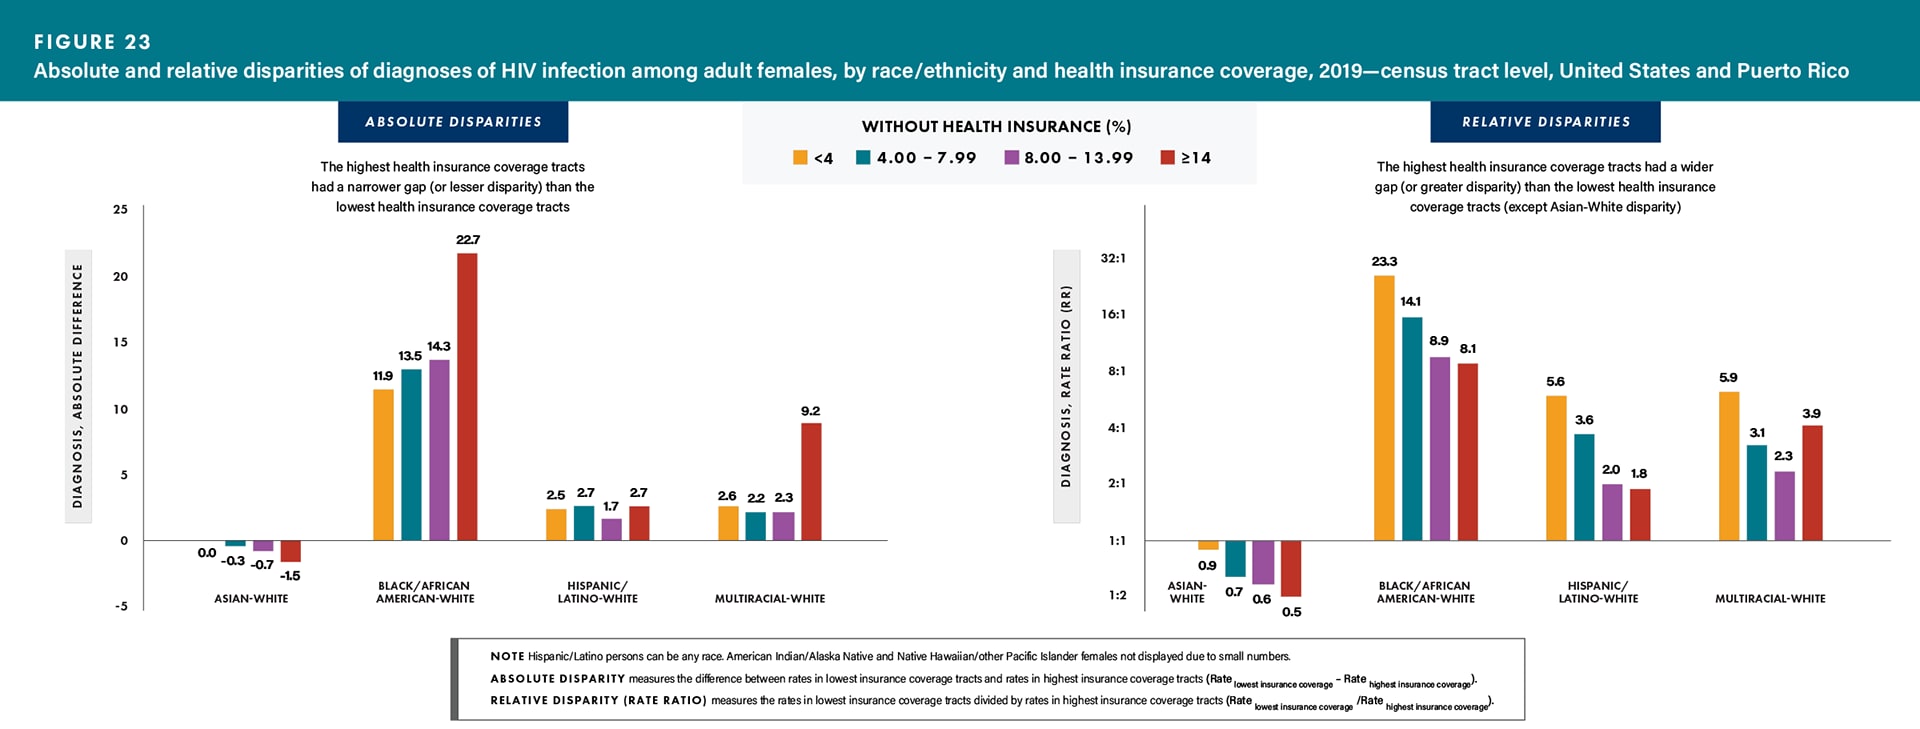
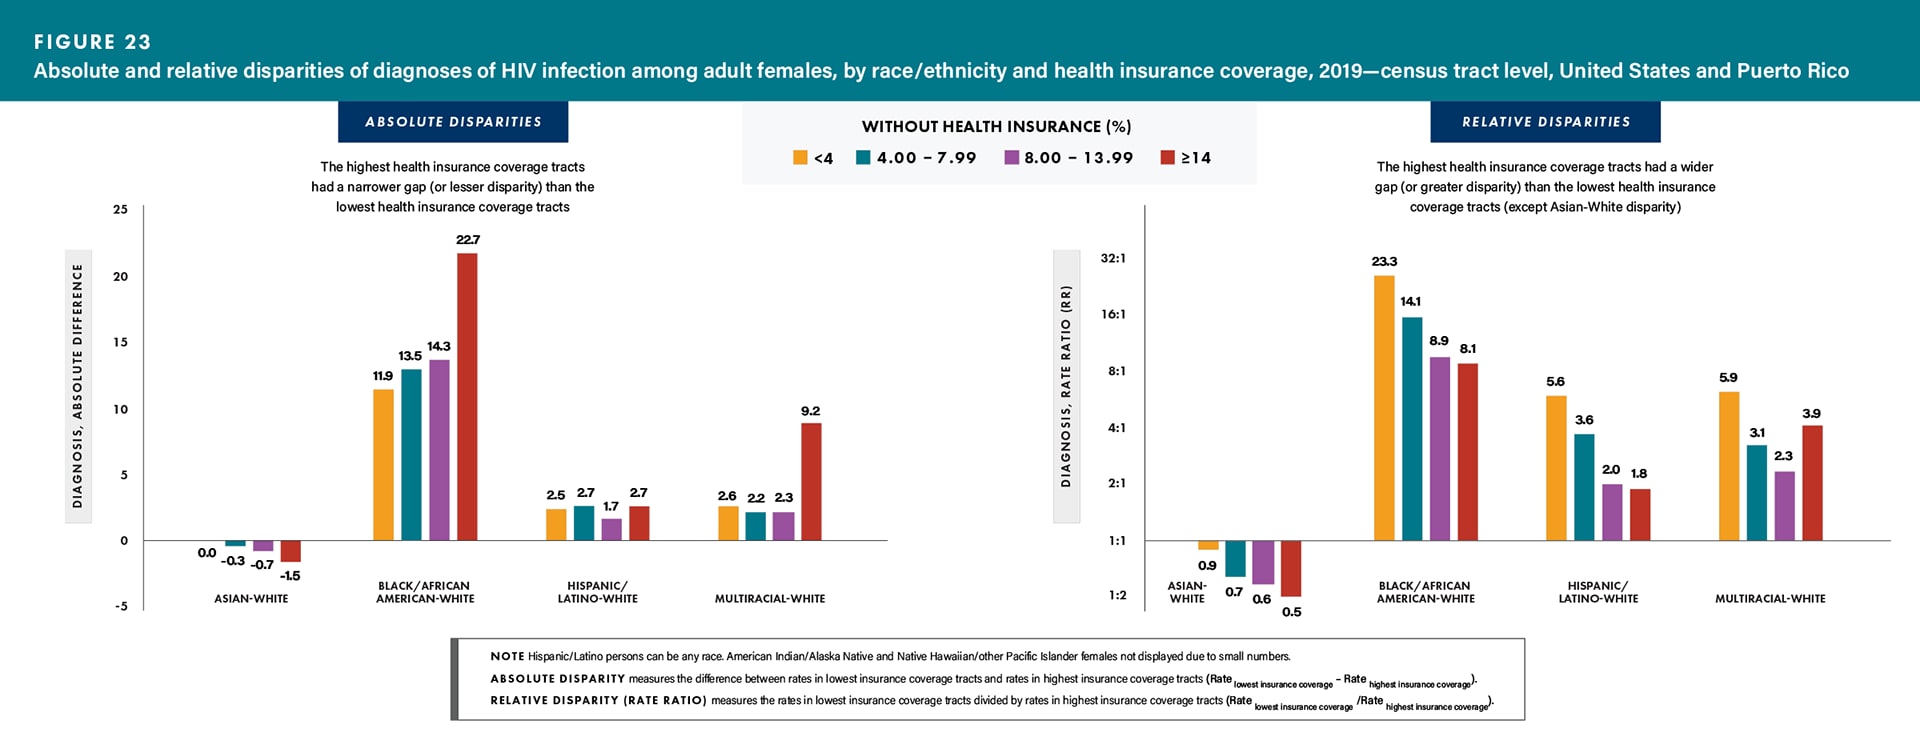
Lowest health insurance coverage: Among females residing in tracts with the lowest health insurance coverage, the relative disparities (rate ratios) of HIV diagnosis rates were as follows: Black/African American 8.1 times, Hispanics/Latinos 1.8 times, and multiracial females 3.9 times as high as the rate for White females; the rate for White females was 1.9 times as high as the rate for Asian females (Figure 23 and Table 2).
Highest health insurance coverage: Among females residing in tracts with the highest health insurance coverage, the relative disparities (rate ratios) of HIV diagnosis rates were as follows: Black/African American 23.3 times, Hispanics/Latinos 5.6 times, and multiracial females 5.9 times as high as the rate for White females; the rate for White females was 1.1 times as high as the rate for Asian females (Figure 23 and Table 2).
Changes in disparities:
- For absolute disparities, the highest health insurance coverage tracts had a narrower gap (or lesser disparity) than in the lowest health insurance coverage tracts
- For relative disparities, the highest health insurance coverage tracts had a wider gap (or greater disparity) than in the lowest health insurance coverage tracts (except Asian–White disparity) (Figure 23).
Disparities—Income Inequality, by Sex at Birth and Race/Ethnicity
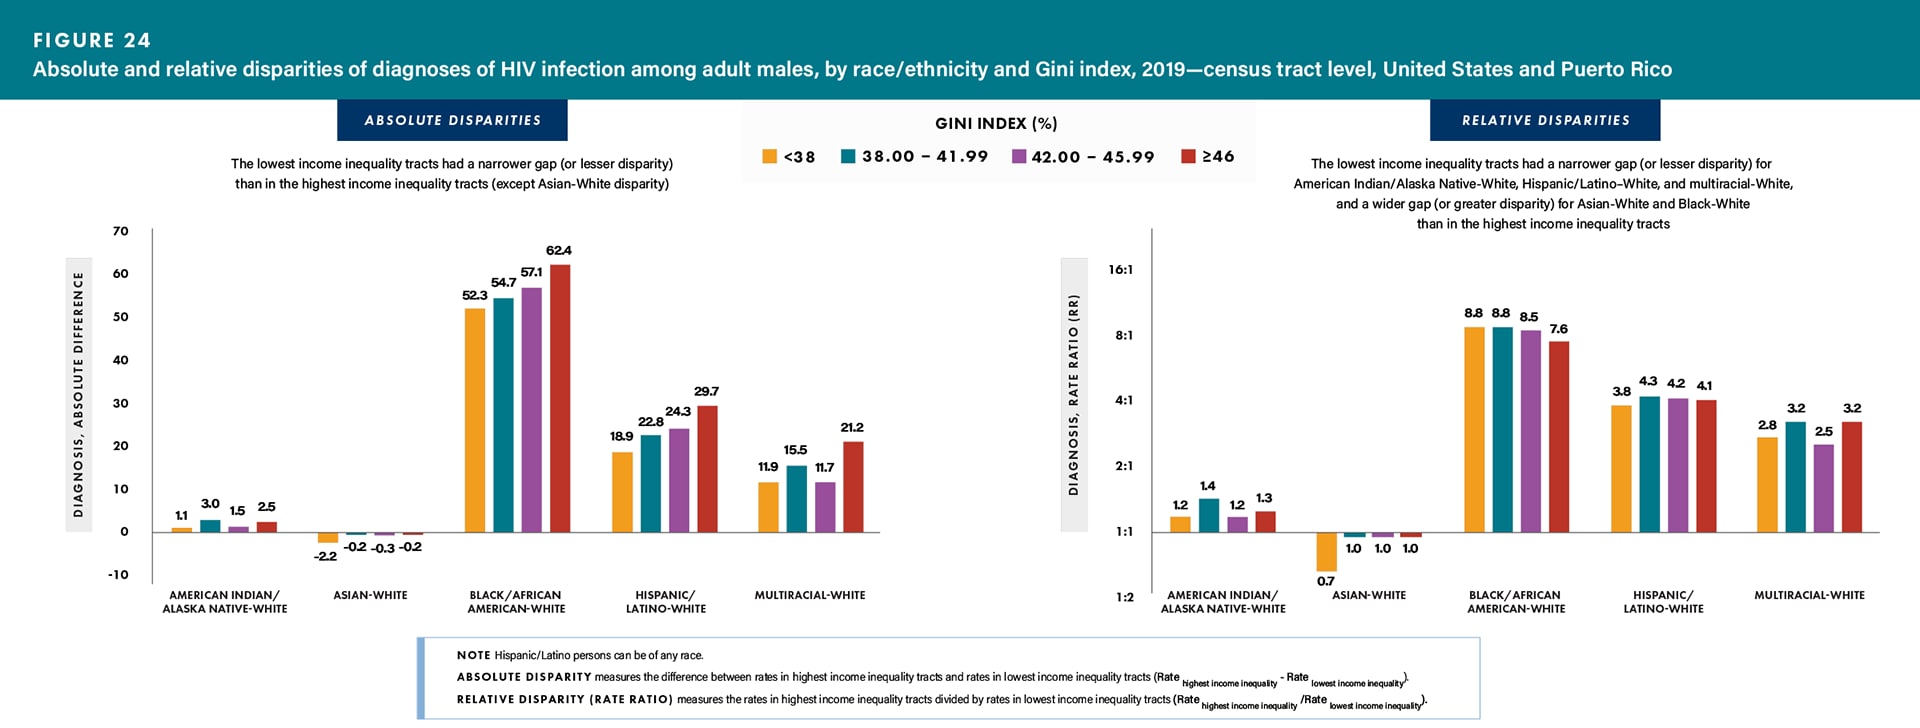
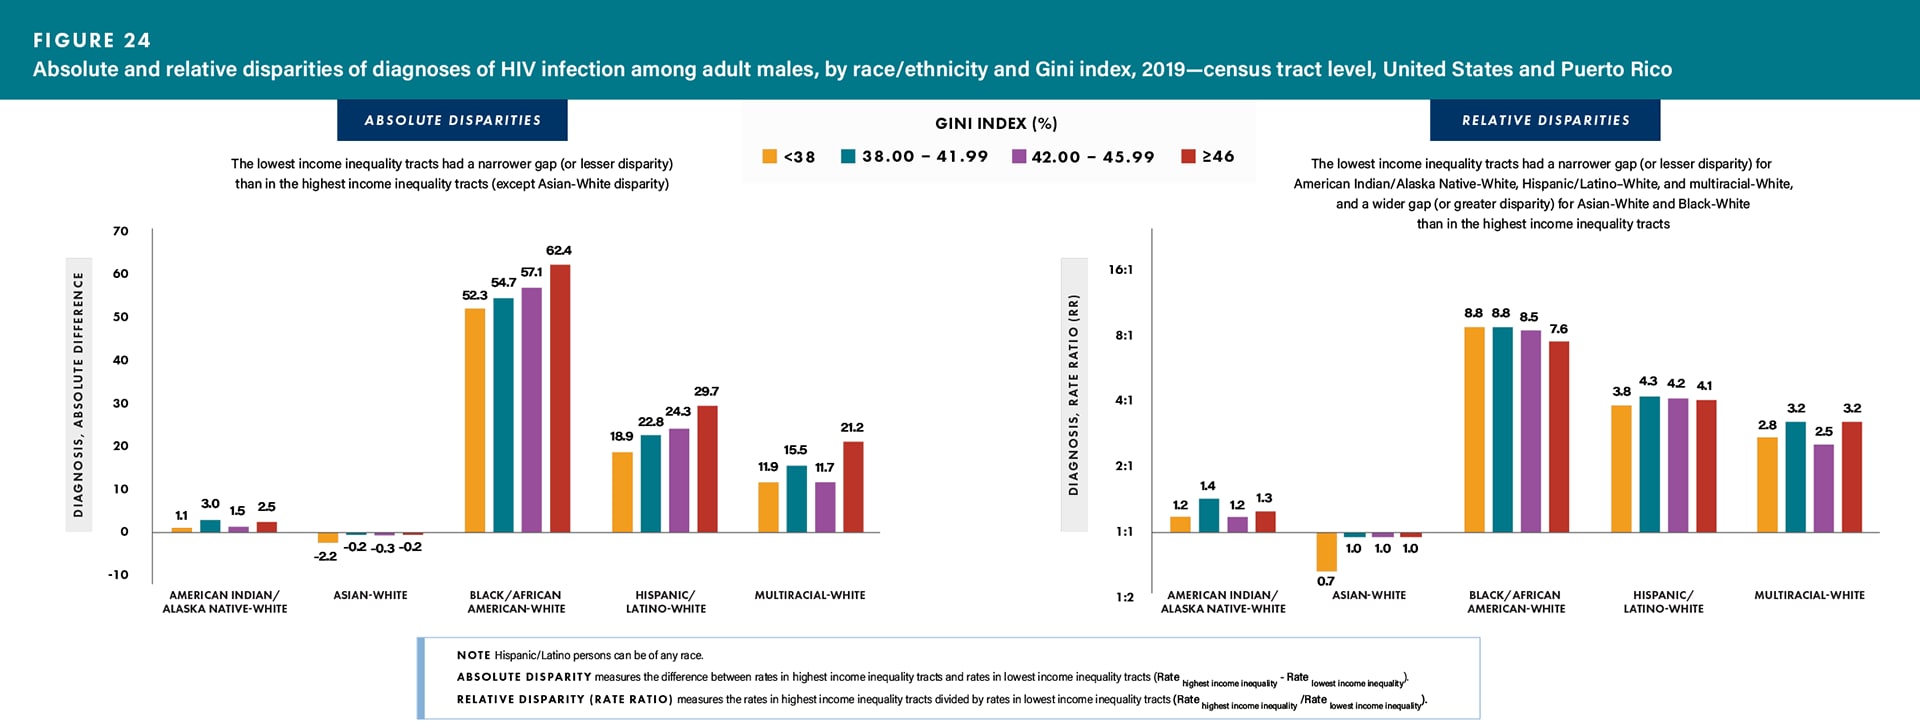
Highest income inequality: Among males residing in tracts with the highest income inequality, the relative disparities (rate ratios) of HIV diagnosis rates were as follows: Black/African American 7.6 times, Hispanic/Latino 4.1 times, and multiracial males 3.3 times as high as the rate for White males; the rate for White males was 1.0 times as high as the rate for Asian males (Figure 24 and Table 2).
Lowest income inequality: Among males residing in tracts with the lowest income inequality, the relative disparities (rate ratios) of HIV diagnosis rates were as follows: Black/African American 8.8 times, Hispanic/Latino 3.8 times, and multiracial males 2.8 times as high as the rate for White males; the rate for White males was 1.5 times as high as the rate for Asian males (Figure 24 and Table 2).
Changes in disparity:
- For absolute disparities, the lowest income inequality tracts had a narrower gap (or lesser disparity) than in the highest income inequality tracts (except Asian–White disparity)
- For relative disparities, the lowest income inequality tracts had a narrower gap (or lesser disparity) for American Indian/Alaska Native–White, Hispanic/Latino–White, and multiracial–White, and a wider gap (or greater disparity) for Asian–White and Black–White than in the highest income inequality tracts (Figure 24).
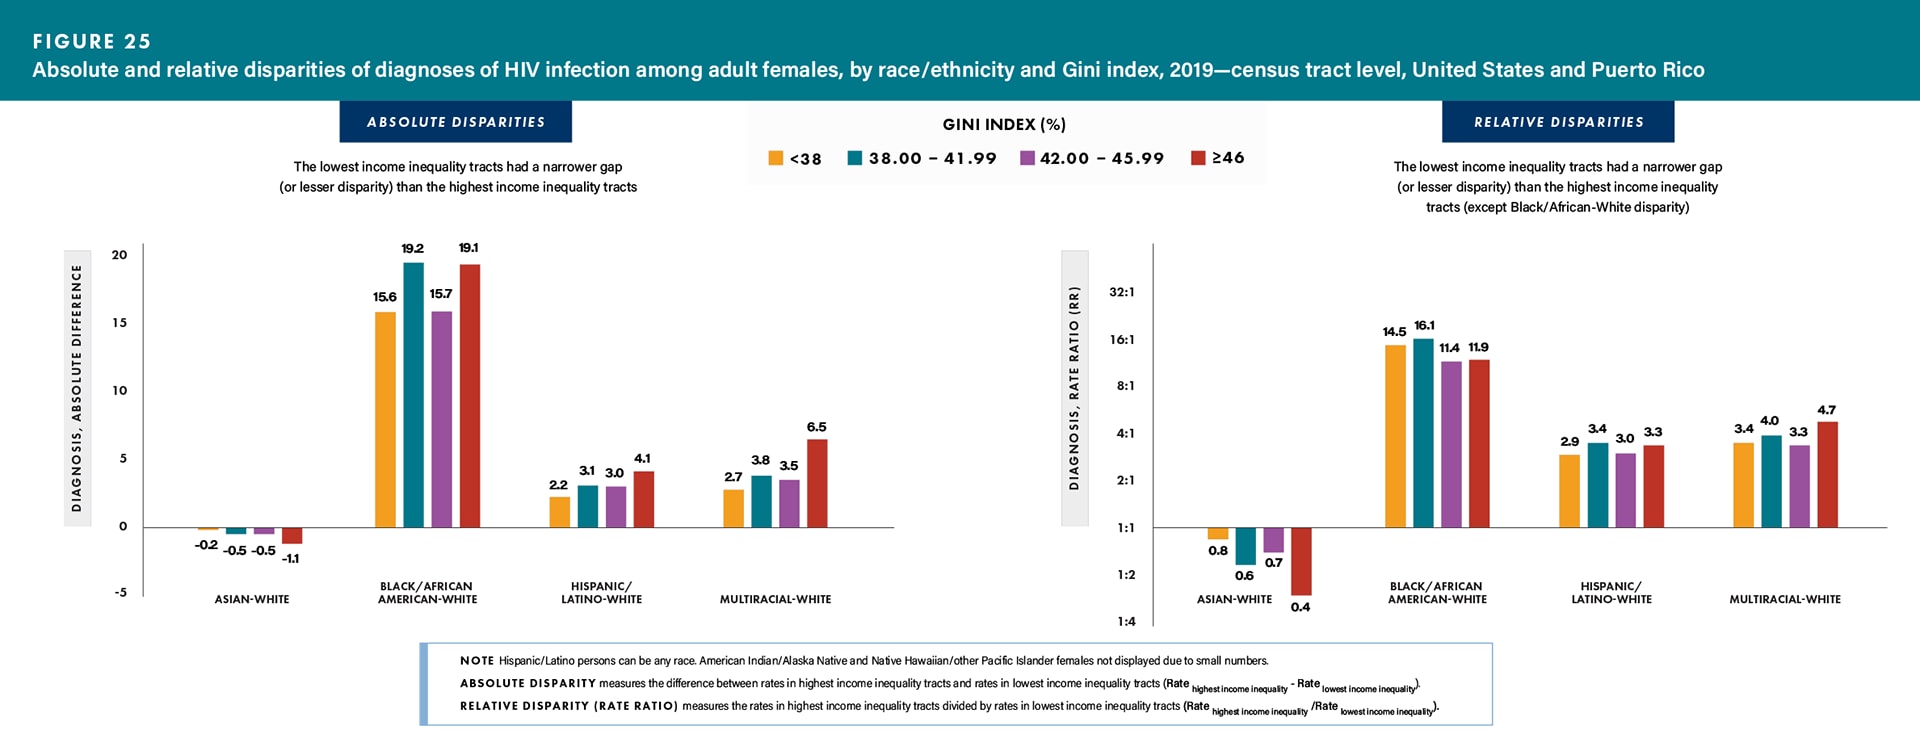
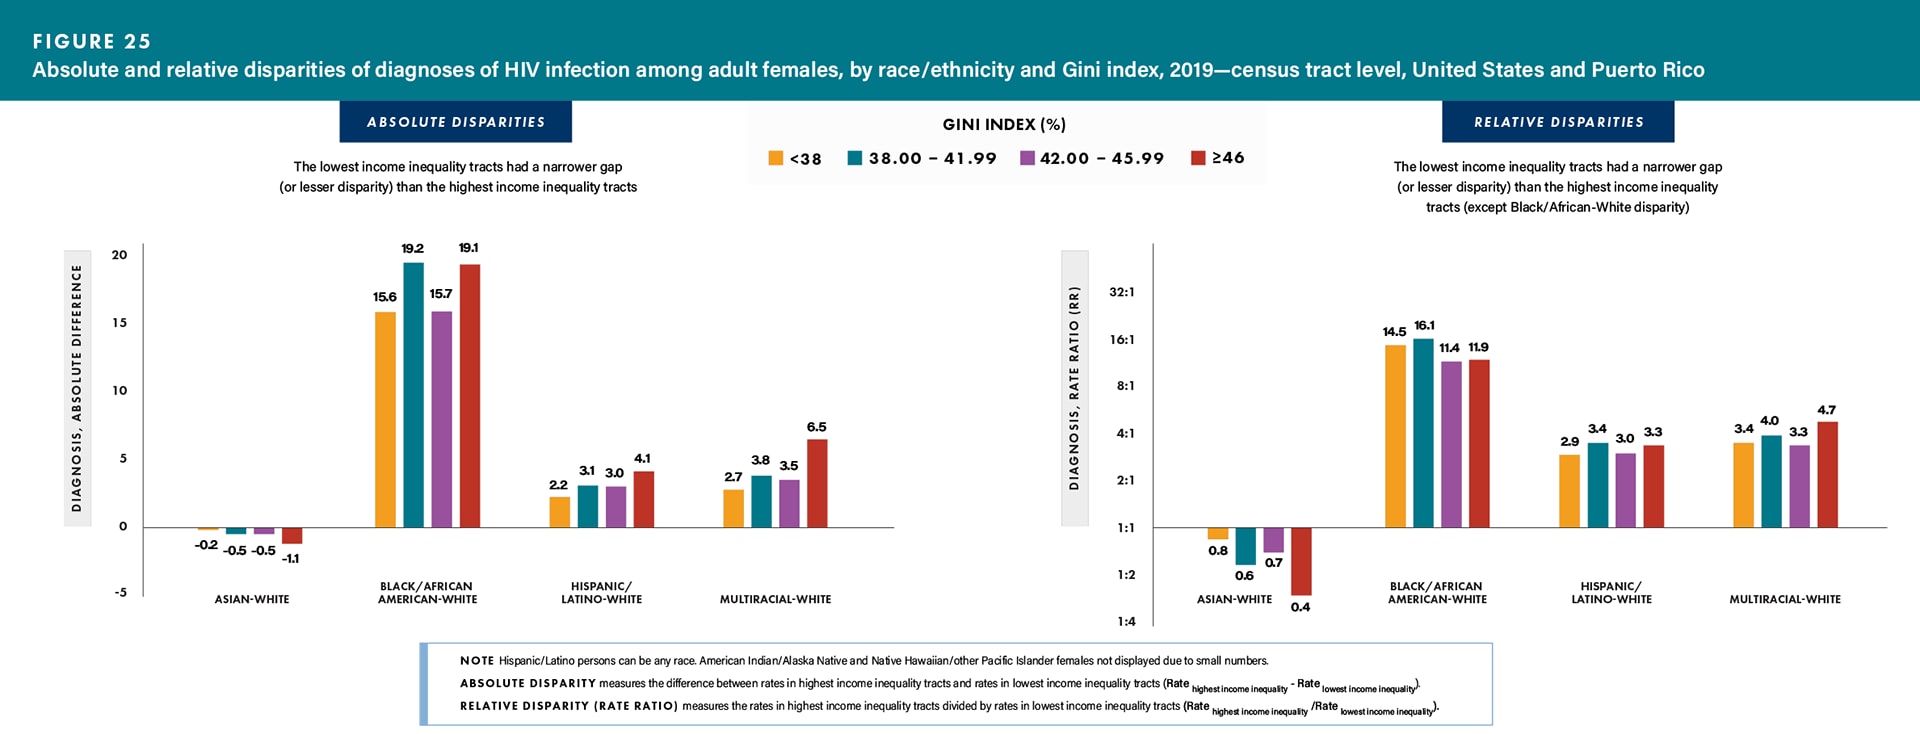
Highest income inequality: Among females residing in tracts with the highest income inequality, the relative disparities (rate ratios) of HIV diagnosis rates were as follows: Black/African American 11.9 times, Hispanic/Latino 3.3 times, and multiracial females 4.7 times as high as the rate for White females; the rate for White females was 2.7 times as high as the rate for Asian females (Figure 25 and Table 2).
Lowest income inequality: Among females residing in tracts with the lowest income inequality, the relative disparities (rate ratios) of HIV diagnosis rates were as follows: Black/African American 14.5 times, Hispanic/Latino 2.9 times, and multiracial females 3.4 times as high as the rate for White females; the rate for White females was 1.2 times as high as the rate for Asian females (Figure 25 and Table 2).
Changes in disparity:
- For absolute disparities, the lowest income inequality tracts had a narrower gap (or lesser disparity) than in the highest income inequality tracts
- For relative disparities, the lowest income inequality tracts had a narrower gap (or lesser disparity) than in the highest income inequality tracts (except Black/African American–White disparity) (Figure 25).
Health Disparities Special Considerations
Accurate and timely assessment and monitoring of the magnitude and direction of change of health disparities and their determinants are necessary for evaluation of progress toward the Healthy People 2030 goals of eliminating health disparities, achieving health equity, and attaining health literacy to improve the health and well-being of all [21]. Overall, health disparities are not improving in the United States [22]. While both downstream and upstream interventions are important, evidence from systematic reviews suggests that downstream prevention interventions (directed at individual-level factors) are more likely than upstream interventions (directed at social- or policy-level factors) to increase health disparities [23].
Below are some important upstream factors, which can lead to downstream and upstream interventions, for special consideration when addressing and reducing health disparities related to poverty, education, income, and health care status among adults with diagnosed HIV infection.
Residential Segregation
The persistence of racial differences in health, after individual differences in socioeconomic status (SES) are accounted for, may reflect the role that residential segregation and neighborhood quality can play in racial disparities in health. As a result of segregation, higher-income Black/African American persons live in lower-income areas than White persons of similar economic status, and lower-income White persons live in higher-income areas than Black/African American persons of similar economic status [23]. Other racial/ethnic groups experience less residential segregation than Black/African American persons, and although residential segregation is inversely related to income for Hispanic/Latino and Asian persons, the segregation of Black/African American persons is high at all levels of income [23]. Black/African American persons with the highest levels of income experience more residential segregation than Hispanic/Latino and Asian persons with the lowest levels of income [23]. In addition to other SDH variables, residential segregation may play a role in racial disparities in HIV diagnoses by isolating individuals from access to important resources and affecting neighborhood quality, with lower income and isolated areas being more vulnerable [24].
Medical Treatment
Hispanic/Latino persons account for the largest uninsured group in the United States [25], and one-quarter of Hispanic/Latino adults do not have a primary care provider [26]. Additionally, Black/African American persons typically have the lowest linkage of HIV medical care [27]. Black/African American and Hispanic/Latino persons are less likely than White persons to receive high-quality medical treatment after they gain access to medical care. These patterns exist across a broad range of medical procedures and institutional contexts, and they are further compounded by factors like stigma, immigration status, and discrimination, all of which may contribute to disparities in HIV infections [28].
Psychosocial Stress
Exposure to psychosocial stressors (i.e., stress that may result from poverty, crime, racial discrimination, or other persistent difficulties) may explain the link between SES, race/ethnicity, and poor health outcomes. Chronic exposure to stress is associated with altered physiological functioning, which may increase risks for a broad range of health conditions. Individuals in lower income areas are more likely to report elevated levels of stress and may be more susceptible to the negative effects of stressors [28]. In addition, the subjective experience of discrimination is a neglected stressor that can adversely affect the health of some racial/ethnic populations. Discrimination may contribute to the elevated risk of disease that is sometimes observed among Black/African American persons [28]. Psychosocial stress may play a role in racial disparities in HIV diagnoses by altering physiological functions due to chronic exposure to stress among individuals living in lower income areas and experiencing discrimination [28].

