Behavioral and Clinical Characteristics of Persons Living with Diagnosed HIV Infection—Medical Monitoring Project, United States, 2019 Cycle: Figures

Figure 1. Participating Medical Monitoring Project Sites, Including 16 States and 6 Separately Funded Jurisdictions—United States, 2019
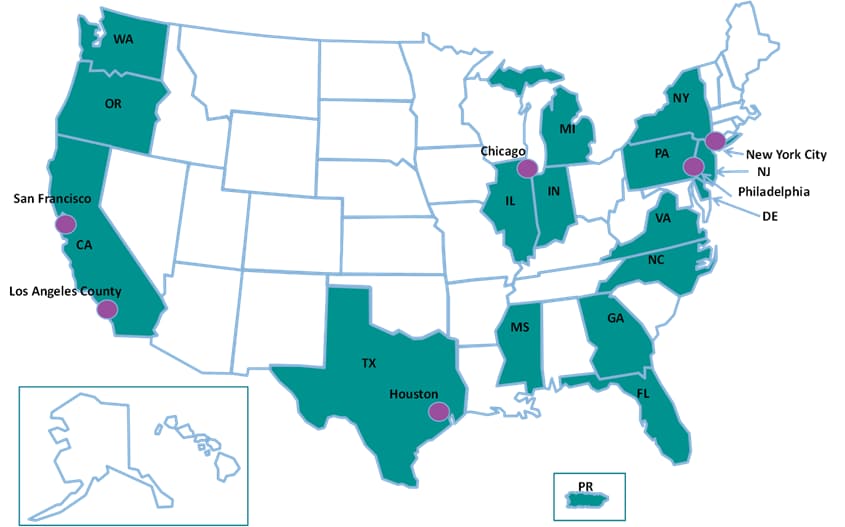
Figure 2a. Gender Distribution Among Adults with Diagnosed HIV—Medical Monitoring Project, United States, 2019
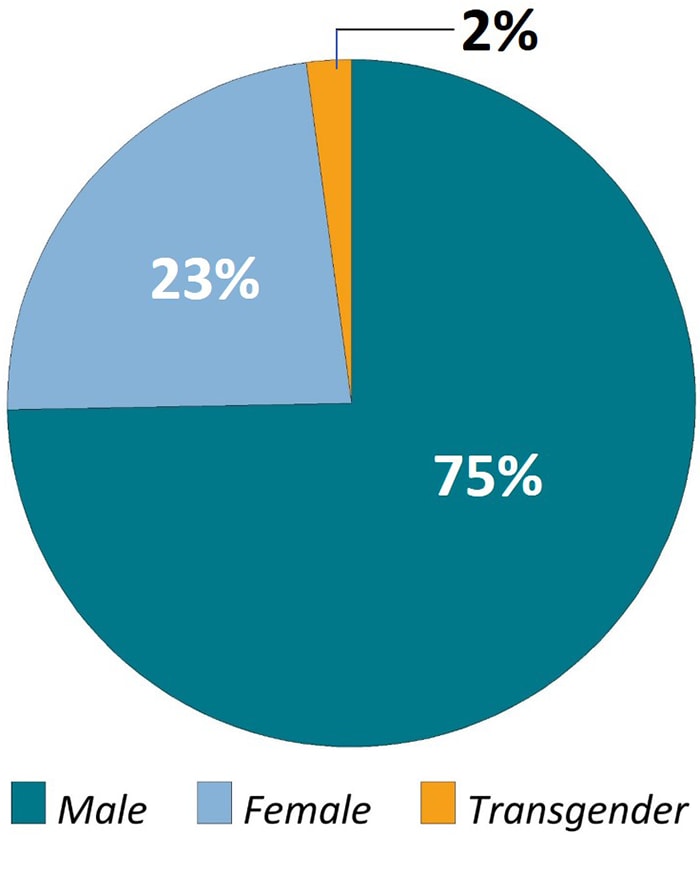
Note. Transgender persons defined as those who self-identified as transgender or who reported a gender identity different from sex assigned at birth.
Figure 2b. Age Distribution Among Adults with Diagnosed HIV—Medical Monitoring Project, United States, 2019
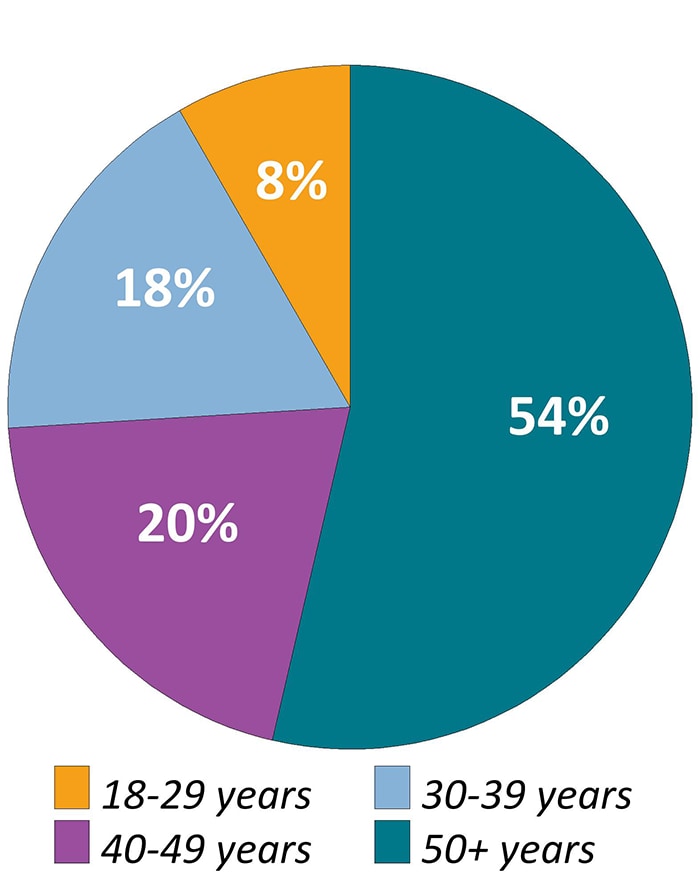
Figure 2c. Sexual Orientation Among Adults with Diagnosed HIV—Medical Monitoring Project, United States, 2019
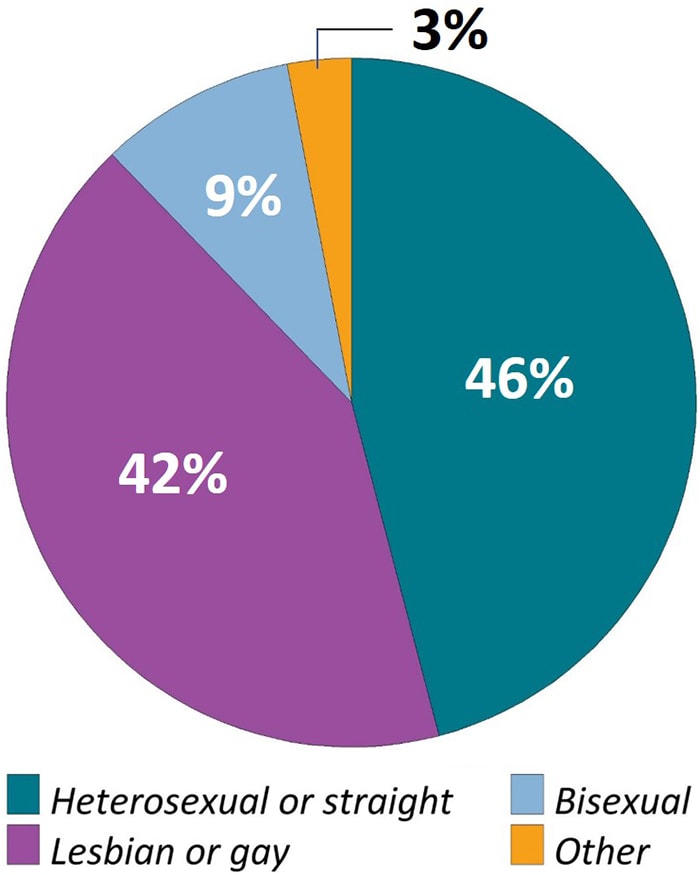
Figure 2d. Racial/Ethnic Distribution Among Adults with Diagnosed HIV—Medical Monitoring Project, United States, 2019
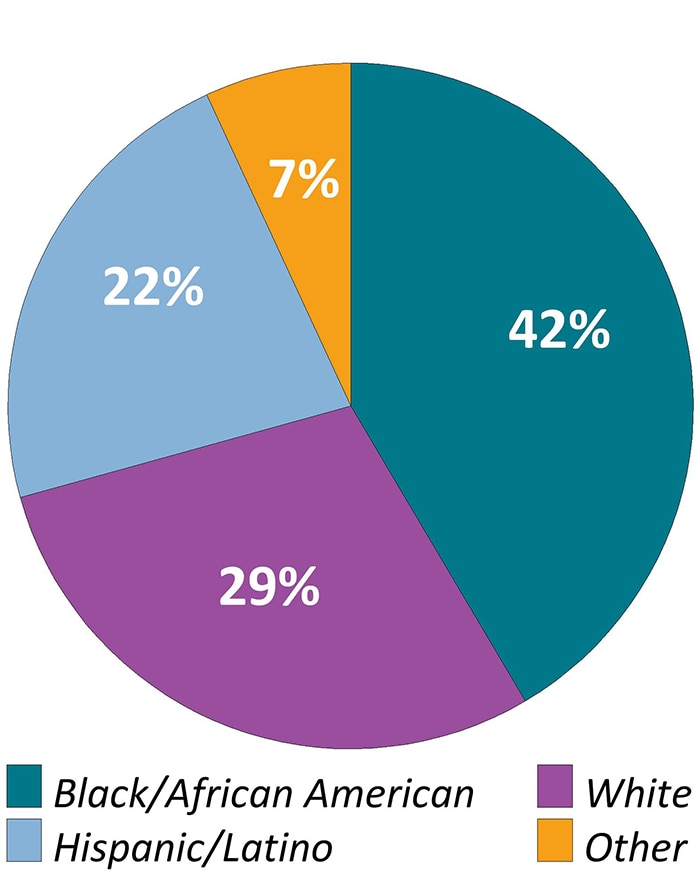
Note. “Other” race/ethnicity defined as persons who were American Indian/Alaska Native, Asian, Native Hawaiian/Other Pacific Islander, or multiracial. Hispanics or Latinos can be of any race.
Figure 3. Health Insurance or Coverage for Care or Medications During the 12 Months Before Interview Among Adults With Diagnosed HIV—Medical Monitoring Project, United States, 2019
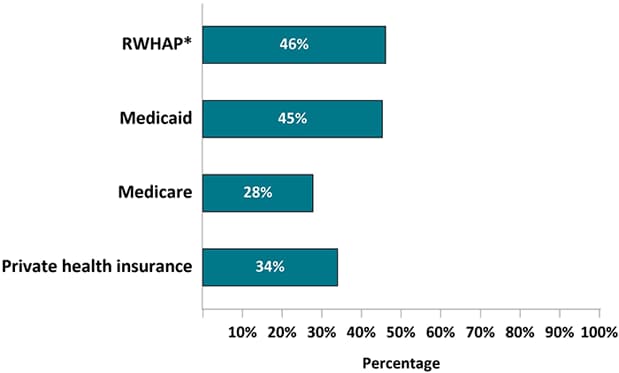
Note. Healthcare insurance/coverage types not mutually exclusive; people could report >1 type of coverage.
*RWHAP, Ryan White HIV/AIDS Program
Figure 4. Percentage of Adults with Diagnosed HIV Who Were Virally Suppressed During the 12 Months Before Interview—Medical Monitoring Project, United States, 2019
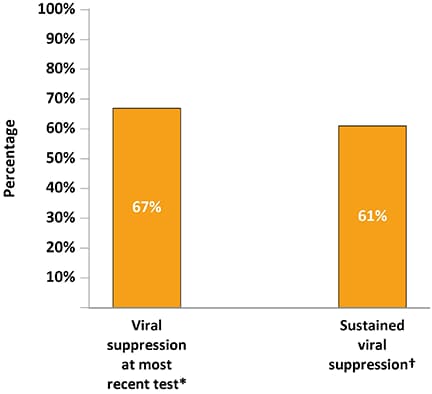
*Viral load <200 copies/mL or undetectable based on most recent test in the past 12 months.
†Sustained viral suppression defined as having all viral load tests in the past 12 months <200 copies/mL or undetectable.
Figure 5. Receipt of HIV Care and Antiretroviral Therapy Prescription During the 12 Months Before Interview Among Adults with Diagnosed HIV—Medical Monitoring Project, United States, 2019
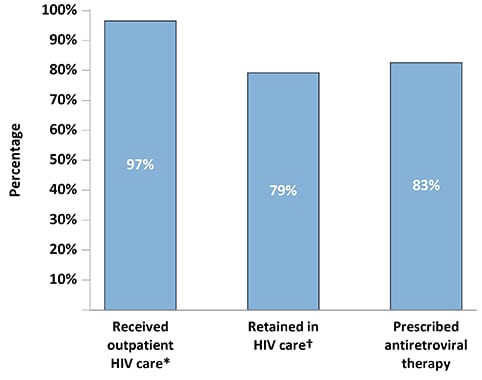
*Outpatient HIV care was defined as any documentation of the following: encounter with an HIV care provider, viral load test result, CD4 test result, HIV resistance test or tropism assay, ART prescription, PCP prophylaxis, or MAC prophylaxis.
†Two elements of outpatient HIV care at least 90 days apart in each 12-month period.
Figure 6. Percentage of Sexually Active Adults with Diagnosed HIV Who Tested for Gonorrhea, Chlamydia, or Syphilis During the 12 Months Before Interview—Medical Monitoring Project, United States, 2019
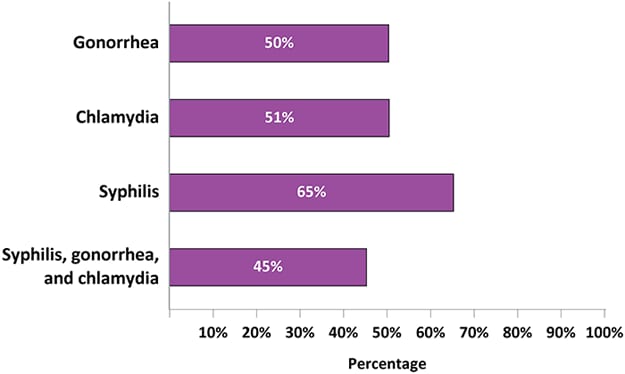
Figure 7. Percentage of Adults with Diagnosed HIV Who Had At Least One Visit to the Emergency Room Or At Least One Hospital Admission During the 12 Months Before interview—Medical Monitoring Project, United States, 2019
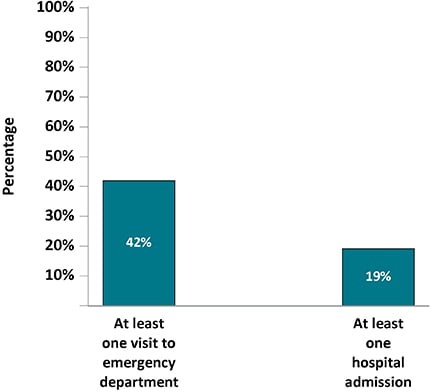
Figure 8. Reasons for Missing Last Antiretroviral Therapy Dose Among Adults with Diagnosed HIV Who Have Ever Missed a Dose—Medical Monitoring Project, United States, 2019*
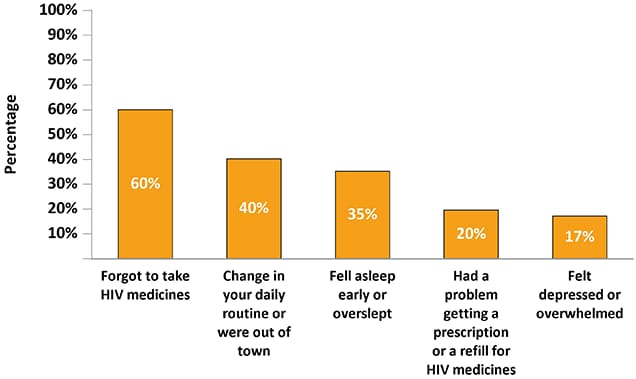
*Participants may report more than one reason for last missed dose.
Figure 9a. Percentage of Adults with Diagnosed HIV Who Experienced Symptoms of Major or Other Depression* During the Two Weeks Before Interview—Medical Monitoring Project, United States, 2019
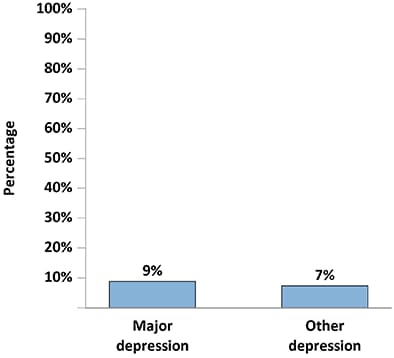
*Responses to the items on the PHQ-8 were used to define “major depression” and “other depression” according to criteria from the DSM-IV. “Major depression” was defined as having at least 5 symptoms of depression; “other depression” was defined as having 2–4 symptoms of depression. The PHQ-8 classification “other depression” comprises the DSM-IV categories of dysthymia and depressive disorder, not otherwise specified, which includes minor or subthreshold depression.
Figure 9b. Percentage of Adults with Diagnosed HIV Who Experienced Symptoms of Generalized Anxiety Disorder† During the Two Weeks Before Interview—Medical Monitoring Project, United States, 2019
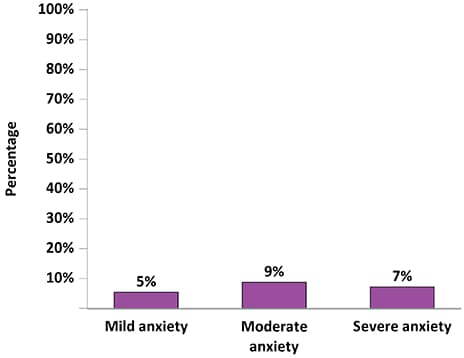
†Responses to the GAD-7 were used to define “mild anxiety,” “moderate anxiety,” and “severe anxiety,” according to criteria from the DSM-IV. “Severe anxiety” was defined as having a score of ≥ 15; “moderate anxiety” was defined as having a score of 10–14; and “mild anxiety” was defined as having a score of 5–9.
Figure 10a. Percentage of Adults with Diagnosed HIV Who Smoked Cigarettes During the 12 Months Before Interview—Medical Monitoring Project, United States, 2019
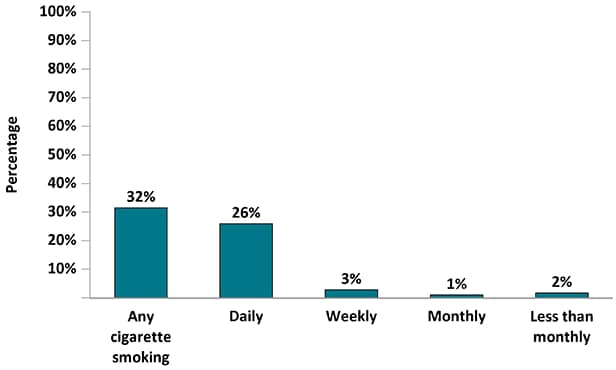
Figure 10b. Percentage of Adults with Diagnosed HIV Who Drank Alcohol During the 12 Months Before Interview—Medical Monitoring Project, United States, 2019
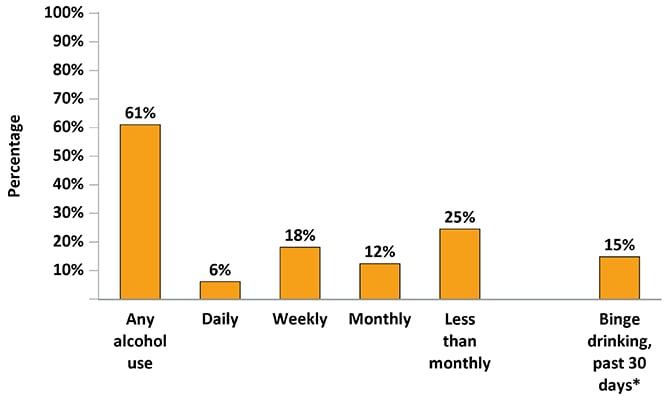
*5 or more alcoholic beverages in one sitting for men or 4 or more alcoholic beverages for women
Figure 11. Percentage of Female Adults with Diagnosed HIV Who Had a Papanicolaou Test During the Three Years Before interview Or Became Pregnant Since Receiving an HIV Diagnosis—Medical Monitoring Project, United States, 2019
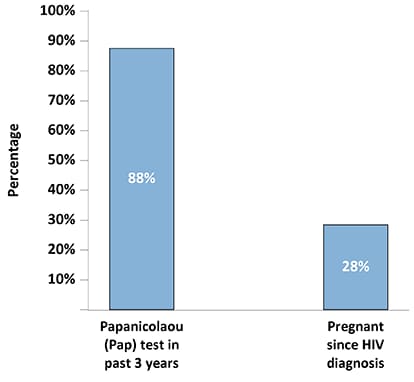
Figure 12. Percentage of Adults with Diagnosed HIV Who Engaged in High-Risk Sex* During the 12 Months Before Interview by Sexual Behavior/Orientation—Medical Monitoring Project, United States, 2019
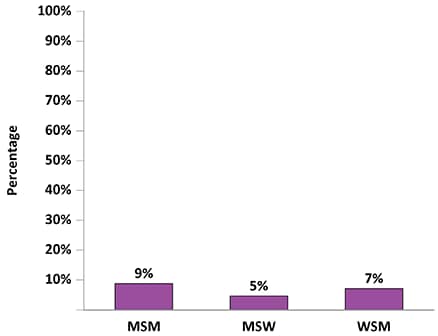
Note. MSM, men who have sex with men; MSW, men who have sex only with women; WSM, women who have sex with men.
*Vaginal or anal sex with at least 1 HIV-negative or unknown status partner while not having sustained viral suppression (all viral load measurements in the past 12 months undetectable or <200 copies/mL), when a condom was not used, and the partner was not known to be taking preexposure prophylaxis (PrEP).
Figure 13. Prevention Strategies Used During the Past 12 Months Among Sexually Active Men Who Have Sex with Men, Men Who Have Sex with Only Women, and Women Who Have Sex with Men with Diagnosed HIV— Medical Monitoring Project, United States, 2019
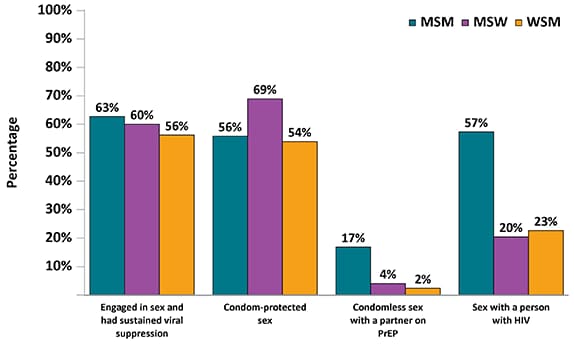
Note. MSM, men who have sex with men; MSW, men who have sex only with women; WSM, women who have sex with men.
Figure 14a. Percentage of Adults with Diagnosed HIV Who Received and Needed Ancillary Care Services Related to HIV Support During the 12 Months Before Interview—Medical Monitoring Project, United States, 2019
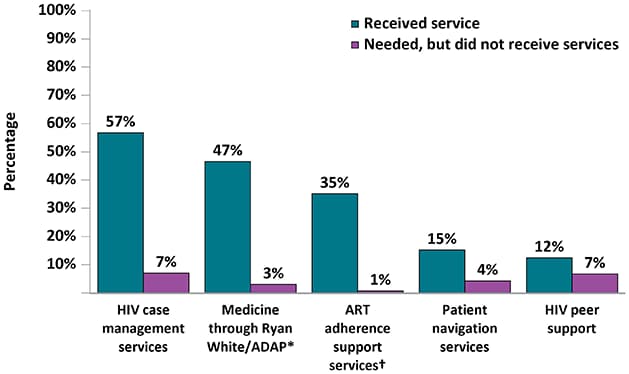
*AIDS Drug Assistance Program
†ART: Antiretroviral therapy
Figure 14b. Percentage of Adults with Diagnosed HIV Who Received and Needed Ancillary Care Services Related to Non-HIV Medical Services During the 12 Months Before Interview—Medical Monitoring Project, United States, 2019
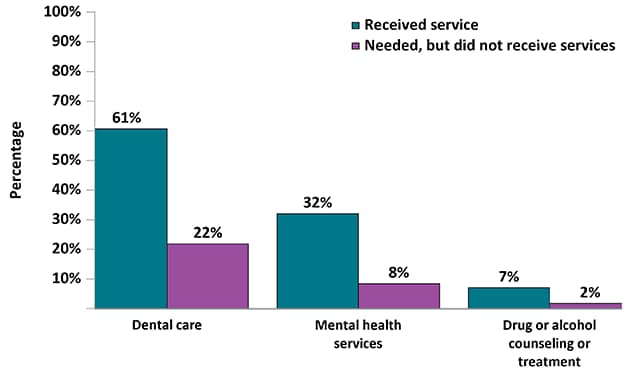
Figure 14c. Percentage of Adults with Diagnosed HIV Who Received and Needed Ancillary Care Services Related to Subsistence During the 12 Months Before Interview—Medical Monitoring Project, United States, 2019
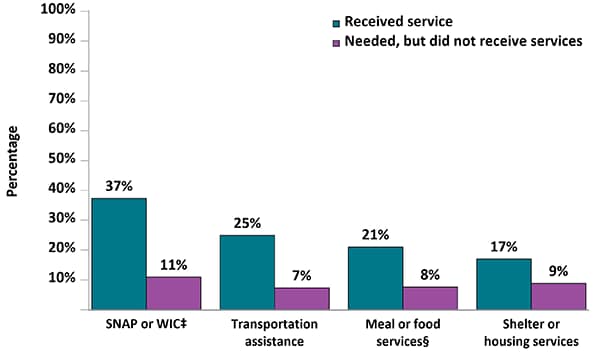
‡SNAP: Supplemental Nutrition Assistance Program; WIC: Special Supplemental Nutrition Program for Women, Infants, and Children
§Includes services such as soup kitchens, food pantries, food banks, church dinners, or food delivery services.
Figure 15. Percentage of Adults with Diagnosed HIV Who Experienced Physical Violence by an Intimate Partner or Forced Sex During Their Lifetime or the 12 Months Before Interview—Medical Monitoring Project, United States, 2019
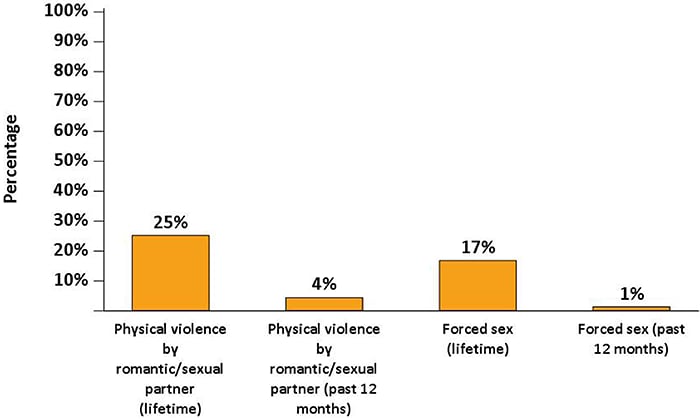
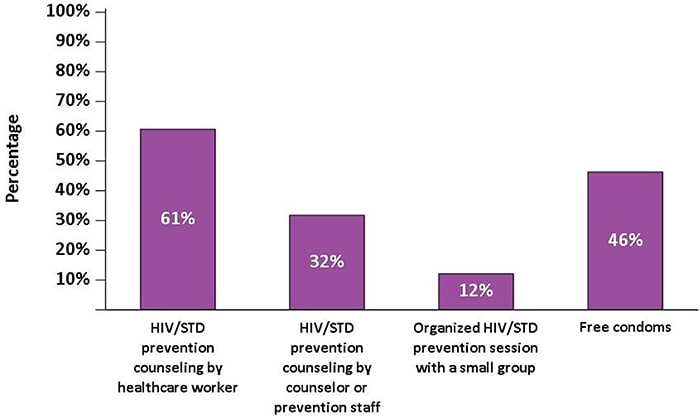
Figure 16. Receipt of HIV and Sexually Transmitted Disease Prevention Services During the 12 Months Before Interview—Medical Monitoring Project, United States, 2019