Behavioral and Clinical Characteristics of Persons Living with Diagnosed HIV Infection—Medical Monitoring Project, United States, 2019 Cycle: Commentary

At year-end 2018, an estimated 1,040,352 persons in the United States and 6 dependent areas were living with diagnosed HIV infection [1]. In 2019, the number of new HIV diagnoses was 37,881 [1]. Although the National HIV Surveillance System (NHSS) collects information about persons with diagnosed HIV infection [2], other surveillance systems provide more detailed information about care seeking, health care use, use of ancillary services, and other behaviors [3]. In 2005, in response to an Institute of Medicine (IOM) report outlining the need for representative data on persons with HIV [4], the Centers for Disease Control and Prevention (CDC) implemented the Medical Monitoring Project (MMP), which from 2009 to 2014 collected data from a 3-stage probability sample of adults receiving HIV medical care [5]. In 2015, in response to recommendations stemming from an IOM review of national HIV data systems [6], MMP sampling and weighting methods were revised to include all adults with diagnosed HIV infection regardless of HIV care status. MMP is a cross-sectional, nationally representative, complex sample survey that assesses the behavioral and clinical characteristics of adults with diagnosed HIV infection in the United States. MMP also provides information on behaviors and clinical outcomes affecting the risk of HIV transmission, morbidity, and mortality that are critical for achieving the goals of the HIV National Strategic Plan [7] and the Ending the HIV Epidemic in the U.S. (EHE) initiative [8], which seeks to reduce new HIV infections in the United States by 90% by 2030.
The 2019 MMP sample was selected in 2 consecutive stages: (1) U.S. states, the District of Columbia, and Puerto Rico and (2) persons aged ≥18 years with diagnosed HIV infection reported to NHSS as of December 31, 2018. A total of 23 project areas from 16 states and Puerto Rico were funded to conduct data collection for the 2019 cycle (Table 1).
This report presents unweighted frequencies and weighted prevalence estimates with 95% confidence intervals for selected characteristics. The estimates describe the characteristics of adults with diagnosed HIV infection who are living in the United States, hereafter referred to as persons with diagnosed HIV or persons. The period referenced for estimates is the 12 months before the participants’ interviews and medical record abstractions unless otherwise noted. Statistical software (SAS, version 9.4) was used for analysis of weighted data [9]. Data are not reported for estimates derived from a denominator size < 30 or with a coefficient of variation ≥ 0.30.
Estimates with an absolute confidence interval width ≥ 30, estimates with an absolute confidence interval width between 5 and 30 and a relative confidence interval width > 130%, and estimates of 0% or 100% are marked with an asterisk and should be interpreted with caution. No statistical tests were performed. Additional information on MMP is available at https://www.cdc.gov/hiv/statistics/systems/mmp/.
Highlights of Analyses
Response Rates
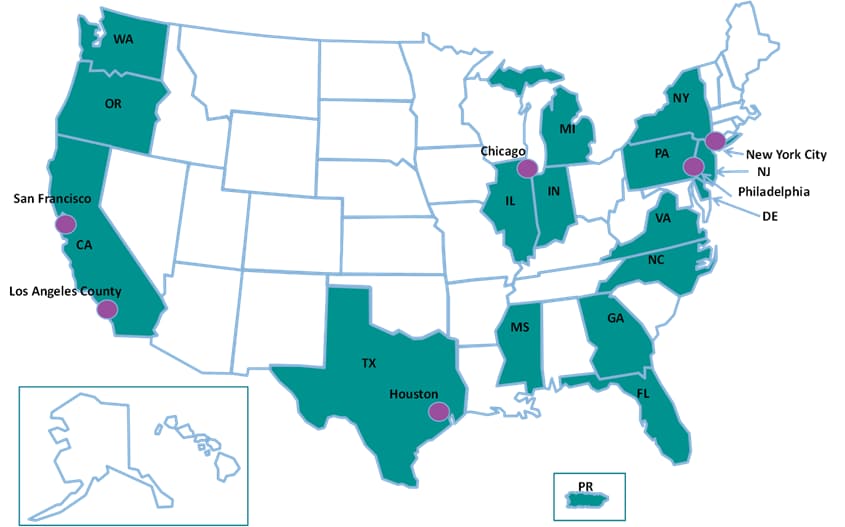
All 16 states, including 6 separately funded jurisdictions within those states, and the 1 territory sampled for MMP participated (Figure 1). In total, 9,700 persons were sampled from NHSS and 4,100 participated (Table 1). Adjusted for eligibility, the response rate was 45% (data not shown in table).
Figure 1. Participating Medical Monitoring Project Sites, Including 16 States and 6 Separately Funded Jurisdictions—United States, 2019
Sociodemographic Characteristics
An estimated 75% of persons were male, 23% were female, and 2% were transgender (Figure 2; Table 2). Nearly half (46%) identified themselves as heterosexual or straight; 42% as lesbian or gay; 9% as bisexual; and 3% as another sexual orientation. An estimated 42% were Black or African American, 29% were White, and 22% were Hispanic or Latino. Nearly three-quarters (74%) were aged at least 40 years, and 68% had received an HIV diagnosis at least 10 years earlier.
Figure 2. Distribution of Gender, Age, Sexual Orientation, and Race/Ethnicity Among Adults with Diagnosed HIV—Medical Monitoring Project, United States, 2019
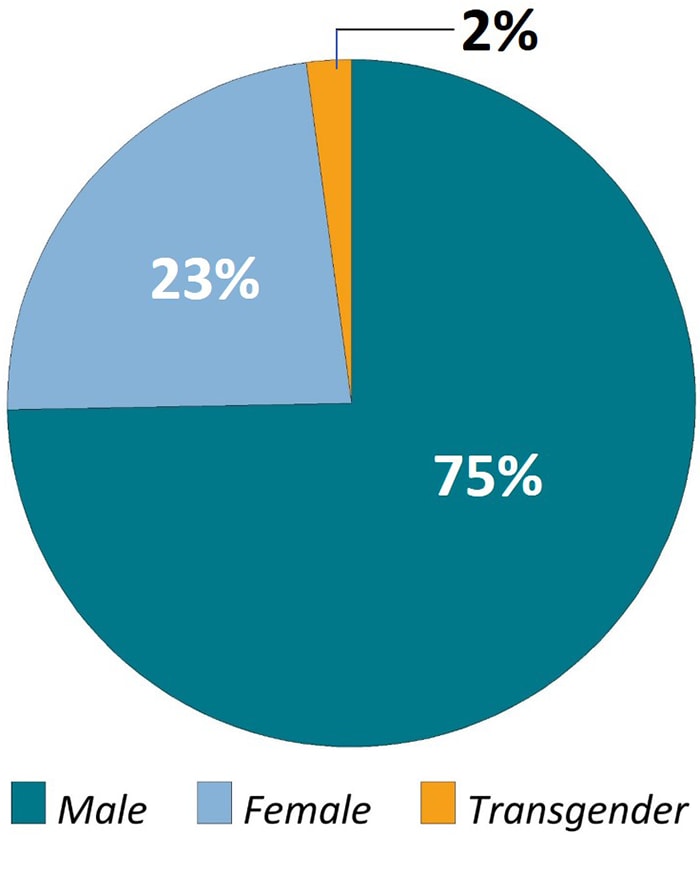
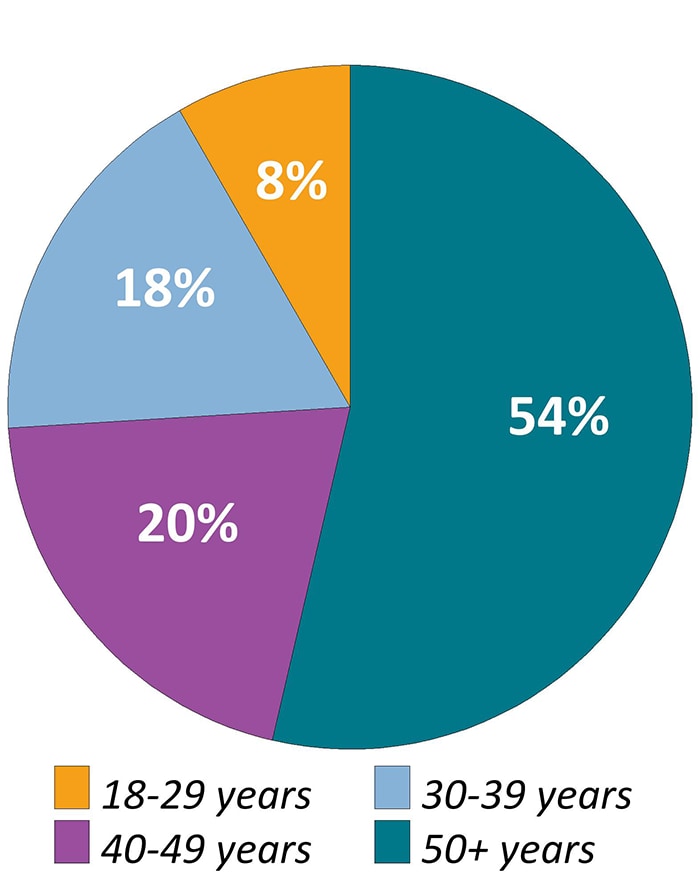
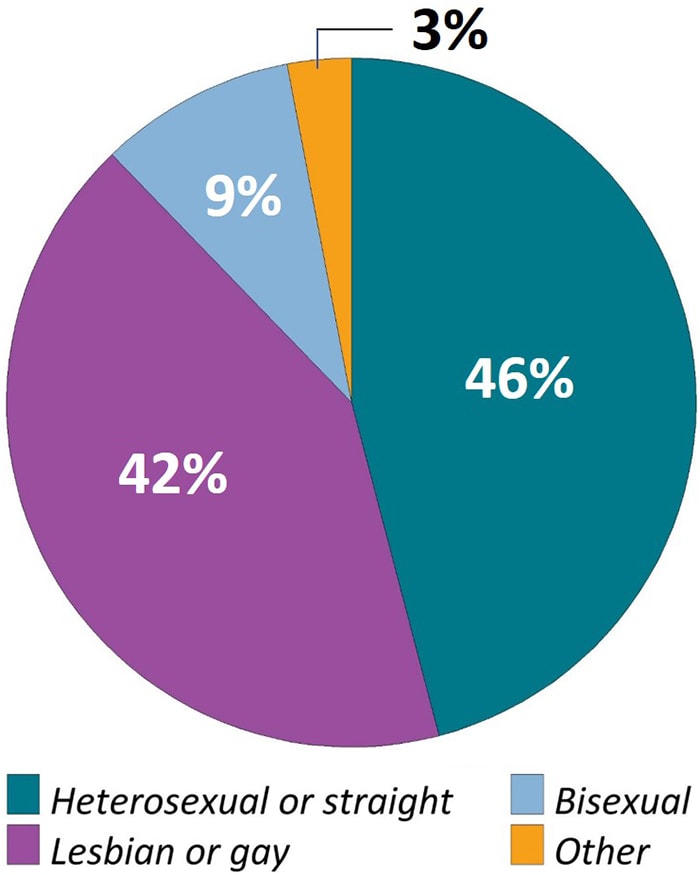
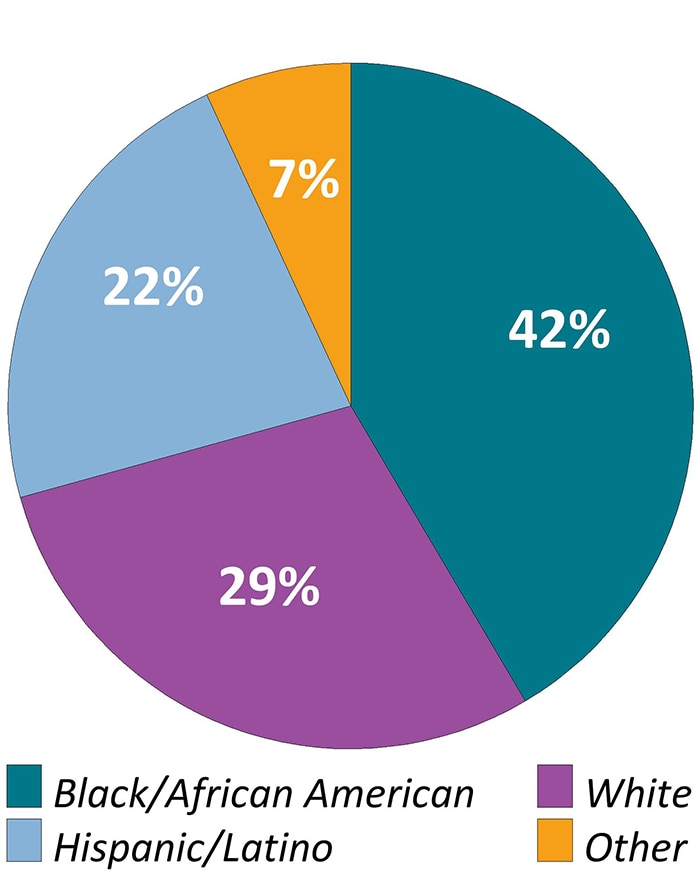
Note. Transgender persons defined as those who self-identified as transgender or who reported a gender identity different from sex assigned at birth. “Other” race/ethnicity defined as persons who were American Indian/Alaska Native, Asian, Native Hawaiian/Other Pacific Islander, or multiracial. Hispanics or Latinos can be of any race.
Download and Share Figure 2a Infographicimage icon
Download and Share Figure 2b Infographicimage icon
Download and Share Figure 2c Infographicimage icon
Download and Share Figure 2d Infographicimage icon
Over half (57%) had more than a high school education and 85% were born in a U.S. state or territory. The estimated prevalence of homelessness among all persons with diagnosed HIV was 9%. Approximately 13% had moved in with other people because of financial problems, and 3% had been evicted from housing during the past 12 months. An estimated 98% had health insurance or coverage for care or medications (including antiretroviral therapy [ART] medications): 46% had coverage through the Ryan White HIV/AIDS Program, 45% had Medicaid, 28% had Medicare, and 34% had private health insurance (Figure 3). An estimated 43% had a disability, 41% were unemployed, and 42% had household incomes at or below the federal poverty threshold. An estimated 18% received Supplemental Security Income (SSI), and 21% received Social Security Disability Insurance (SSDI).
Figure 3. Health Insurance or Coverage for Care or Medications During the 12 Months Before Interview Among Adults With Diagnosed HIV—Medical Monitoring Project, United States, 2019
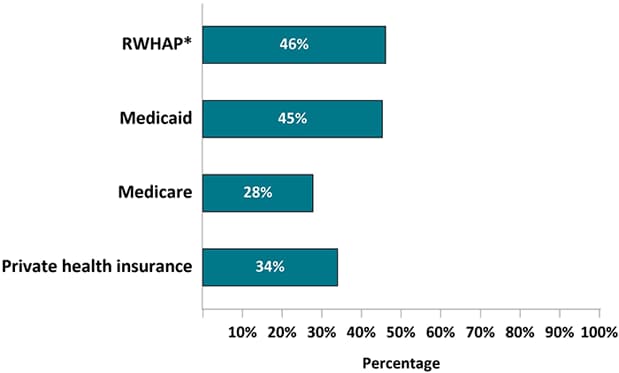
Note. Healthcare insurance/coverage types not mutually exclusive; people could report >1 type of coverage.
*RWHAP, Ryan White HIV/AIDS Program
Clinical Characteristics
According to the CDC stage of disease classification for HIV infection [10], an estimated 57% of persons ever had stage 3 (AIDS) disease (Table 3). An estimated 8% of persons had a geometric mean CD4 T-lymphocyte (CD4) count of 0–199 cells/µL. The estimated average geometric mean CD4 count among all persons was 637 cells/µL, and the median geometric mean CD4 count was 602 cells/µL (range, 1–2,650) (data not shown in table).
An estimated 67% of persons had an undetectable (< 200 copies/mL) viral load at the most recent measurement, while 61% had undetectable viral loads at all measurements during the past 12 months (sustained viral suppression) (Figure 4; Table 3).
Figure 4. Percentage of Adults with Diagnosed HIV Who Were Virally Suppressed During the 12 Months Before Interview—Medical Monitoring Project, United States, 2019
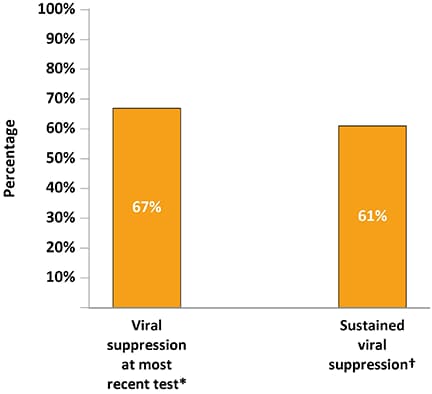
*Viral load <200 copies/mL or undetectable based on most recent test in the past 12 months.
†Sustained viral suppression defined as having all viral load tests in the past 12 months <200 copies/mL or undetectable.
Use of Health Care Services
Overall, 97% had received outpatient HIV care during the past 12 months (Figure 5; Table 4). An estimated 79% were retained in care during the past 12 months, while 61% were retained in care during the past 24 months. An estimated 83% of persons had an ART prescription documented in the medical record during the 12 months before interview. Of persons who met the clinical criteria for Pneumocystis pneumonia (PCP) prophylaxis, 33% had a prescription for PCP prophylaxis documented in the medical record.
Figure 5. Receipt of HIV Care and Antiretroviral Therapy Prescription During the 12 Months Before Interview Among Adults with Diagnosed HIV—Medical Monitoring Project, United States, 2019
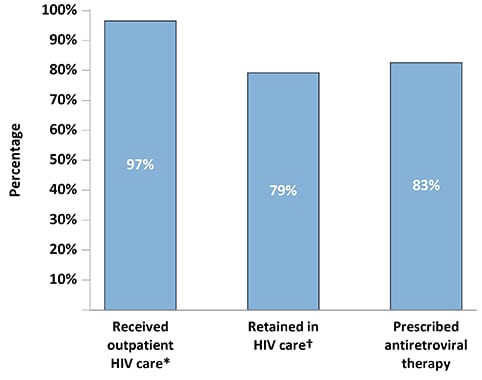
*Outpatient HIV care was defined as any documentation of the following: encounter with an HIV care provider, viral load test result, CD4 test result, HIV resistance test or tropism assay, ART prescription, PCP prophylaxis, or MAC prophylaxis.
†Two elements of outpatient HIV care at least 90 days apart in each 12-month period.
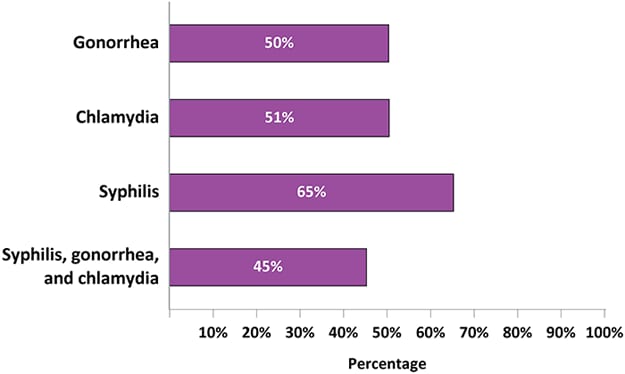
Among sexually active persons, an estimated 50% were tested for gonorrhea, 51% for chlamydia, 65% for syphilis, and 45% for all 3 sexually transmitted diseases (STDs) (Figure 6; Table 5).
Figure 6. Percentage of Sexually Active Adults with Diagnosed HIV Who Tested for Gonorrhea, Chlamydia, or Syphilis During the 12 Months Before Interview—Medical Monitoring Project, United States, 2019
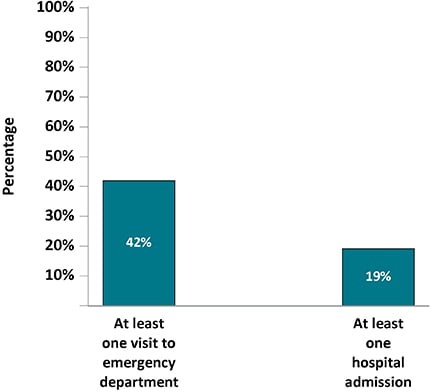
An estimated 42% of persons were seen in an emergency department at least once, and 4% were seen at least 5 times (Figure 7; Table 6). An estimated 19% of persons were admitted to a hospital for an illness at least once.
Figure 7. Percentage of Adults with Diagnosed HIV Who Had At Least One Visit to the Emergency Room Or At Least One Hospital Admission During the 12 Months Before interview—Medical Monitoring Project, United States, 2019
Self-reported ART Medication Use and Adherence
An estimated 98% of persons had ever taken ART and 94% of persons were currently taking ART, based on self-report (Table 7). Among the estimated 4% of persons with a history of ART use but who were not currently taking ART, 51% were not taking ART due to money or insurance problems and 29% were not taking ART because the person’s health care provider never discussed restarting ART with them (Table 7).
Among persons taking ART, 61% took all of their ART doses in the past 30 days (Table 8). Among persons taking ART, 76% had never been troubled by ART side effects during the past 30 days; 14% had rarely been troubled. Among persons who had ever missed a dose, the most common reasons given for not taking one’s most recently missed ART dose were forgetting (60%), a change in one’s daily routine or being out of town (40%), and falling asleep early or oversleeping (35%) (Figure 8).
Figure 8. Reasons for Missing Last Antiretroviral Therapy Dose Among Adults with Diagnosed HIV Who Have Ever Missed a Dose—Medical Monitoring Project, United States, 2019*
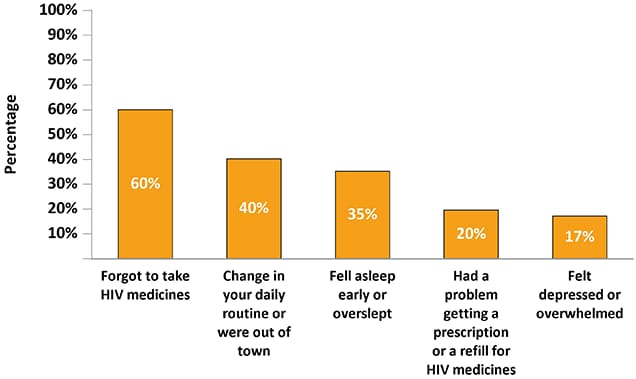
*Participants may report more than one reason for last missed dose.
Clinical Characteristics by Selected Populations
The estimated prevalence of ART prescription documented in a medical record was 83% among males and 83% among females (Table 9). An estimated 80% of Blacks or African Americans were prescribed ART, compared with 86% of Hispanics or Latinos and 85% of Whites. The estimated prevalence of ART prescription was 76% among persons aged 18 to 29 years and 85% among those aged 50 years or older.
The estimated prevalence of sustained viral suppression was 62% among males and 59% among females. An estimated 56% of Blacks or African Americans had sustained viral suppression, compared with 67% of Hispanics or Latinos and 66% of Whites. The estimated prevalence of sustained viral suppression was 49% among persons aged 18 to 29 years and 67% among those aged 50 years or older.
Depression and Substance Use
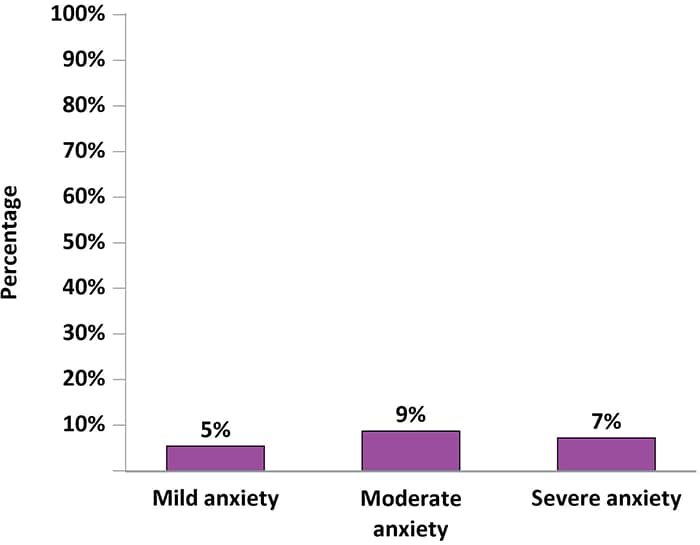
The estimated prevalence of major or other depression in the past 2 weeks based on the Patient Health Questionnaire (PHQ-8) algorithm [11] was 16%, including 9% with major depression (Figure 9; Table 10). Based on the total PHQ-8 symptom score (see the appendix), an estimated 13% of persons had moderate or severe depression. The estimated prevalence of mild, moderate, or severe anxiety in the past 2 weeks based on the Generalized Anxiety Disorder Scale (GAD-7) [12] was 21%, including 7% with severe anxiety.
Figure 9. Percentage of Adults with Diagnosed HIV Who Experienced Symptoms of Major or Other Depression* and Generalized Anxiety Disorder† During the Two Weeks Before interview—Medical Monitoring Project, United States, 2019

*Responses to the items on the PHQ-8 were used to define “major depression” and “other depression” according to criteria from the DSM-IV. “Major depression” was defined as having at least 5 symptoms of depression; “other depression” was defined as having 2–4 symptoms of depression. The PHQ-8 classification “other depression” comprises the DSM-IV categories of dysthymia and depressive disorder, not otherwise specified, which includes minor or subthreshold depression.
†Responses to the GAD-7 were used to define “mild anxiety,” “moderate anxiety,” and “severe anxiety,” according to criteria from the DSM-IV. “Severe anxiety” was defined as having a score of ≥ 15; “moderate anxiety” was defined as having a score of 10–14; and “mild anxiety” was defined as having a score of 5–9.
Download and Share Figure 9a Infographicimage icon
Download and Share Figure 9b Infographicimage icon
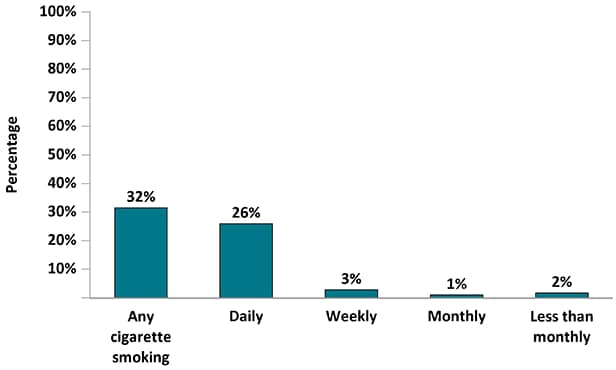
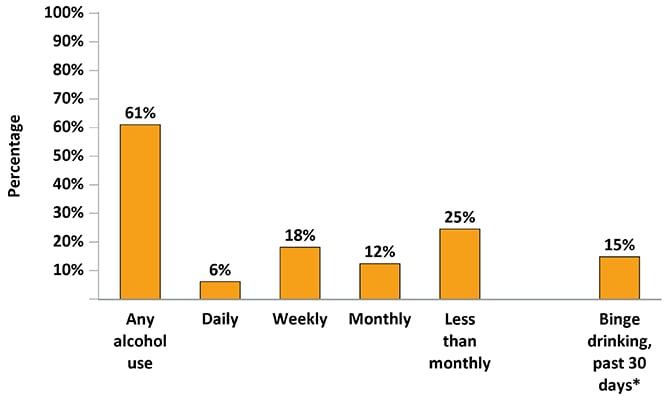
The estimated prevalence of current smoking was 32%: 26% of persons smoked daily, 3% weekly, 1% monthly, and 2% less than monthly (Figure 10; Table 11). The estimated prevalence of alcohol use was 61%: 6% of persons drank alcohol daily, 18% weekly, 12% monthly, and 25% less than monthly (Figure 10; Table 12). An estimated 15% of persons engaged in binge drinking during the past 30 days.
Figure 10. Percentage of Adults with Diagnosed HIV Who Smoked Cigarettes and Drank Alcohol During the 12 Months Before interview—Medical Monitoring Project, United States, 2019
An estimated 32% of persons used noninjection drugs for nonmedical purposes (Table 13). In total, an estimated 29% used marijuana, 7% used poppers (amyl nitrite), 6% used cocaine, 5% used methamphetamines, 4% used club drugs, 3% used crack, and 3% used prescription opioids. An estimated 3% of persons used injection drugs for nonmedical purposes (Table 14). In total, an estimated 2% injected methamphetamines and 1% injected heroin.
Gynecologic and Reproductive Health
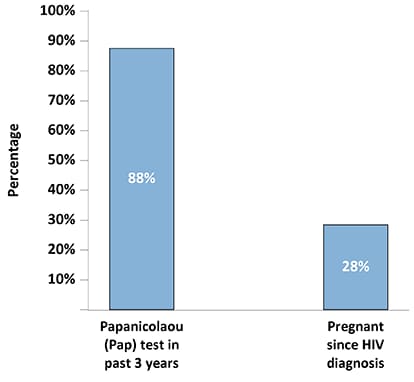
Among females, 88% reported receiving a Papanicolaou (Pap) test in the past 3 years (Figure 11; Table 15). An estimated 28% of females reported being pregnant at least once since receiving an HIV diagnosis.
Figure 11. Percentage of Female Adults with Diagnosed HIV Who Had a Papanicolaou Test During the Three Years Before interview Or Became Pregnant Since Receiving an HIV Diagnosis—Medical Monitoring Project, United States, 2019
Sexual Behavior
An estimated 35% of men had receptive anal sex with men, 32% had insertive anal sex with men, and 18% had vaginal sex (Table 16). An estimated 39% of men did not have vaginal or anal sex. Among women, an estimated 5% had receptive anal sex, 50% had vaginal sex, and 50% did not have vaginal or anal sex. Among transgender persons, 75% had vaginal or anal sex (Table 17).
Among men who had sex with men, an estimated 9% engaged in high-risk sex, compared with 5% of men who had sex only with women and 7% of women who had sex with men (Figure 12; Table 18).
Figure 12. Percentage of Adults with Diagnosed HIV Who Engaged in High-Risk Sex* During the 12 Months Before Interview by Sexual Behavior/Orientation—Medical Monitoring Project, United States, 2019
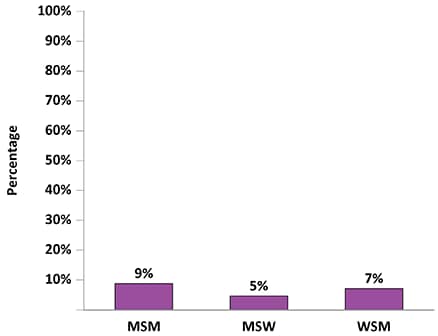
Note. MSM, men who have sex with men; MSW, men who have sex only with women; WSM, women who have sex with men.
*Vaginal or anal sex with at least 1 HIV-negative or unknown status partner while not having sustained viral suppression (all viral load measurements in the past 12 months undetectable or <200 copies/mL), when a condom was not used, and the partner was not known to be taking preexposure prophylaxis (PrEP).
In terms of prevention strategies among sexually active persons, an estimated 63% of men who had sex with men engaged in sex and had sustained viral suppression, 56% had condom-protected sex, 17% had condomless sex with a partner on preexposure prophylaxis (PrEP), and 57% had sex with a person with HIV (Figure 13; Table 18). Among sexually active men who had sex only with women, 60% engaged in sex and had sustained viral suppression, 69% had condom-protected sex, 4% had condomless sex with a partner on PrEP, and 20% had sex with a person with HIV. Among sexually active women who had sex with men, 56% engaged in sex and had sustained viral suppression, 54% had condom-protected sex, 2% had condomless sex with a partner on PrEP, and 23% had sex with a person with HIV.
Figure 13. Prevention Strategies Used During the Past 12 Months Among Sexually Active Men Who Have Sex with Men, Men Who Have Sex with Only Women, and Women Who Have Sex with Men with Diagnosed HIV— Medical Monitoring Project, United States, 2019
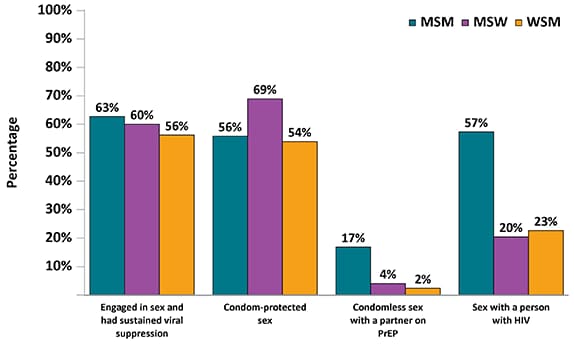
Note. MSM, men who have sex with men; MSW, men who have sex only with women; WSM, women who have sex with men.
Met and Unmet Need for Ancillary Services
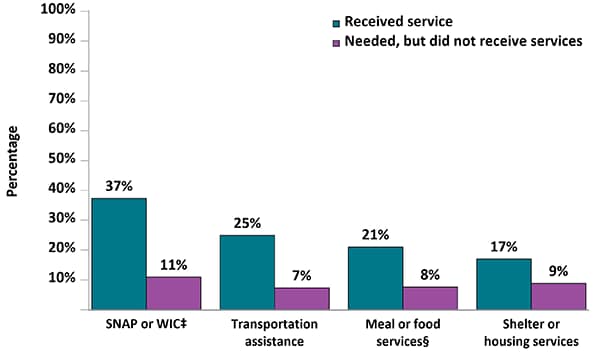
Among all HIV support services, the most commonly reported service received in the 12 months before interview was HIV case management (57%); estimated unmet need for HIV case management services was 7% (Figure 14; Table 19). Of all non-HIV medical care services, the most commonly reported service received was dental care (61%); 22% reported an unmet need for dental care. Among all subsistence services, the most commonly reported services received were obtained through the Supplemental Nutrition Assistance Program (SNAP) or Special Supplemental Nutrition Program for Women, Infants, and Children (WIC) (37%); unmet need for SNAP or WIC services was 11%.
Figure 14a. Percentage of Adults with Diagnosed HIV Who Received and Needed Ancillary Care Services Related to HIV Support During the 12 Months Before Interview—Medical Monitoring Project, United States, 2019
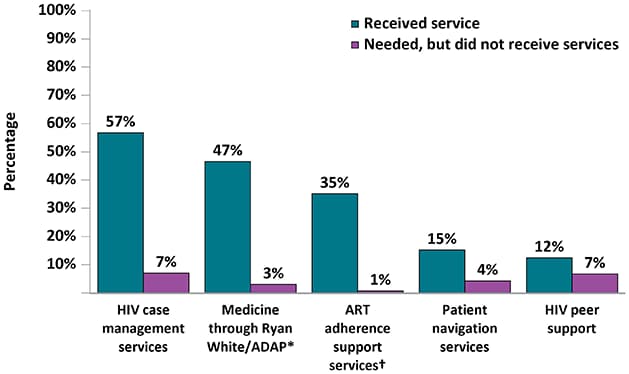
Figure 14b. Percentage of Adults with Diagnosed HIV Who Received and Needed Ancillary Care Services Related to Non-HIV Medical Services During the 12 Months Before Interview—Medical Monitoring Project, United States, 2019
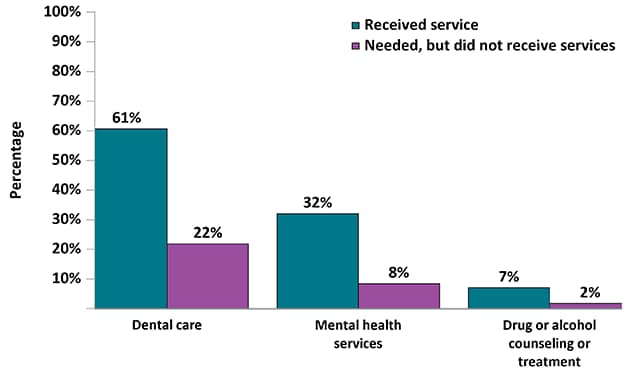
Figure 14c. Percentage of Adults with Diagnosed HIV Who Received and Needed Ancillary Care Services Related to Subsistence During the 12 Months Before Interview—Medical Monitoring Project, United States, 2019
*AIDS Drug Assistance Program
†ART: Antiretroviral therapy
‡SNAP: Supplemental Nutrition Assistance Program; WIC: Special Supplemental Nutrition Program for Women, Infants, and Children
§Includes services such as soup kitchens, food pantries, food banks, church dinners, or food delivery services.
Physical Violence and Forced Sex
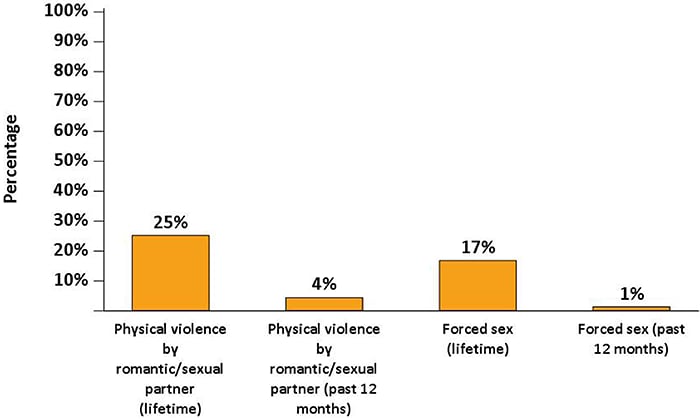
An estimated 25% of persons had ever been physically hurt by a romantic or sexual partner, including 4% who experienced this in the past 12 months (Figure 15; Table 20). An estimated 17% of persons had ever been threatened with harm or physically forced to have unwanted sex, including 1% who experienced this in the past 12 months.
Figure 15. Percentage of Adults with Diagnosed HIV Who Experienced Physical Violence by an Intimate Partner or Forced Sex During Their Lifetime or the 12 Months Before Interview—Medical Monitoring Project, United States, 2019
Prevention Activities
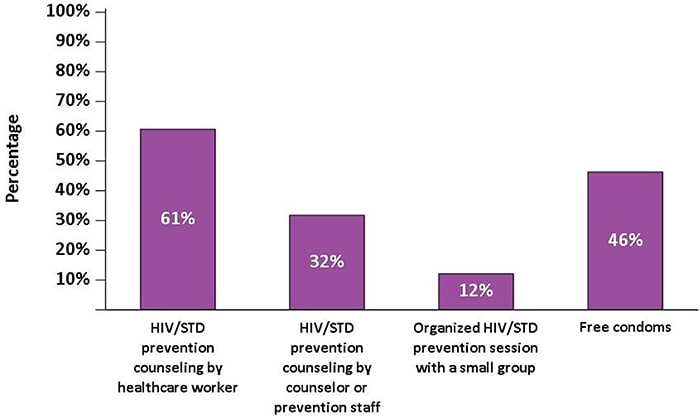
An estimated 61% of persons received counseling from a physician, nurse, or other health care worker about HIV and STD risk reduction; 32% had a one-on-one conversation with an outreach worker, a counselor, or a prevention program worker about prevention; and 12% participated in a small-group session (excluding discussions with friends) to discuss the prevention of HIV and other STDs (Figure 16; Table 21). An estimated 46% of persons received free condoms from various organizations.
Figure 16. Receipt of HIV and Sexually Transmitted Disease Prevention Services During the 12 Months Before Interview—Medical Monitoring Project, United States, 2019
Centers for Disease Control and Prevention National Indicators
The estimated prevalence of homelessness among persons who received outpatient HIV care in the past 12 months was 9% (Table 22). The median HIV stigma score (see the appendix for more details on how the score was derived and its validity) among all persons was 38. When the personalized stigma dimension was limited to the past 12 months, the median HIV stigma score was 31. An estimated 7% of persons engaged in high-risk sex.
References
- CDC. HIV Surveillance Report, 2018 (Updated); vol. 31. https://www.cdc.gov/hiv/library/reports/hiv-surveillance.html. Published May 2020. Accessed June 23, 2021.
- Nakashima AK, Fleming HIV/AIDS surveillance in the United States, 1981–2001. J Acquir Immune Defic Syndr 2003;32(suppl 1):S68–S85.
- McNaghten AD, Wolfe MI, Onorato I, et Improving the representativeness of behavioral and clinical surveillance for persons with HIV in the United States: the rationale for developing a population-based approach. PLoS One 2007;2(6):e550.
- Institute of Medicine. Measuring What Matters: Allocation, Planning and Quality Assessment for the Ryan White CARE Act. Washington, DC: National Academies Press; https://www.nap.edu/read/10855external icon. Published November 7, 2003. Accessed June 23, 2021.
- CDC. Behavioral and Clinical Characteristics of Persons Receiving Medical Care for HIV Infection—Medical Monitoring Project, United States, 2010. HIV Surveillance Special Report 9. https://www.cdc.gov/hiv/library/reports/ hiv-surveillance.html. Published October 2014. Accessed June 23, 2021.
- Institute of Monitoring HIV Care in the United States: Indicators and Data Systems. Washington, DC: National Academies Press; 2012. doi:10.17226/13225external icon
- U.S. Department of Health and Human Services. HIV National Strategic Plan for the United States: A Roadmap to End the Epidemic 2021–2025. https://www.hiv.gov/federal-response/hiv-national-strategic-plan/hiv-plan-2021-2025external icon. Published January 15, 2021. Accessed June 23, 2021.
- Fauci AS, Redfield RR, Sigounas G, Weahkee MD, Giroir Ending the HIV Epidemic: A Plan for the United States [editorial]. JAMA 2019;321(9):844–845. doi:10.1001/jama.2019.1343external icon
- SAS Institute SAS version 9.4. Cary, NC: SAS Institute; 2011.
- CDC [Selik RM, Mokotoff ED, Branson B, Owen SM, Whitmore S, Hall HI]. Revised surveillance case definition for HIV infection—United States, 2014. MMWR 2014;63(RR-03):1–10. https://www.cdc.gov/mmwr/indrr_2014.html. Accessed June 23, 2021.
- Kroenke K, Strine TW, Spitzer RL, et The PHQ-8 as a measure of current depression in the general population. J Affect Disord 2009;114(1–3):163–173. doi:10.1016/j.jad.2008.06.026external icon
- Spitzer RL, Kroenke K, Williams JB, Löwe A brief measure for assessing generalized anxiety disorder: the GAD-7. Arch Intern Med 2006;166(10):1092–1097. doi:10.1001/archinte.166.10.1092external icon