Procurement Data
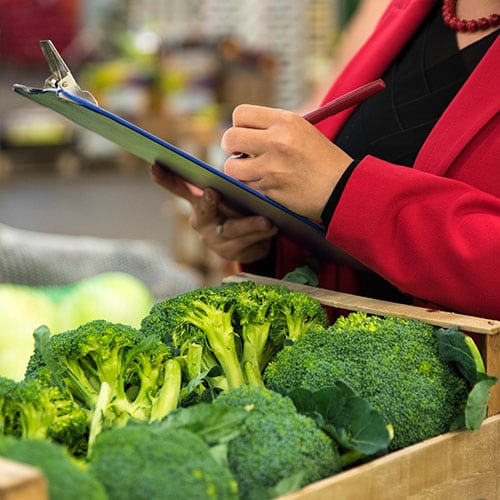
Procurement, or purchasing data, reflect the foods and beverages purchased by a cafeteria or snack bar manager, vending operator, or other personnel. The foods may be purchased from food distributors, warehouse clubs, or even supermarkets. These data include ingredients used to prepare dishes as well as prepackaged foods and beverages for sale or distribution directly to consumers.
Using Procurement Data for Food Service Guidelines Evaluation
Procurement data offer a feasible method to measure changes in the sales of healthy and less healthy foods in cafeterias in many worksite and community settings. You can categorize these data into specific healthy and less healthy food categories that correspond with specific food and nutrition standards in your food service guidelines. See table for examples of procurement data you can use as proxy measures to assess whether food and nutrition standards are being met. In addition, procurement data can be used to conduct audits in food pantries. For example, you can determine how much low-sodium canned products are ordered compared to higher sodium canned products.
Advantages of Procurement Data
- Data are usually collected as part of normal business practice. Therefore, obtaining the data should not pose a large additional burden on food service managers.
- For cafeterias, procurement data may be compiled by food distributors.
- Since a significant segment of US food distribution is performed by a small number of large national companies, a large portion of procurement data across sites may consist of similarly formatted data from several overlapping companies.
- Procurement data is useful in community settings where foods are served (rather than sold).
Disadvantages of Procurement Data
- Procurement data does not always precisely correspond with the foods purchased or eaten by consumers. This is especially true when ingredients purchased are incorporated into recipes prepared on site.
- A time lag may occur between when foods are purchased by the food service manager and when they are purchased by consumers. This time lag may differ by facility and food type. For example, time lags will likely be shorter for perishable foods, such as fresh fruits and vegetables and bread products, compared to nonperishable foods such as canned goods. Time lags may also differ between facilities depending on storage space available. These time lags can be overcome somewhat by examining procurement over longer time periods. Further refinements in data can be made by examining the frequency of purchasing for specific product categories at a given facility and by talking to food service managers to better understand purchasing schedules.
- Procurement records may not be in a format that allow easy importation directly into a database. As such, abstraction of relevant data from procurement records may involve a substantial amount of manual data entry from several documents.
- Using procurement data may involve a substantial amount of work to seek out nutritional information for specific products or standardize dissimilar units used to record sales of food products. For example, assessing cereals according to whole grain content may require looking up nutrition information for specific cereal brands. Measuring fresh vegetable purchasing may require standardization between vegetables sold in cases containing unit counts and vegetables sold by cases based upon weight. You can get this information from sources such as procurement records or the distributors’ websites, or by physically examining the inventory.
- Some parameters of interest, such as local procurement, may be difficult for the distributor to supply.
| Food Category | Food and Nutrition Standards | Potential Proxy Measures Using Procurement Data |
|---|---|---|
| Fruits |
|
|
| Vegetables |
|
|
| Grains |
|
|
| Dairy |
|
|
| Beverages |
|
|

