Coal Operator Mining Facts - 2007 (HTML)
DHHS (NIOSH) Publication No. 2009–159
Mining Operations
In 2007, a total of 2,030 coal mining operations reported employment data to the Mine Safety and Health Administration (MSHA). [1] Coal mines comprised 13.7% of all mining operations.
- Bituminous mines comprised 92.4% (n=1,875) and anthracite mines 7.6% (n=155) of coal mining operations.
- Approximately 72% of all coal mines were located in three states: Kentucky (28.4%), West Virginia (22.6%), and Pennsylvania (20.5%).
Employees
A total of 84,071 employees, [2] corresponding to 93,265 full-time equivalent (FTE) [3] employees, were reported by coal mine operators to MSHA.
- Within the mining sectors, [4] coal operators comprised 27.7% of all employee hours reported.
- Underground work locations accounted for 45.3% of employee hours, while surface work locations accounted for 54.7%. [5]
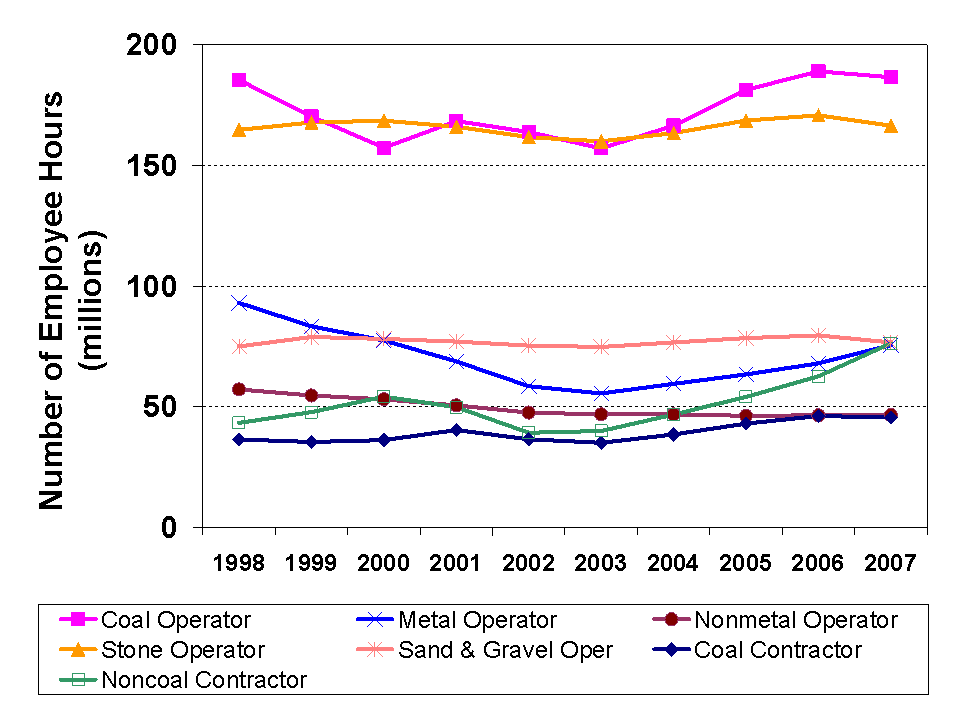
| Commodity and Type of Employer |
1998 | 1999 | 2000 | 2001 | 2002 | 2003 | 2004 | 2005 | 2006 | 2007 |
|---|---|---|---|---|---|---|---|---|---|---|
| Coal Operator | 185.4 | 170.3 | 157.3 | 168.4 | 163.8 | 157.1 | 166.5 | 181.3 | 189.0 | 186.5 |
| Metal Operator | 93.0 | 83.4 | 77.4 | 68.8 | 58.5 | 55.5 | 59.5 | 63.4 | 67.9 | 75.5 |
| Nonmetal Operator | 57.2 | 54.7 | 53.1 | 50.6 | 47.5 | 46.9 | 46.9 | 46.2 | 46.4 | 46.5 |
| Stone Operator | 164.8 | 167.8 | 168.5 | 166.1 | 161.7 | 160.0 | 163.5 | 168.6 | 170.8 | 166.5 |
| Sand and Gravel Operator | 75.0 | 78.9 | 78.1 | 77.0 | 75.3 | 74.8 | 76.6 | 78.4 | 79.6 | 76.7 |
| Coal Contractor | 36.4 | 35.4 | 36.2 | 40.3 | 36.5 | 35.0 | 38.5 | 43.0 | 46.2 | 45.5 |
| Noncoal Contractor | 43.3 | 47.8 | 54.2 | 49.8 | 39.2 | 39.9 | 46.8 | 54.1 | 62.6 | 76.3 |
Fatalities
Twenty-eight (28) occupational fatalities occurred among coal operator employees in 2007, compared to 42 in 2006.
- Fatalities among coal operator employees accounted for 41.8% of all mining fatalities.
- The coal operator fatality rate was 31.2 fatalities per 100,000 FTE employees. The underground fatality rate was 42.6 (n=18) compared to a rate of 21.1 (n=10) for surface work locations.
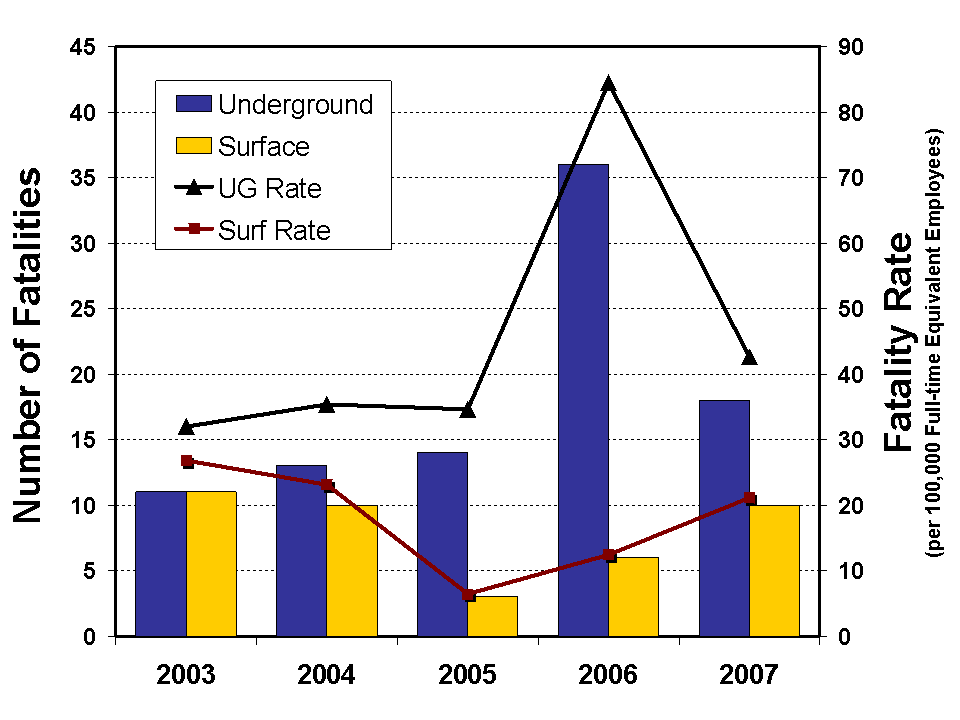
| Fatalities | 2003 | 2004 | 2005 | 2006 | 2007 |
|---|---|---|---|---|---|
| Underground number | 11 | 13 | 14 | 36 | 18 |
| Surface number | 11 | 10 | 3 | 6 | 10 |
| Underground rate | 32.0 | 35.4 | 34.6 | 84.5 | 42.6 |
| Surface rate | 26.8 | 23.1 | 6.4 | 12.4 | 21.1 |
Nonfatal Lost-time Injuries
There were 2,942 nonfatal lost-time injuries (2,120 at underground and 822 at surface work locations) among coal operator employees occurring at an overall rate of 3.3 injuries per 100 FTE employees. These injuries resulted in 192,129 days lost from work, [6] comprising 45.1% of days lost across all mining sectors.
- The underground nonfatal lost-time injury rate was greater than the surface injury rate (5.0 vs. 1.7 per 100 FTE workers).
- The most frequent classification of nonfatal lost-time injuries for coal operator employees involved handling materials (n=805; 27.4%).
- Sprains and strains were the most frequently reported nature of injury (n=1,237; 42.0%).
- The back was the most frequently reported body part injured (n=524; 17.8%) and accounted for 34,799 days lost from work.
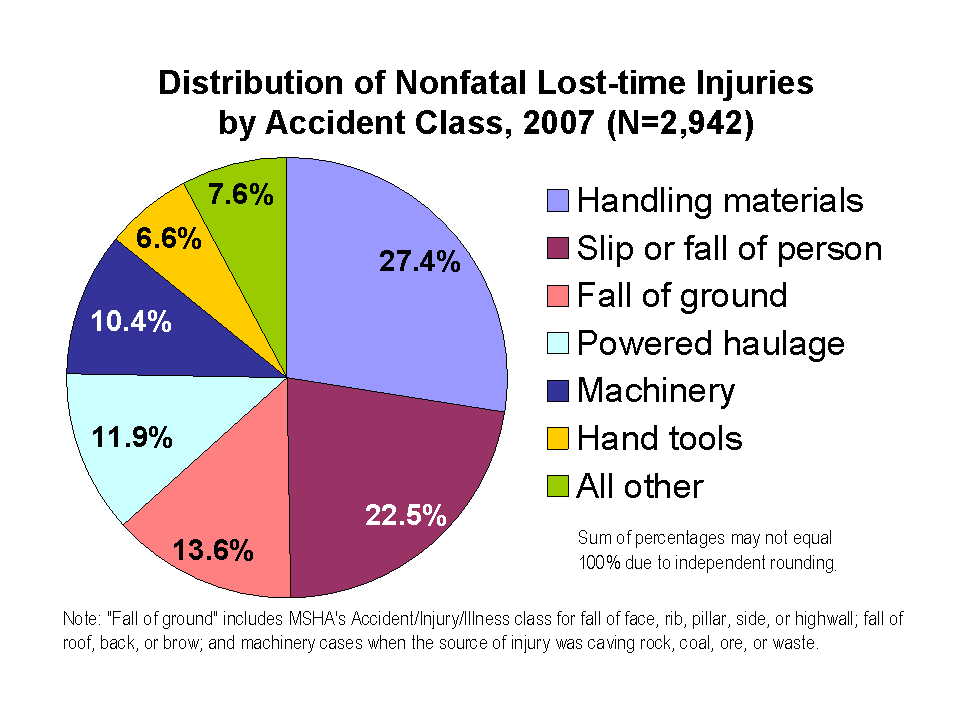
| Accident Class | Number | Percent |
|---|---|---|
| Handling materials | 805 | 27.4 |
| Slip or fall of person | 661 | 22.5 |
| Fall of ground | 399 | 13.6 |
| Powered haulage | 351 | 11.9 |
| Machinery | 306 | 10.4 |
| Hand tools | 195 | 6.6 |
| All other | 225 | 7.6 |
| Total | 2,942 | 100.0 |
Mining operations, 2007
| Commodity and Type of Employer | Underground Mining Operations [1] | Surface Mining Operations [1] | Total Mining Operations [1] |
|---|---|---|---|
| Coal Operator | 631 | 1,399 | 2,030 |
| Metal Operator | 97 | 181 | 278 |
| Nonmetal Operator | 48 | 677 | 725 |
| Stone Operator | 113 | 4,526 | 4,639 |
| Sand & Gravel Operator | Not applicable | 7,199 | 7,199 |
| Operator Total | 889 | 13,982 | 14,871 |
Contracting companies, 2007
| Commodity and Type of Employer | Number of Companies |
|---|---|
| Coal Contractor | 2,999 |
| Noncoal Contractor | 5,400 |
| Contractor Total | 8,399 |
Employment characteristics, 2007
| Commodity and Type of Employer | Underground Employees [2] | Surface Employees [2] | Total Employees [2] | Underground FTE Employees [3] | Surface FTE Employees [3] | Total FTE Employees [3] |
|---|---|---|---|---|---|---|
| Coal Operator | 37,829 | 46,242 | 84,071 | 42,238 | 51,027 | 93,265 |
| Metal Operator | 5,333 | 30,667 | 36,000 | 5,437 | 32,309 | 37,746 |
| Nonmetal Operator | 2,411 | 20,453 | 22,864 | 2,478 | 20,788 | 23,265 |
| Stone Operator | 1,845 | 80,873 | 82,718 | 2,063 | 81,191 | 83,254 |
| Sand & Gravel Operator | Not applicable | 45,761 | 45,761 | Not applicable | 38,340 | 38,340 |
| Operator Total | 47,418 | 223,996 | 271,414 | 52,216 | 223,655 | 275,871 |
| Coal Contractor | 5,160 | 33,705 | 38,865 | 3,071 | 19,670 | 22,741 |
| Noncoal Contractor | 3,039 | 64,805 | 67,844 | 1,935 | 36,216 | 38,151 |
| Contractor Total | 8,199 | 98,510 | 106,709 | 5,006 | 55,886 | 60,892 |
| Total | 55,617 | 322,506 | 378,123 | 57,222 | 279,541 | 336,763 |
Mining Occupational Fatalities (per 100,000 FTE employees), 2007
| Commodity and Type of Employer | Underground Fatalities | Underground Fatality Rate | Surface Fatalities | Surface Fatality Rate | Fatalities | Fatality Rate |
|---|---|---|---|---|---|---|
| Coal Operator | 18 | 42.6 | 10 | 21.1 | 28 | 31.2 |
| Metal Operator | 3 | 55.2 | 4 | 14.4 | 7 | 21.1 |
| Nonmetal Operator | 1 | 40.4 | 0 | 0.0 | 1 | 5.0 |
| Stone Operator | 0 | 0.0 | 8 | 11.4 | 8 | 11.1 |
| Sand & Gravel Operator | Not applicable | Not applicable | 5 | 15.0 | 5 | 15.0 |
| Operator Total | 22 | 42.1 | 27 | 13.8 | 49 | 19.7 |
| Coal Contractor | 3 | 97.7 | 3 | 16.3 | 6 | 28.0 |
| Noncoal Contractor | 2 | 103.4 | 10 | 29.3 | 12 | 33.3 |
| Contractor Total | 5 | 99.9 | 13 | 24.8 | 18 | 31.3 |
| Total | 27 | 47.2 | 40 | 16.1 | 67 | 21.9 |
Nonfatal Lost-time Injuries (per 100 FTE employees), 2007
| Commodity and Type of Employer | Underground Injuries | Underground Injury Rate | Surface Injuries | Surface Injury Rate | Injuries | Injury Rate |
|---|---|---|---|---|---|---|
| Coal Operator | 2,120 | 5.0 | 822 | 1.7 | 2,942 | 3.3 |
| Metal Operator | 178 | 3.3 | 620 | 2.2 | 798 | 2.4 |
| Nonmetal Operator | 91 | 3.7 | 417 | 2.4 | 508 | 2.5 |
| Stone Operator | 36 | 1.7 | 1,844 | 2.6 | 1,880 | 2.6 |
| Sand & Gravel Operator | Not applicable | Not applicable | 657 | 2.0 | 657 | 2.0 |
| Operator Total | 2,425 | 4.6 | 4,360 | 2.2 | 6,785 | 2.7 |
| Coal Contractor | 177 | 5.8 | 283 | 1.5 | 460 | 2.1 |
| Noncoal Contractor | 43 | 2.2 | 454 | 1.3 | 497 | 1.4 |
| Contractor Total | 220 | 4.4 | 737 | 1.4 | 957 | 1.7 |
| Total | 2,645 | 4.6 | 5,097 | 2.0 | 7,742 | 2.5 |
Data source: Publicly released data files of employment and accident/injury/illness collected by MSHA under 30 CFR 50.
Notes: All analyses of accident data exclude office employees. Occupational fatalities exclude all cases under 17 years of age. Further statistical methodology is available on the NIOSH Internet. Data in the above tables may not add to totals shown because of independent rounding. Caution should be used when interpreting rates based on a small number of events.
- Mines at which only independent contractors were working did not show any employment and were not counted.
- Average number of employees working at individual mines during calendar quarters of active operations (includes office workers).
- Full-time equivalent employees computed using reported employee hours (2,000 hours = 1 FTE).
- Mining sectors include coal operators, metal operators, nonmetal operators, stone operators, sand and gravel operators, coal contractors, and noncoal contractors.
- Surface work locations include surface operations at underground mines, surface operations (strip or open pit), auger, culm banks, dredge, independent shops and yards, and mills or preparation plants.
- Includes actual days away from work and/or days of restricted work activity. For permanently disabling injuries only, statutory days charged by MSHA were used if they exceeded the total lost workdays.
To receive NIOSH documents or more information about occupational safety and health topics, contact NIOSH at 1-800-CDC-INFO (1-800-232-4636), TTY: 1-888-232-6348, or visit NIOSH's Ask an Occupational Safety and Health Question page.
- Coal and metal/nonmetal mining facts - 2008
- Coal and Metal/Nonmetal Mining Facts - 2008 (HTML)
- Coal Contractor Mining Facts - 2001
- Coal Contractor Mining Facts - 2002
- Coal Contractor Mining Facts - 2003
- Coal Contractor Mining Facts - 2004
- Coal Contractor Mining Facts - 2005
- Coal Contractor Mining Facts - 2006
- Mining Fact Sheets
- Rib Falls: A Major Ground Control Issue