Birth Rates for U.S. Teenagers Reach Historic Lows for All Age and Ethnic Groups
- Key findings
- The U.S. teen birth rate declined 9 percent to reach a historic low in 2010.
- Fewer babies were born to teenagers in 2010 than in any year since the mid-1940s.
- Birth rates for ages 15–19 declined to historic lows in 2010 in all racial and ethnic groups, but disparities remain.
- If the 1991 birth rates prevailed, there would have been an estimated 3.4 million additional births to teenagers from 1992 through 2010.
- Teen birth rates declined in all but three states during 2007–2010.
- Birth rates for teenagers continue to vary significantly across states.
- Summary
- Definitions
- Data sources and methods
- About the authors
- References
- Suggested citation
NCHS Data Brief No. 89, April 2012
PDF Version (749 KB)
Brady E. Hamilton, Ph.D., and Stephanie J. Ventura, M.A.
Key findings
Data from the Natality Data File, National Vital Statistics System
- The U.S. teen birth rate declined 9 percent from 2009 to 2010, reaching a historic low at 34.3 births per 1,000 women aged 15–19; the rate dropped 44 percent from 1991 through 2010.
- Teen birth rates by age and race and Hispanic origin were lower in 2010 than ever reported in the United States.
- Fewer babies were born to teenagers in 2010 than in any year since 1946. If the teen birth rates observed in 1991 had not declined through 2010 as they did, there would have been an estimated 3.4 million additional births to teens during 1992–2010.
- Teen birth rates fell in all but three states during 2007–2010. Teen birth rates by state vary significantly, reflecting in part differences in the population composition of states by race and Hispanic origin.
Teen childbearing has been generally on a long-term decline in the United States since the late 1950s (1–3). In spite of these declines, the U.S. teen birth rate remains one of the highest among other industrialized countries (4). Moreover, childbearing by teenagers continues to be a matter of public concern because of the elevated health risks for teen mothers and their infants (5,6). In addition, significant public costs are associated with teen childbearing, estimated at $10.9 billion annually (7). The most current data available from the National Vital Statistics System (NVSS), the 2010 preliminary file, are used to illustrate the recent trends and variations in teen childbearing.
Keywords: teen births, race and Hispanic origin, state rates
The U.S. teen birth rate declined 9 percent to reach a historic low in 2010.
- The birth rate for U.S. teenagers fell 9 percent from 2009 to 2010, to 34.3, the lowest level ever reported in the seven decades for which a consistent series of rates is available (1,3) (Figure 1).
- The 2010 rate was 44 percent below the recent peak in 1991, and 64 percent lower than the all-time high level of 96.3 recorded during the baby boom year of 1957 (1).
- Birth rates fell from 2009 to 2010 for teenagers in age groups 10–14, 15–17, and 18–19. The rate for the youngest teenagers was a record low for the United States (0.4).
- The birth rate for teens aged 15–17 dropped 12 percent, from 19.6 per 1,000 in 2009 to 17.3 in 2010. The 2010 rate was less than one-half the level in 1991 (38.6).
- The rate for ages 18–19 dropped 9 percent, from 64.0 in 2009 to 58.3 in 2010.
Figure 1. Birth rates for women aged 15–19: United States, 1940–2010, and by age, 1960–2010

NOTE: Data for 2010 are preliminary.
SOURCE: CDC/NCHS, National Vital Statistics System.
Fewer babies were born to teenagers in 2010 than in any year since the mid-1940s.
- The number of babies born to women aged 15–19 was 367,752 in 2010, a 10-percent decline from 2009 (409,802), and the fewest reported in more than 60 years (322,380 in 1946) (1,3) (Figure 2).
- The 2010 total of births to teenagers was 43 percent lower than the peak recorded in 1970 (644,708).
Figure 2. Number of births for women aged 15–19: United States, 1940–2010
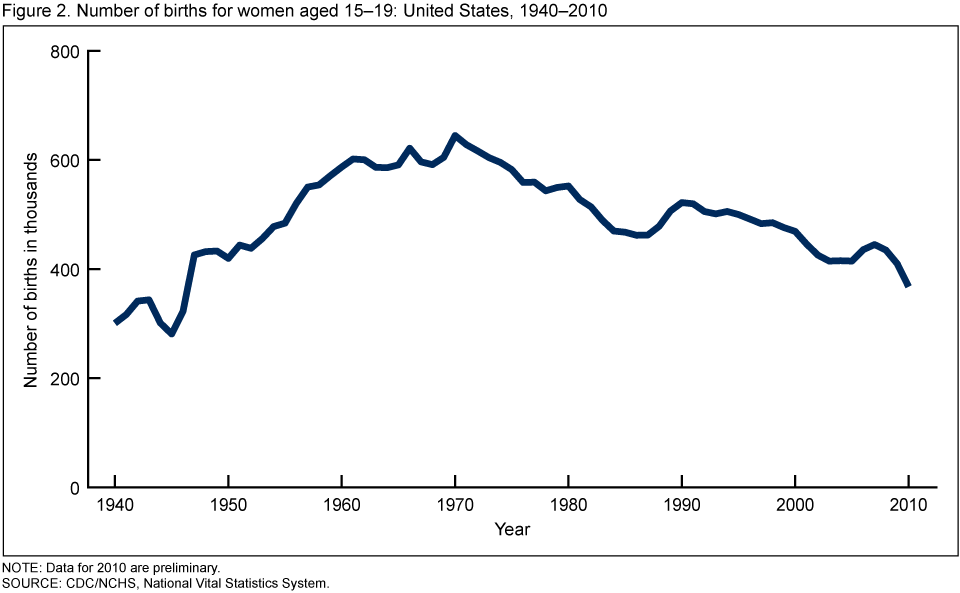
NOTE: Data for 2010 are preliminary.
SOURCE: CDC/NCHS, National Vital Statistics System.
Birth rates for ages 15–19 declined to historic lows in 2010 in all racial and ethnic groups, but disparities remain.
- Rates declined by 9 percent for non-Hispanic white and non-Hispanic black teenagers, by 12 percent for American Indian or Alaska Native (AIAN) and Hispanic teenagers, and by 13 percent for Asian or Pacific Islander (API) teenagers from 2009 to 2010 (3) (Figure 3).
- Rates in 2010 ranged from 10.9 per 1,000 API to 23.5 for non-Hispanic white teenagers, 38.7 for AIAN, 51.5 for non-Hispanic black, and 55.7 for Hispanic teenagers.
Figure 3. Birth rates for women aged 15–19, by race and Hispanic origin: United States, 1991, 2005, 2007, and 2010
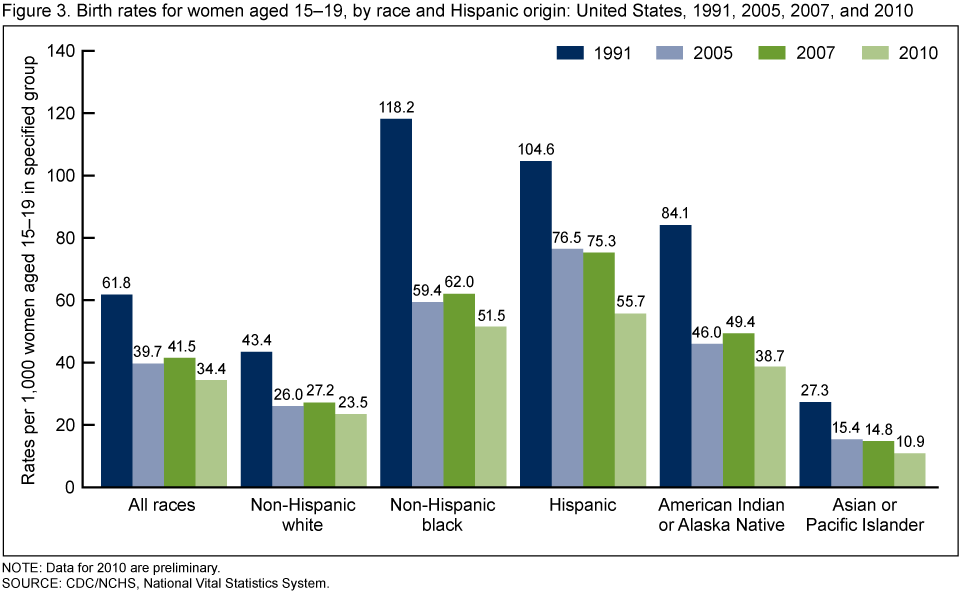
NOTE: Data for 2010 are preliminary.
SOURCE: CDC/NCHS, National Vital Statistics System.
If the 1991 birth rates prevailed, there would have been an estimated 3.4 million additional births to teenagers from 1992 through 2010.
- The impact of the decline in the teen birth rate on the number of births to teenagers over the nearly two-decade period, 1992–2010, is substantial. If the 1991 rates had continued to prevail from 1992 through 2010, there would have been an additional 3.4 million births to women aged 15–19 in the United States (with nearly 1 million of those additional births occurring between 2008 and 2010) (Figure 4).
- These estimated additional births also take into account the rise in the female teen population as well as changes in the female teen population composition during this period. From 1992 through 2010, the population of teenagers grew 28 percent overall, while the Hispanic teen population increased 110 percent. By comparison, the number of non-Hispanic white teenagers increased 8 percent and non-Hispanic black teenagers increased 37 percent.
Figure 4. Estimated cumulative number of additional births to women aged 15–19 from 1992 through 2010 for the United States if 1991 birth rates had continued

NOTE: Data for 2010 are preliminary.
SOURCE: CDC/NCHS, National Vital Statistics System.
Teen birth rates declined in all but three states during 2007–2010.
- Rates fell by at least 8 percent in 47 states and the District of Columbia. Declines in 16 states ranged from 20 percent to 29 percent (Figure 5).
- Rates did not change significantly in Montana, North Dakota, and West Virginia.
Figure 5. Change in birth rate for women aged 15–19, by state: United States, 2007–2010
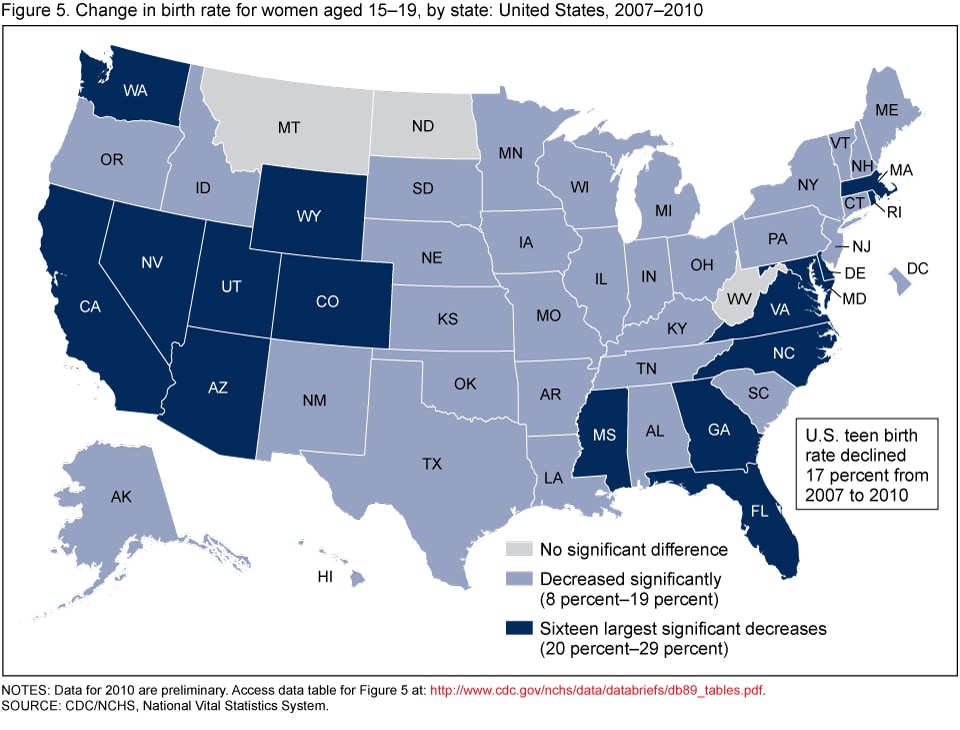
NOTES: Data for 2010 are preliminary. Access data table for Figure 5 [PDF- 175 KB].
SOURCE: CDC/NCHS, National Vital Statistics System.
Birth rates for teenagers continue to vary significantly across states.
- The birth rate for teenagers ranged from 15.7 in New Hampshire to 55.0 in Mississippi in 2010 (Figure 6).
- Rates tended to be highest in the South and Southwest and lowest in the Northeast and Upper Midwest, a pattern that has persisted for many years (1,8).
- Some of the variation across states reflects variation in population composition within states by race and Hispanic origin (data not shown) (1,8).
Figure 6. Birth rate for women aged 15–19, by state: United States, 2010
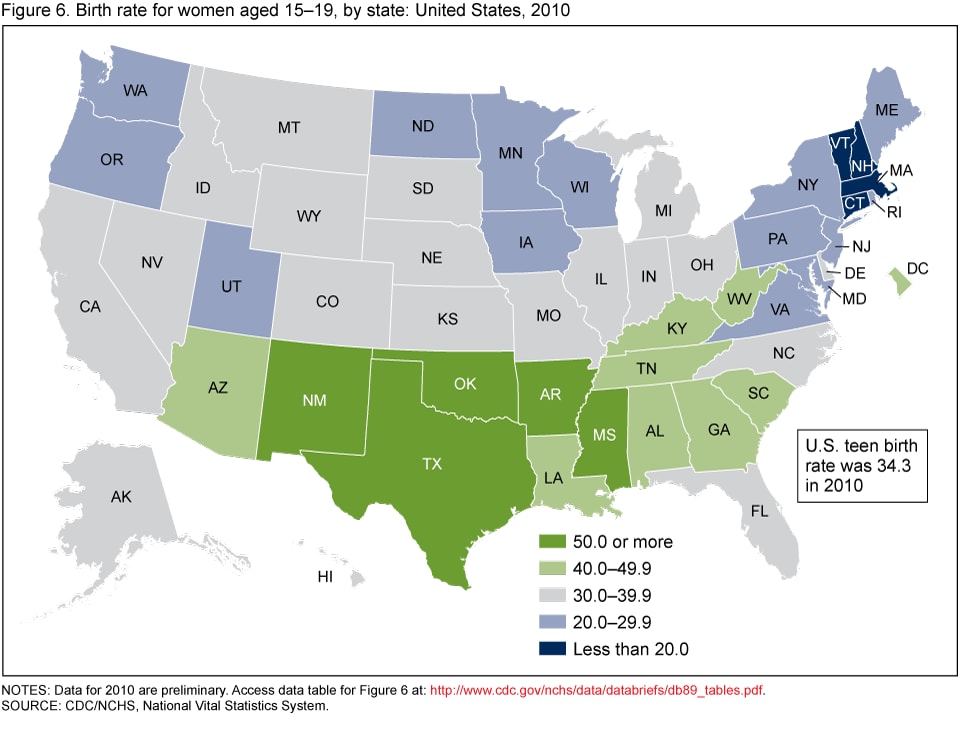
NOTES: Data for 2010 are preliminary. Access data table for Figure 6 [PDF -175 KB].
SOURCE: CDC/NCHS, National Vital Statistics System.
Summary
The widespread significant declines in teen childbearing that began after 1991 have strengthened in recent years. The teen birth rate dropped 17 percent from 2007 through 2010, a record low, and 44 percent from 1991. Rates fell across all teen age groups, racial and ethnic groups, and nearly all states. The drop in the U.S. rate has importantly affected the number of births to teenagers. If the 1991 rates had prevailed through the years 1992–2010, there would have been an estimated 3.4 million additional births to teenagers during that period.
The impact of strong pregnancy prevention messages directed to teenagers has been credited with the birth rate declines (9–11). Recently released data from the National Survey of Family Growth, conducted by the Centers for Disease Control and Prevention’s (CDC) National Center for Health Statistics (NCHS), have shown increased use of contraception at first initiation of sex and use of dual methods of contraception (that is, condoms and hormonal methods) among sexually active female and male teenagers. These trends may have contributed to the recent birth rate declines (12).
Definitions
Teen birth rate: The number of births to women aged 15–19 (or other teen age group) per 1,000 women aged 15–19 (or other teen age group).
Estimated additional teen births: The cumulative difference between the expected numbers of teen births based on the 1991 age-, race-, and Hispanic origin-specific rates prevailing from 1992 through 2010 and the observed numbers of teen births.
Data sources and methods
This report contains data from the NVSS Natality Data File. The vital statistics natality files include information for all births occurring in the United States. The natality files include information on a wide range of maternal and infant demographic and health characteristics for babies born in the United States. The natality files can be accessed on the Vital Statistics Data Available Online website. Data for 2009 and earlier years may also be accessed from the interactive data access tool, VitalStats.
Birth rates for teenagers for 2010 are based on preliminary birth data. Information on the 2010 data is available elsewhere (3). Population data for computing birth rates for 2010 were provided by the U.S. Census Bureau and are based on the April 1, 2010, census (13). Rates for 2001–2009 have been revised on the basis of population estimates based on the 2000 and 2010 censuses, to provide more accurate data for the years since 2000 (14,15). The revised rates may differ from the original rates published in “Births: Final Data for 2009” (5) and earlier reports, which were based on 2000 postcensal population estimates. See “Births: Preliminary Data for 2010” for more information on the revised rates and the differences between the originally published and revised rates (3). Rates by state shown here may differ from rates computed on the basis of other population estimates (1,<<a href=”#ref3″>3).
The additional number of teen births that would have been expected if the 1991 birth rates had continued from 1992 through 2010 was estimated by applying the 1991 teen birth rates by age, race, and Hispanic origin of mother to the estimated population of women for the same age, race, and Hispanic origin groups for each year from 1992 to 2010, summing the annual expected number, and subtracting the observed number of teen births for each year from 1992 to 2010.
About the authors
Brady E. Hamilton and Stephanie J. Ventura are with CDC’s NCHS, Division of Vital Statistics, Reproductive Statistics Branch.
References
- Ventura SJ, Mathews TJ, Hamilton BE. Births to teenagers in the United States, 1940–2000. National vital statistics reports; vol 49 no 10. Hyattsville, MD: National Center for Health Statistics. 2001.
- Ventura SJ, Hamilton BE. U.S. teenage birth rate resumes decline. NCHS data brief, no 58. Hyattsville, MD: National Center for Health Statistics. 2011.
- Hamilton BE, Martin JA, Ventura SJ. Births: Preliminary data for 2010. National vital statistics reports; vol 60 no 2. Hyattsville, MD: National Center for Health Statistics. 2011.
- United Nations Statistics Division. Demographic yearbook 2009–2010. New York, NY: United Nations. 2011.
- Martin JA, Hamilton BE, Ventura SJ, et al. Births: Final data for 2009. National vital statistics reports; vol 60 no 1. Hyattsville, MD: National Center for Health Statistics. 2011.
- Mathews TJ, MacDorman MF. Infant mortality statistics from the 2007 period linked birth/infant death data set. National vital statistics reports; vol 59 no 6. Hyattsville, MD: National Center for Health Statistics. 2011.
- The National Campaign to Prevent Teen and Unplanned Pregnancy. Counting it up: The public costs of teen childbearing: Key data [PDF 176 KB]. Washington, DC: The National Campaign to Prevent Teen and Unplanned Pregnancy. [Accessed 12/28/11].
- Mathews TJ, Sutton PD, Hamilton BE, Ventura SJ. State disparities in teenage birth rates in the United States. NCHS data brief, no 46. Hyattsville, MD: National Center for Health Statistics. 2010.
- The National Campaign to Prevent Teen and Unplanned Pregnancy. National data. Washington, DC: The National Campaign to Prevent Teen Pregnancy. [Accessed 11/28/10].
- Kirby D. Emerging answers 2007: Research findings on programs to reduce teen pregnancy and sexually transmitted diseases. Washington, DC: The National Campaign to Prevent Teen and Unplanned Pregnancy. 2007.
- Oringanje C, Meremikwu MM, Eko H, Esu E, Meremikwu A, Ehiri JE. Interventions for preventing unintended pregnancies among adolescents. Cochrane Database Syst Rev (4):CD005215. 2009.
- Martinez G, Copen CE, Abma JC. Teenagers in the United States: Sexual activity, contraceptive use, and childbearing, 2006–2010 National Survey of Family Growth. National Center for Health Statistics. Vital Health Stat 23(31). 2011.
- National Center for Health Statistics. Estimates of the April 1, 2010 resident population of the United States, by county, single-year of age (0, 1, 2, …, 85 years and over), bridged race, Hispanic origin, and sex. 2011.
- National Center for Health Statistics. Intercensal estimates of the resident population of the United States for July 1, 2000–July 1, 2009, by year, single-year of age (0, 1, 2, …, 85 years and over), bridged race, Hispanic origin, and sex. 2011.
- National Center for Health Statistics. Intercensal estimates of the resident population of the United States for July 1, 2000–July 1, 2009, by year, state, 5-year age group (0–4, 5–9, …, 85 years and over), bridged race, Hispanic origin, and sex. 2011.
Suggested citation
Hamilton BE, Ventura SJ. Birth rates for U.S. teenagers reach historic lows for all age and ethnic groups. NCHS data brief, no 89. Hyattsville, MD: National Center for Health Statistics. 2012.
Copyright information
All material appearing in this report is in the public domain and may be reproduced or copied without permission; citation as to source, however, is appreciated.
National Center for Health Statistics
Edward J. Sondik, Ph.D., Director
Jennifer H. Madans, Ph.D., Associate Director for Science
Division of Vital Statistics
Charles J. Rothwell, M.S., Director