Consumption of Added Sugar Among U.S. Children and Adolescents, 2005–2008
- Key findings
- Are there differences in the mean number of calories consumed from added sugars by boys and girls and by age group?
- Are there differences in the percent of calories consumed from added sugars by age group?
- Are there differences in the percent of calories consumed from added sugars by race and ethnicity?
- Are there differences in the percent of calories consumed from added sugars by poverty income ratio?
- Were children and adolescents more likely to consume the added sugars from foods and beverages at home or away from home?
- Summary
- Definitions
- Data source and methods
- About the authors
- References
- Suggested citation
NCHS Data Brief No. 87, February 2012
PDF Version (518 KB)
R. Bethene Ervin, Ph.D., R.D.; Brian K. Kit, M.D., M.P.H.; Margaret D. Carroll, M.S.P.H.; and Cynthia L. Ogden, Ph.D., M.R.P.
Key findings
Data from the National Health and Nutrition Examination Survey, 2005–2008
- Non-Hispanic white children and adolescents consume a larger percent of their calories from added sugars than do Mexican-American children and adolescents.
- There was no difference in consumption of added sugars by income among children and adolescents.
- More added sugars calories came from foods rather than beverages.
- More added sugars calories were consumed at home rather than away from home.
The consumption of added sugars, which are sweeteners added to processed and prepared foods, has been associated with measures of cardiovascular disease risk among adolescents, including adverse cholesterol concentrations (1). Although the percent of daily calories derived from added sugars declined between 1999–2000 and 2007–2008 (2), consumption of added sugars remains high in the diets of Americans. The 2010 Dietary Guidelines recommend limiting total intake of discretionary calories, which include added sugars and solid fats, to 5%–15% of daily caloric intake (3), yet many Americans continue to exceed these recommendations (2). This data brief presents results for added sugar consumption among U.S. children and adolescents for 2005–2008.
Keywords: calories, income, National Health and Nutrition Examination Survey
Are there differences in the mean number of calories consumed from added sugars by boys and girls and by age group?
Boys consumed more calories per day from added sugars than girls. Boys consumed an average of 362 kilocalories (kcals) from added sugars compared with 282 kcals for girls (Figure 1). Caloric intake from added sugars increased linearly with age for boys and girls. Preschool-aged boys (2–5 years) consumed an average of 218 kcals from added sugars, school-aged boys (6–11 years) consumed an average of 345 kcals from added sugars, and adolescent boys (12–19 years) consumed an average of 442 kcals from added sugars. Preschool-aged girls (2–5 years) consumed an average of 196 kcals from added sugars, school-aged girls (6–11 years) consumed 293 kcals from added sugars, and adolescent girls (12–19 years) consumed 314 kcals from added sugars.
Figure 1. Mean kilocalories from added sugars among children and adolescents aged 2–19 years, by sex and age group: United States, 2005–2008
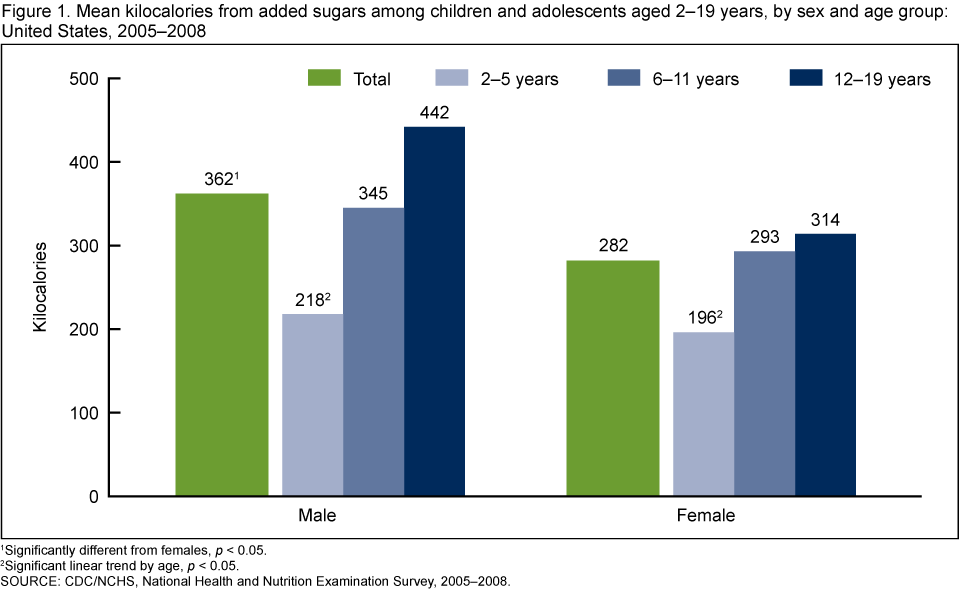
1 Significantly different from females, p < 0.05.
2 Significant linear trend by age, p < 0.05.
SOURCE: CDC/NCHS, National Health and Nutrition Examination Survey, 2005–2008.
Are there differences in the percent of calories consumed from added sugars by age group?
There was a small but significant difference in the percent of calories from added sugars between boys and girls. Boys consumed an average of 16.3% of their calories from added sugars, while girls consumed an average of 15.5% of their calories from added sugars (Figure 2). The percent of calories contributed by added sugars increased linearly with age for boys and girls (Figure 2). Preschool-aged boys consumed 13.5% of their calories from added sugars, 6–11 year-olds consumed 16.6% of their calories from added sugars, and 12–19 year-olds consumed 17.5% of their calories from added sugars. Preschool-aged girls consumed 13.1% of their calories from added sugars, 6–11 year-olds consumed 15.7% of their calories from added sugars, and 12–19 year-olds consumed 16.6% of their calories from added sugars.
Figure 2. Mean percent of kilocalories from added sugars among children and adolescents aged 2–19 years, by sex and age group: United States, 2005–2008
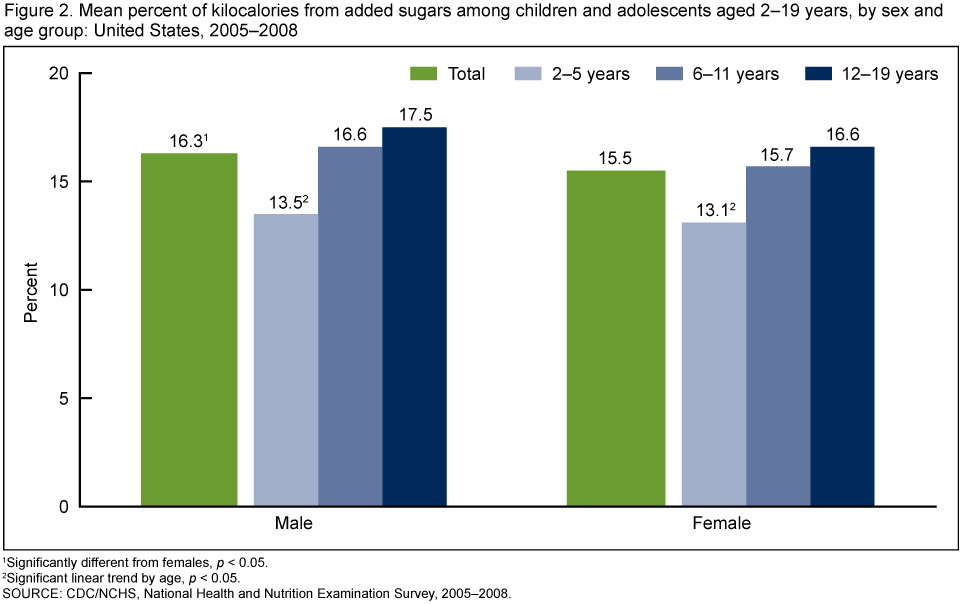
1 Significantly different from females, p < 0.05.
2 Significant linear trend by age, p < 0.05.
SOURCE: CDC/NCHS, National Health and Nutrition Examination Survey, 2005–2008.
Are there differences in the percent of calories consumed from added sugars by race and ethnicity?
Non-Hispanic white boys consumed a larger percent of their total calories from added sugars than Mexican-American boys (Figure 3). The percent of calories consumed by non-Hispanic black boys fell in between these two groups, but was not significantly different from either of them. Non-Hispanic white and non-Hispanic black girls consumed larger percents of their total calories from added sugars than Mexican-American girls, but there were no significant differences between non-Hispanic white and non-Hispanic black girls.
Figure 3. Mean percent of kilocalories from added sugars among children and adolescents aged 2–19 years, by sex and race and ethnicity: United States, 2005–2008
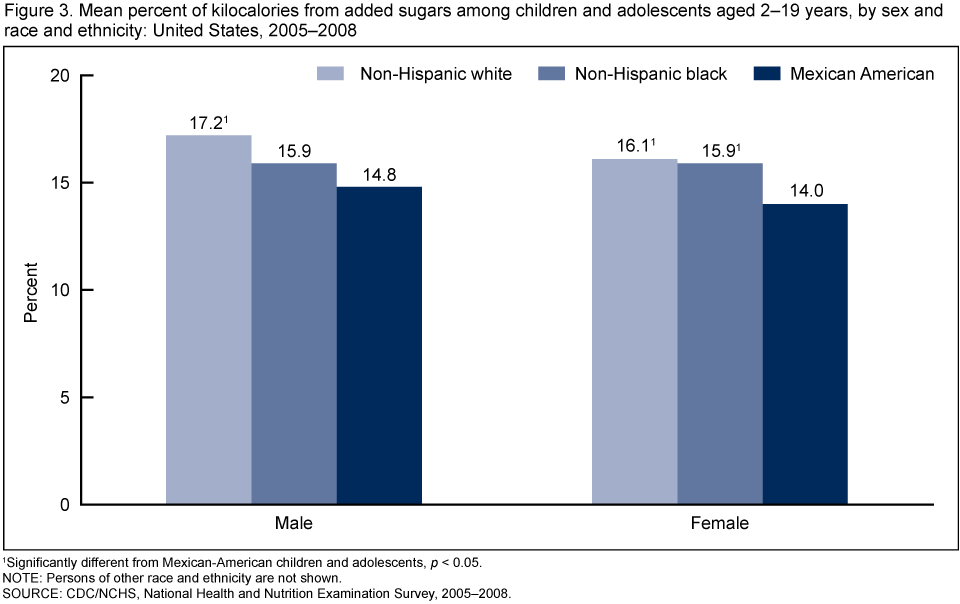
1 Significantly different from Mexican-American children and adolescents, p < 0.05.
NOTE: Persons of other race and ethnicity are not shown.
SOURCE: CDC/NCHS, National Health and Nutrition Examination Survey, 2005–2008.
Are there differences in the percent of calories consumed from added sugars by poverty income ratio?
There were no significant differences in the percent of total calories from added sugars based on poverty income ratio (PIR) either for boys or girls (Figure 4). The percent of calories for the three PIR groups ranged from 16.1% to 16.8% for boys and 15.2% to 15.9% for girls.
Figure 4. Mean percent of kilocalories from added sugars among children and adolescents aged 2–19 years, by poverty income ratio: United States, 2005–2008
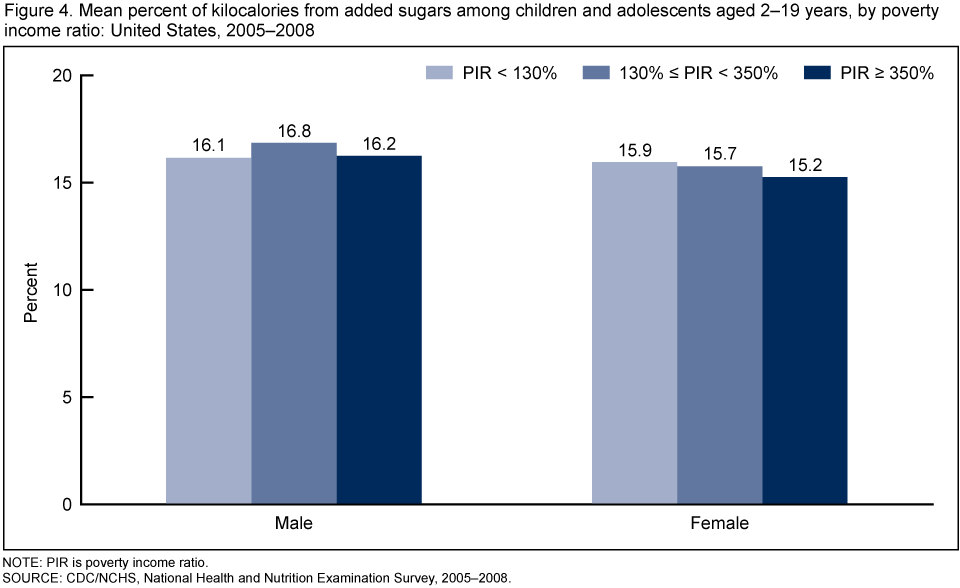
NOTE: PIR is poverty income ratio.
SOURCE: CDC/NCHS, National Health and Nutrition Examination Survey, 2005–2008.
Were children and adolescents more likely to consume the added sugars from foods and beverages at home or away from home?
Foods contributed significantly more of the added sugar calories than beverages (data not shown in figure). Fifty-nine percent of added sugars calories came from foods compared with 41% that came from beverages. More of the added sugars calories were consumed at home rather than away from home for both beverages and foods. These results are consistent with results for total caloric intakes. That is, 65% of the total calories that children and adolescents consumed were consumed at home. The remainder was consumed away from home. Slightly more than one-half of the added sugars calories from beverages were consumed at home (54%), while nearly two-thirds of the added sugars consumed from foods were consumed at home (66%) (Figure 5).
Figure 5. Percentage of kilocalories from added sugars among children and adolescents aged 2–19 years, by type of food and location food was consumed: United States, 2005–2008
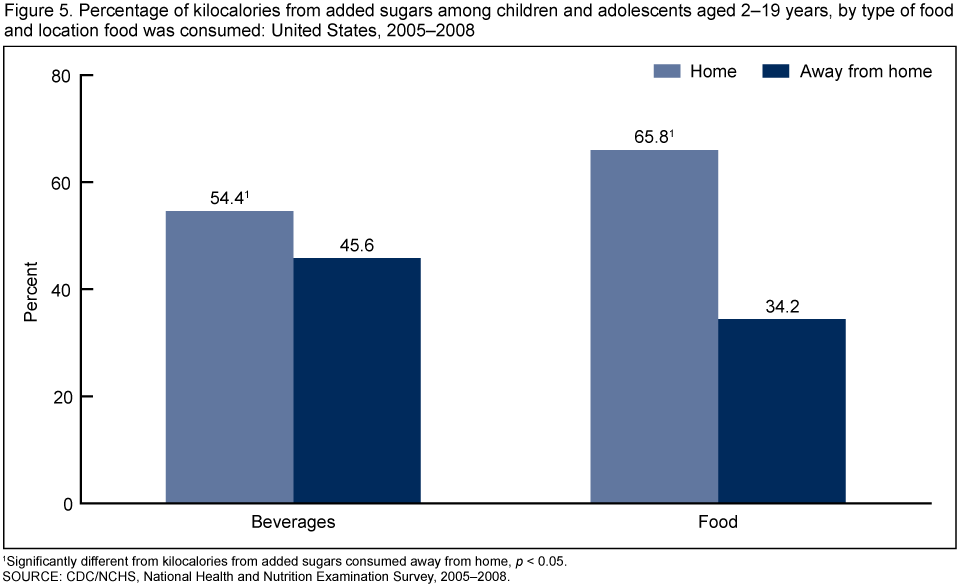
1Significantly different from kilocalories from added sugars consumed away from home, p < 0.05.
SOURCE: CDC/NCHS, National Health and Nutrition Examination Survey, 2005–2008.
Summary
Approximately 16% of children and adolescents’ total caloric intakes came from added sugars. Boys consumed more added sugars than girls. Preschool-aged children consumed the fewest calories from added sugars. Although girls consumed a smaller absolute amount of calories from added sugars than boys, their intakes were not that different from boys when the amounts are expressed as a percentage of total caloric intakes.
Non-Hispanic white children and adolescents consumed a larger percentage of their calories from added sugars than Mexican-American children and adolescents. Also, Non-Hispanic black girls consumed a larger percentage of their calories from added sugars than Mexican-American girls. There was very little difference in added sugar consumption based on PIR.
More of the added sugars calories came from foods as opposed to beverages. Previous research has demonstrated that sodas are the single leading food source of added sugars intakes among children, adolescents, and adults (2,4). Our results showed a little more than 40% of calories from added sugars came from beverages. Poti and Popkin (5) have suggested that eating location impacts daily energy intake in children and adolescents and that foods prepared away from home, are contributing to their increased total energy intake. Our results showed that more of the added sugars calories were consumed at home rather than away from home.
A substantial percentage of calories in the diets of children and adolescents between 2005 and 2008 came from added sugars. According to the 2010 Dietary Guidelines “reducing the consumption of these sources of added sugars will lower the caloric content of the diet, without compromising its nutrient adequacy (3).” This strategy could play an important role in reducing the high prevalence of obesity in the United States (6) without compromising adequate nutrition.
Definitions
Calories versus kilocalories: A calorie is a measure of the energy produced as foods or beverages are burned for energy in the body. The term calorie is usually used when discussing energy from foods and diets, but the calorie being referred to is actually a kilocalorie (7). In this paper the term calorie actually refers to kilocalorie. Calories from added sugars represent the energy from added sugars. Percentage of daily calories from added sugars represents the percentage of total daily energy obtained from added sugars.
Added sugars: Added sugars [PDF – 348 KB] include all sugars used as ingredients in processed and prepared foods such as breads, cakes, soft drinks, jams, chocolates, ice cream, and sugars eaten separately or added to foods at the table. Examples of added sugars include white sugar, brown sugar, raw sugar, corn syrup, corn syrup solids, high fructose corn syrup, malt syrup, maple syrup, pancake syrup, fructose sweetener, liquid fructose, honey, molasses, anhydrous dextrose, crystal dextrose, and dextrin.
Type of food consumed: A measure indicating whether the source of the added sugar was a food or beverage. Beverages included milk and milk substitutes, sugar drinks (fruit drinks, sodas, energy and sports drinks, and sweetened bottled water), fruit juices, nectars, vegetable juices, coffee, tea, and alcoholic beverages. Foods included anything that was not classified as a beverage.
Location of added sugar consumption: Respondents to the 24-hour dietary recall interview were asked where each reported food or beverage was consumed—at home or away from home.
Poverty income ratio (PIR): A measure representing the ratio of household income to the poverty threshold after accounting for inflation and family size. In 2008, a PIR of 350% was equivalent to approximately $77,000 for a family of four; a PIR of 130% was equivalent to approximately $29,000 for a family of four. In 2008, median household income was approximately $50,000 and 13.2% of the population lived below the poverty level, based on U.S. Census Bureau data. The cut point for participation in the Supplemental Nutrition Assistance Program (SNAP) is 130% of the poverty level.
Data source and methods
Data from the National Health and Nutrition Examination Survey (NHANES) were used for these analyses. NHANES is a cross-sectional survey designed to monitor the health and nutritional status of the civilian, noninstitutionalized U.S. population (8). The survey consists of interviews conducted in participants’ homes, standardized physical examinations in mobile examination centers (MEC), and laboratory tests utilizing blood and urine specimens provided by participants during the physical examination. Dietary information for this analysis was obtained via an in-person 24-hour dietary recall interview in the MEC.
The NHANES sample is selected through a complex, multistage design that includes selection of primary sampling units (counties), household segments within the counties, households within segments and, finally, sample persons from selected households. The sample design includes oversampling to obtain reliable estimates of health and nutritional measures for population subgroups. In 2005–2006, African-American and Mexican-American subgroups were oversampled. In 2007–2008 African-American subgroups and overall Latino subgroups were oversampled, with sufficient sample sizes for analysis of Mexican-American subgroups. In 1999, NHANES became a continuous survey, fielded on an ongoing basis. Each year of data collection is based on a representative sample covering all ages of the civilian, noninstitutionalized population. Public-use data files are released in 2-year cycles.
Sample weights, which account for the differential probabilities of selection, nonresponse, and noncoverage, were incorporated into the estimation process. The standard errors of the percentages were estimated using Taylor Series Linearization, a method that incorporates the sample weights and sample design.
Differences between groups were evaluated using a t-statistic at the p < 0.05 significance level. Test for trends by age were evaluated using linear regression and the significance level was set at p < 0.05. All differences reported are statistically significant unless otherwise indicated. Statistical analyses were conducted using the SAS System for Windows (release 9.2; SAS Institute Inc, Cary, N.C.) and SUDAAN (release 10.0; Research Triangle Institute, Research Triangle Park, N.C.).
About the authors
Bethene Ervin, Brian K. Kit, Margaret D. Carroll, and Cynthia L. Ogden work at the Centers for Disease Control and Prevention’s National Center for Health Statistics, Division of Health and Nutrition Examination Surveys.
References
- Welsh JA, Sharma A, Cunningham SA, Vos MB. Consumption of added sugars and indicators of cardiovascular disease risk among U.S. adolescents. Circulation 123(3):249–57. 2011.
- Welsh JA, Sharma AJ, Grellinger L, Vos MB. Consumption of added sugars is decreasing in the United States. Am J Clin Nutr 94(3):726–34. 2011.
- U.S. Department of Agriculture and U.S. Department of Health and Human Services. Dietary guidelines for Americans, 2010. 7th ed. Washington, DC: U.S. Government Printing Office. 2010.
- Reedy J, Krebs-Smith SM. Dietary sources of energy, solid fats, and added sugars among children and adolescents in the United States. J Am Diet Assoc 110(10):1477–84. 2010.
- Poti JM, Popkin BM. Trends in energy intake among U.S. children by eating location and food source, 1997–2006. JADA 111:1156–64. 2011.
- Ogden CL, Carroll MD, Curtin LR, Lamb MM, Flegal KM. Prevalence of high body mass index in U.S. children and adolescents, 2007–2008. JAMA 303:242–9. 2010.
- Energy. In: Food, nutrition & diet therapy. 7th ed. Krause MV, Mahan LK (editors). 9–23. Philadelphia, PA: WB Saunders Company. 1984.
- National Center for Health Statistics. National Health and Nutrition Examination Survey. Questionnaires, datasets, and related documentation.
Suggested citation
Ervin RB, Kit BK, Carroll MD, Ogden CL. Consumption of added sugar among U.S. children and adolescents, 2005–2008. NCHS data brief no 87. Hyattsville, MD: National Center for Health Statistics. 2012.
Copyright information
All material appearing in this report is in the public domain and may be reproduced or copied without permission; citation as to source, however, is appreciated.
National Center for Health Statistics
Edward J. Sondik, Ph.D., Director
Jennifer H. Madans, Ph.D., Associate Director for Science
Division of Health and Nutrition Examination Surveys
Clifford L. Johnson, M.S.P.H., Director