Health Care Utilization Among Adults Aged 55–64 Years: How Has It Changed Over the Past 10 Years?
- Key findings
- Between 1996 and 2006, for persons aged 55–64 years, ambulatory visit rates of all types increased.
- Over the same period, use of ultrasound or MRI/CT/PET scans by those aged 55–64 years increased substantially in ambulatory settings.
- The percentage of physician office and OPD visits for 55–64 year-olds in which drugs were prescribed also grew, with major increases in the share of visits with multiple drugs prescribed.
- The share of adults aged 55–64 years who used multiple prescription drugs in the month before interview was much higher in 2003–2006 than in 1988–1994.
- Between 1996 and 2006, rates for some types of inpatient procedures increased for 55–64 year-olds, while others remained steady or declined.
- The growth of ambulatory surgery between 1994–1996 and 2006 for 55–64 year-olds was particularly pronounced for certain procedures.
- Summary
- Definition
- Data sources and methods
- About the authors
- References
- Suggested Citation
NCHS Data Brief No. 32, March 2010
PDF Version (1.1 MB)
Virginia M. Freid, M.S., and Amy B. Bernstein, Sc.D.
Key findings
- The percentage of physician office and hospital outpatient department (OPD) visits during which an MRI/CT/PET scan was ordered doubled, to 4%, and the percentage of hospital emergency department visits with an MRI/CT scan more than tripled, to 16%.
- The percentage of physician office and OPD visits with at least five drugs prescribed more than doubled, to 25%.
- Inpatient hospitalization rates were similar in 2006 and 1996, but the types of procedures and surgeries performed have changed. Hospitalization rates for coronary artery stent insertions, hip replacements, and knee replacements rose sharply, while rates for some other procedures declined.
- Ambulatory surgery visit rates were almost twice as high in 2006 as in 1994–1996, and for some types of ambulatory procedures, such as colonoscopies, the increase was even greater.
Between ages 55 and 64, chronic illnesses become more common and the use of ambulatory and inpatient health care increases, compared with younger ages (1). This segment of the population is projected to grow rapidly during the next 10 years, driven by the aging of the baby boom generation (2). The current group of persons aged 55–64 years differs in health status and prevalence of disease risk factors from past cohorts of adults aged 55–64. Adults aged 55–64 in 2006 were more likely to be obese and hypertensive than their counterparts about a decade earlier (1), but both cohorts were equally likely to exercise regularly, and the 2006 cohort was slightly less likely to smoke cigarettes (3). Because of continuing advances in medicine, the 2006 cohort has had more opportunity to utilize drugs, tests, imaging, procedures, and surgeries than its 1996 counterpart. This brief examines how health care utilization has changed for persons aged 55–64—a group that is about to enter the Medicare program and that has been a recent focus of the health care policy debate. Examining the utilization patterns for this large and growing group may provide insight into policy debates and into future health care utilization by Medicare beneficiaries.
Keywords: medical technology, ambulatory, inpatient
Between 1996 and 2006, for persons aged 55–64 years, ambulatory visit rates of all types increased.
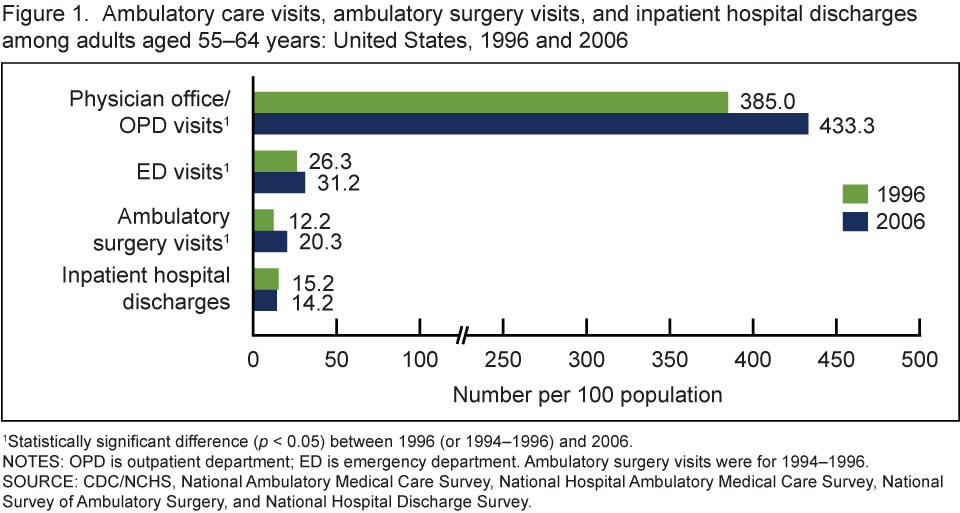
- Physician office and hospital outpatient department (OPD) visit rates were 13% higher in 2006 than in 1996 (Figure 1).
- Hospital emergency department (ED) visit rates were 19% higher in 2006 than in 1996.
- Ambulatory surgery visit rates were 66% higher in 2006 than in 1994–1996.
- Inpatient hospitalization rates were similar in 2006 and 1996.
Over the same period, use of ultrasound or MRI/CT/PET scans by those aged 55–64 years increased substantially in ambulatory settings.
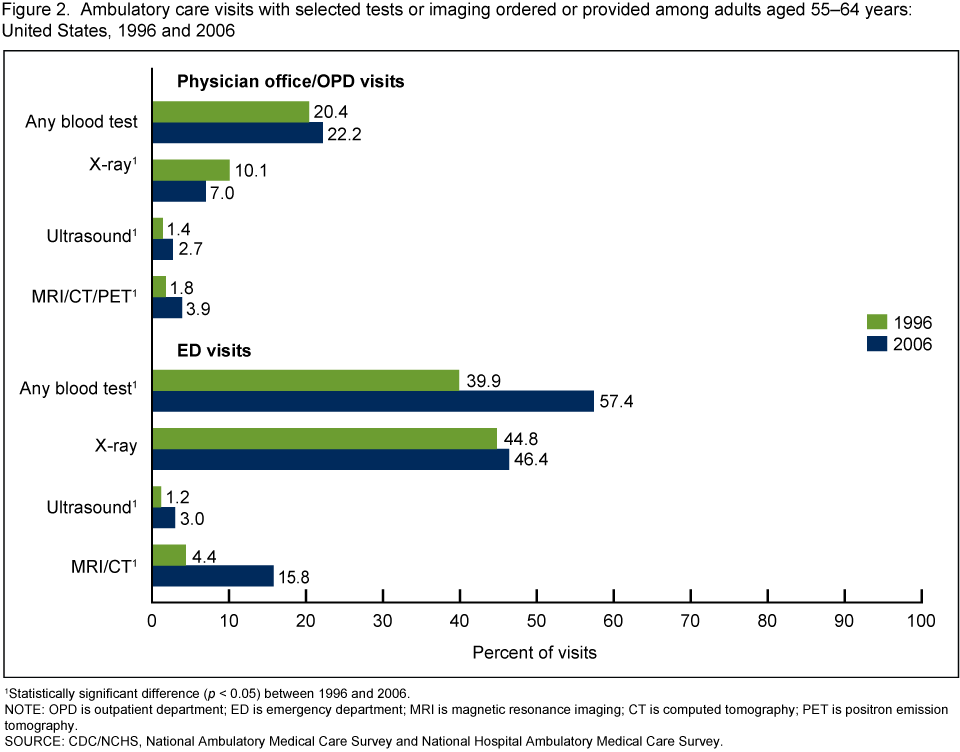
- The percentage of physician office and OPD visits with an ultrasound or a magnetic resonance imaging (MRI)/computed tomography (CT)/positron emission tomography (PET) scan ordered or provided during the visit was higher in 2006 than in 1996, while the percentage of these visits with an x-ray ordered or provided during the visit was lower (Figure 2)
- A greater percentage of ED visits had a blood test, ultrasound, or MRI/CT scan ordered or provided during visits in 2006 than in 1996.
The percentage of physician office and OPD visits for 55–64 year-olds in which drugs were prescribed also grew, with major increases in the share of visits with multiple drugs prescribed.
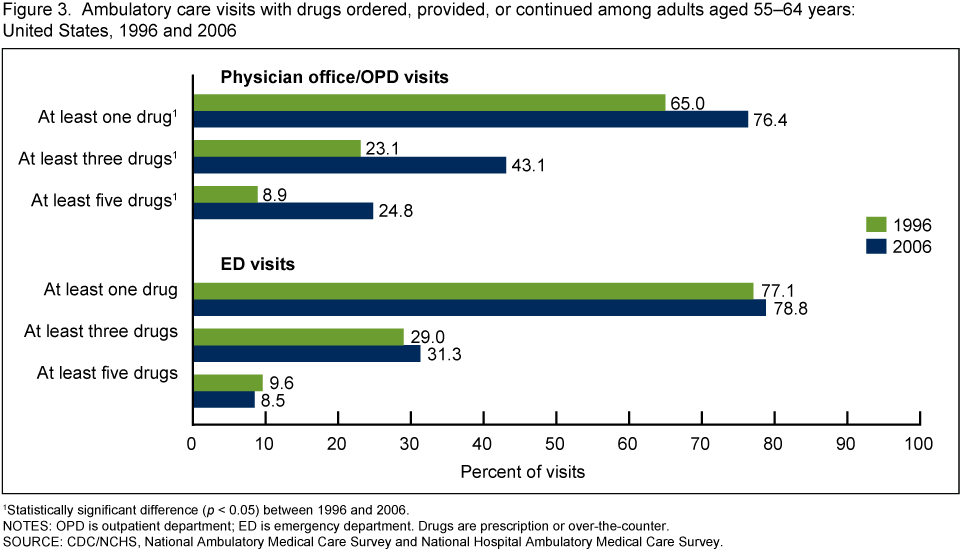
- The percentage of physician office and OPD visits with at least one drug ordered, provided, or continued during the visit was 18% higher in 2006 than in 1996. The percentage with at least three drugs recorded during the visit was nearly twice as high in 2006; and the percentage with at least five drugs recorded was nearly three times as high (Figure 3).
- In contrast, the percentage of visits to EDs with at least one, at least three, or at least five drugs ordered, provided, or continued during the visit was similar in 2006 and 1996.
The share of adults aged 55–64 years who used multiple prescription drugs in the month before interview was much higher in 2003–2006 than in 1988–1994.
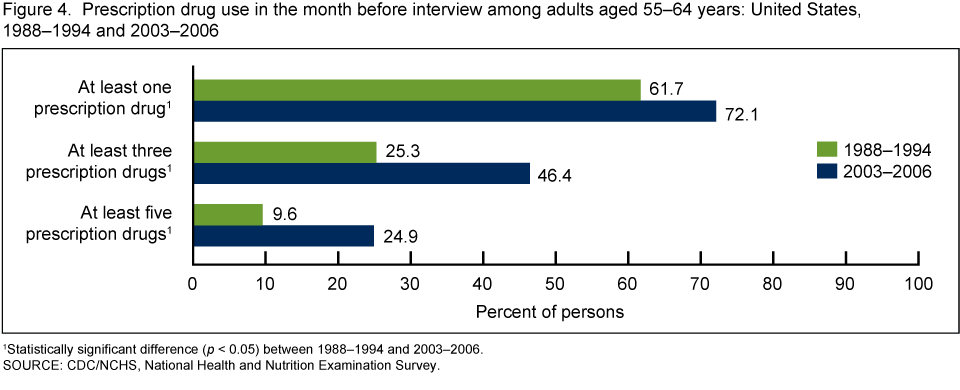
- The percentage of adults with any prescription drug use in the month before interview was 17% higher in 2003–2006 than in 1988–1994. The percentage with at least three prescription drugs was nearly twice as high, and the percentage with at least five prescription drugs was more than twice as high (Figure 4).
Between 1996 and 2006, rates for some types of inpatient procedures increased for 55–64 year-olds, while others remained steady or declined.
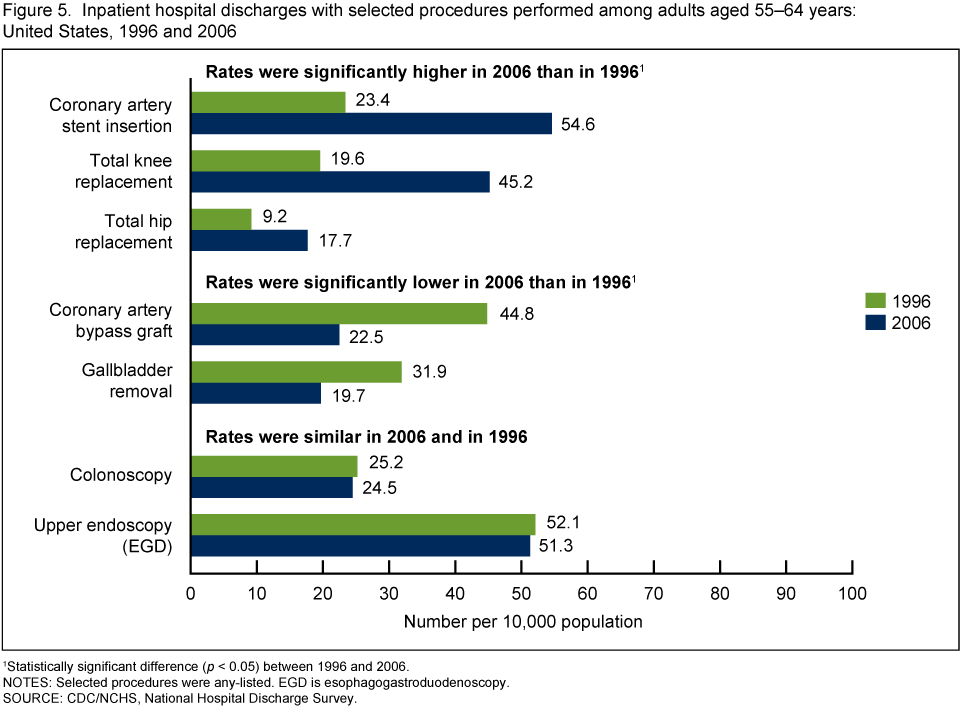
- Inpatient hospitalization rates were about twice as high for coronary artery stent insertions, total knee replacements, and total hip replacements in 2006 as in 1996 (Figure 5).
- Inpatient hospitalization rates were lower for coronary artery bypass surgery and gallbladder removal in 2006 than in 1996.
- Inpatient hospitalization rates were similar in 2006 and 1996 for colonoscopies and upper endoscopies.
The growth of ambulatory surgery between 1994–1996 and 2006 for 55–64 year-olds was particularly pronounced for certain procedures.
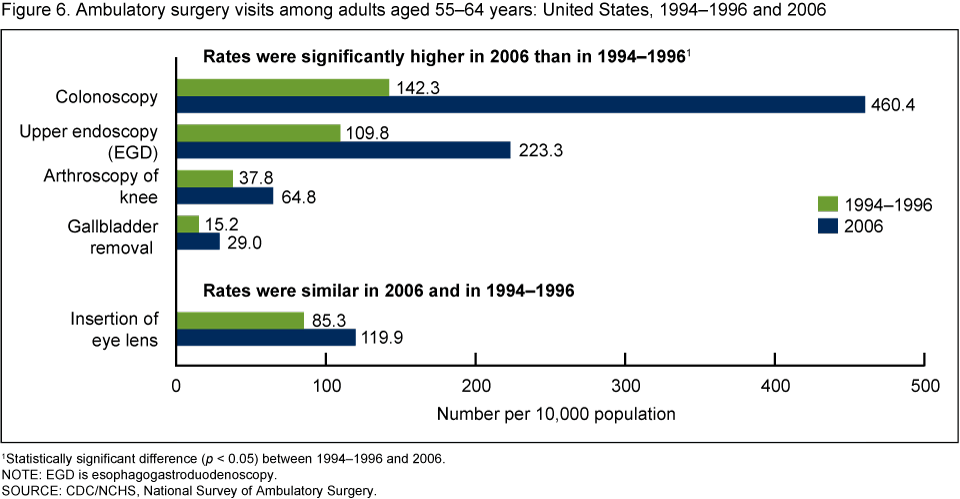
- Ambulatory surgery visit rates for colonoscopies tripled between 1994–1996 and 2006 (Figure 6).
- Ambulatory surgery visit rates for upper endoscopies and gallbladder removals doubled between 1994–1996 and 2006.
- Knee arthroscopy rates performed in ambulatory surgery centers increased 71% during this time period.
Summary
Over a relatively short period, from 1996 through 2006, utilization of ambulatory services among adults aged 55–64 years increased significantly. During this period, physician office and OPD visits became more “medication intensive,” with a greater percentage of these visits involving the prescription and management of drugs—in many cases multiple drugs. Utilization of advanced imaging technologies also increased for this age group. The percentage of physician office and OPD visits during which an MRI/CT/PET scan or ultrasound was ordered or provided grew, while the percentage of these visits ordering or providing x-rays declined. ED visits were more than three times as likely to include advanced imaging scans such as MRI/CT in 2006.
The overall hospital discharge rate was unchanged during the period examined, although the hospital days of care rate declined, reflecting shorter average lengths of stay (1). The types of inpatient procedures performed also differed. Some inpatient procedure rates declined because newer procedures were being substituted for older ones (e.g., coronary artery stent insertions replacing coronary artery bypass surgery) (4). Other types of inpatient procedure rates declined because the procedures shifted from inpatient to outpatient settings (e.g., gallbladder removal) (5). In contrast, several types of inpatient procedures demonstrated substantial growth over the 10-year period because of technological improvements that made the procedures easier to perform, with shorter recovery periods and more successful outcomes (e.g., total knee replacements and total hip replacements) (6,7).
Trends in health care utilization among those aged 55–64 years reflect a general trend in the increasing use of ambulatory care, newer technologies, imaging, procedures, and drugs (1). A similar shift to greater use of ambulatory care has been reported for care for chronic conditions (8). In one decade, the shift of the locus of care from inpatient to ambulatory settings has been dramatic. These findings demonstrate the rapid evolution of the health care system, which has affected the care received by persons aged 55–64, as well as those in other age groups.
Definition
Procedures: Defined based on the following International Classification of Diseases, Ninth Revision, Clinical Modification (ICD–9–CM) codes:
- Coronary artery stent insertion: 36.06, 36.07
- Total knee replacement: 81.54
- Total hip replacement: 81.51
- CT/MRI scans: 87.03, 87.41, 87.71, 88.01, 88.38, 88.91–88.97
- Coronary artery bypass graft: 36.1
- Gallbladder removal: 51.2
- Colonoscopy: 45.23, 45.25
- Upper endoscopy or esophagogastroduodenoscopy (EGD): 45.13, 45.16
- Knee arthroscopy: 80.26
- Insertion of eye lens: 13.7
Data sources and methods
Estimates in this brief are based on data from five national surveys conducted by the National Center for Health Statistics:
- National Hospital Discharge Survey (NHDS) data were used to estimate inpatient hospitalizations. NHDS collects information from a national sample of inpatient stays in nonfederal, short-stay hospitals in the United States. Patient information is collected from medical records and automated data files and includes demographics, length of stay, diagnoses, and up to four procedures. Any-listed procedure rates count a specific procedure only once, regardless of the number of times it was performed. For more information, visit the NHDS website.
- National Ambulatory Medical Care Survey (NAMCS) data were used to estimate physician office visits. NAMCS collects information from a national sample of visits to office-based physicians in the United States. Patient information is collected from medical records and includes diagnoses; number of drugs (over-the-counter and prescription) ordered, provided, or continued during the visit; and selected procedures and tests ordered or performed during the visit. Data on scans ordered or performed during the office visit were collected using checkboxes and a write-in procedure field. In 1996, there were separate checkboxes for MRI and CT scans; in 2006, there was a combined checkbox for MRI, CT, and PET scans. Some of the increase in advanced imaging scans noted during the period examined is due to improved questionnaire design and editing procedures that better captured PET scans. Data for physician office visits were combined with data from OPDs to provide a summary measure of ambulatory care utilization. For more information, visit the Ambulatory Health Care Data website.
- National Hospital Ambulatory Medical Care Survey (NHAMCS) data were used to estimate OPD and ED visits. NHAMCS collects information from a national sample of visits to OPDs and EDs. Patient information is collected from medical records and includes diagnoses; number of drugs (over-the-counter and prescription) ordered, provided, or continued during the visit; and selected procedures and tests ordered or performed during the visit. In OPD settings, data on scans ordered or performed during the visit were collected using checkboxes and a write-in procedure field. In 1996, there were separate checkboxes for MRI and CT scans; in 2006, there was a combined checkbox for MRI, CT, and PET scans. Some of the increase in advanced imaging scans noted during the period examined is due to improved questionnaire design and editing procedures that better captured PET scans. In ED settings, data were collected on MRI and CT scans by using a checkbox. For more information, visit the Ambulatory Health Care Data website.
- National Survey of Ambulatory Surgery (NSAS) data were used to estimate ambulatory surgery visit rates. NSAS is a national survey of ambulatory surgical care in hospital-based and freestanding ambulatory surgery centers. NSAS was conducted from 1994 to 1996 and again in 2006. The 2006 survey included pain block locations, whereas the earlier surveys did not. Patient information is collected from medical records and includes diagnoses and up to six procedures performed during the visit. The small number of persons who had an ambulatory surgery visit and were subsequently admitted to an inpatient facility were omitted from NSAS estimates to avoid potential double counting. For more information, visit the National Survey of Ambulatory Surgery website.
- National Health and Nutrition Examination Survey (NHANES) data were used to estimate the percentage of the population with prescription drug use in the past month. NHANES provides estimates of the health status of the civilian noninstitutionalized population of the United States. The survey includes clinical examinations, selected medical and laboratory tests, and self-reported data. For more information, visit the NHANES website.
Civilian population estimates from the U.S. Census Bureau were used to calculate inpatient hospitalization and ambulatory surgery visit rates. Civilian noninstitutionalized population estimates were used to calculate physician office, OPD, and ED visit rates.
Differences between subgroups were evaluated using the univariate t-statistic. All significance tests were two-sided, using p < 0.05 as the level of significance. All comparisons reported in the text are statistically significant unless otherwise indicated. Data analyses were performed using SAS version 9.1 (SAS Institute, Cary, N.C.) and SUDAAN version 9.0 (RTI, Research Triangle Park, N.C.).
About the authors
Virginia Freid and Amy Bernstein are with the Centers for Disease Control and Prevention’s National Center for Health Statistics, Office of Analysis and Epidemiology.
References
- National Center for Health Statistics. Health, United States, 2009: With special feature on medical technology. Hyattsville, MD. 2010.
- U.S. interim projections by age, sex, race, and Hispanic origin: 2000–2050 [online]. U.S. Census Bureau Population Projections.
- CDC/NCHS, National Health Interview Survey, unpublished analysis.
- Baim DS. Percutaneous coronary intervention. In: Fauci AS, Brauwald E, Kasper DL, et al., eds. Harrison’s Principles of Internal Medicine, 17th ed, ch 240. New York, NY: McGraw-Hill; 1544–8. 2008.
- Ellison EC, Carey LC. Lessons learned from the evolution of the laparoscopic revolution. Surg Clin North Am 88(5):927–41. 2008.
- Learmonth ID, Young C, Rorabeck C. The operation of the century: Total hip replacement. Lancet 370(9597):1508–19. 2007.
- Branson JJ, Goldstein WM. Primary total hip arthroplasty. AORN J 78(6):947–74. 2003.
- Decker SL, Schappert SM, Sisk JE. Use of medical care for chronic conditions. Health Aff (Millwood) 28(1):26–35. 2009.
Suggested Citation
Freid VM, Bernstein AB. Health care utilization among adults aged 55–64 years: How has it changed over the past 10 years? NCHS data brief, no 32. Hyattsville, MD: National Center for Health Statistics. 2010.
Copyright information
All material appearing in this report is in the public domain and may be reproduced or copied without permission; citation as to source, however, is appreciated.
National Center for Health Statistics
Edward J. Sondik, Ph.D., Director
Jennifer H. Madans, Ph.D., Associate Director for Science
Office of Analysis and Epidemiology
Linda T. Bilheimer, Ph.D., Director