Expected Source of Payment at Emergency Department Visits for Adults Aged 18–64 for the United States and in the Five Most Populous States, 2012
- Key findings
- What were the expected sources of payment for ED visits made by adults aged 18–64?
- Did the percentage of ED visits made by adults aged 18–64 with private insurance as the expected source of payment vary by state?
- Did the percentage of ED visits made by adults aged 18–64 with Medicaid as the expected source of payment vary by state?
- Did the percentage of ED visits made by adults aged 18–64 with no insurance as the expected source of payment vary by state
- Summary
- Definitions
- Data source and methods
- About the authors
- References
- Suggested citation
NCHS Data Brief No. 253, June 2016
PDF Version (342 KB)
Jill J. Ashman, Ph.D., Pinyao Rui, M.P.H., and Esther Hing, M.P.H.
Key findings
Data from the National Hospital Ambulatory Medical Care Survey, 2012
- In 2012, 33% of emergency department (ED) visits in the United States made by adults aged 18–64 had private insurance as the expected source of payment. This percentage was lower for Illinois than for the total United States.
- In 2012, 21% of ED visits made by adults aged 18–64 had Medicaid as the expected source of payment. This percentage varied across the five most populous states, ranging from 12% in Texas to 30% in New York.
- In 2012, 20% of ED visits in the United States were made by adults aged 18–64 with no insurance (self-pay, no charge, charity, or a combination of these types were the only reported expected sources of payment).This percentage varied across the five most populous states, ranging from 15% in New York to 28% in Texas.
Visits to the emergency department (ED) by U.S. adults aged 18–64 have remained stable at about 20% (1,2), but ED use may vary by the expected source of payment. This report includes estimates for the five most populous states (California, Florida, Illinois, New York, and Texas). In 2012, there were 130.9 million ED visits in the United States. The majority of these visits (63%) were made by adults aged 18–64 (3). Differences in ED visits made by adults aged 18–64 were examined by expected source of payment and state.
Keywords: health insurance, state estimates, National Hospital Ambulatory Medical Care Survey
What were the expected sources of payment for ED visits made by adults aged 18–64?
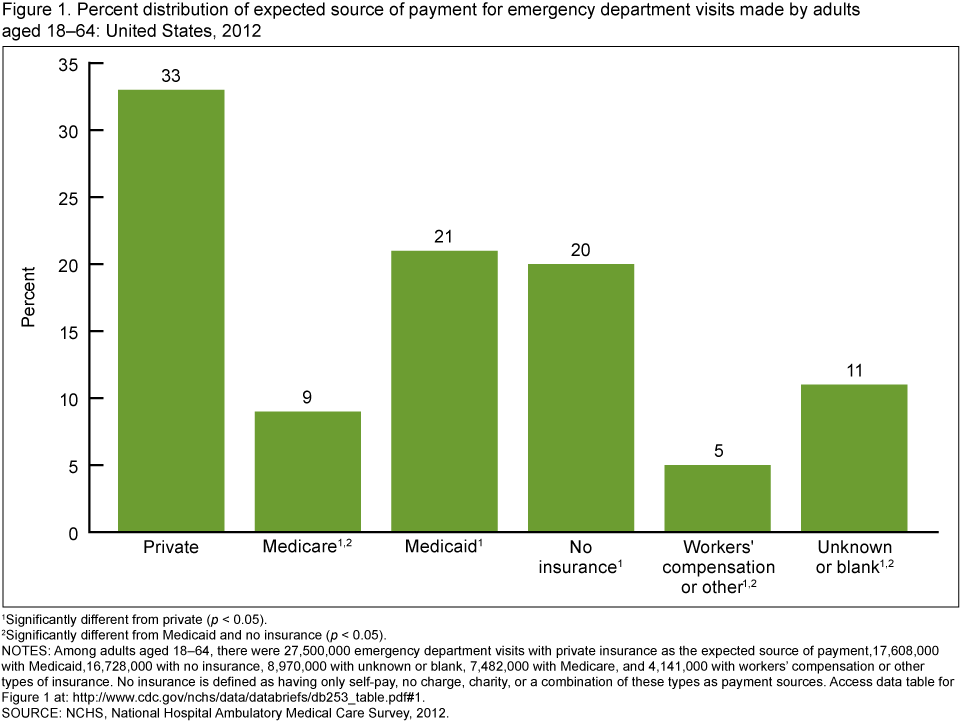
- In 2012, one-third of ED visits made by adults aged 18–64 in the United States had private insurance as the expected source of payment, which was higher than all other expected sources of payment (Figure 1).
- In 2012, one-fifth of ED visits made by adults aged 18–64 had Medicaid as the expected source of payment.
- In 2012, one-fifth of ED visits were made by adults aged 18–64 with no insurance (self-pay, no charge, charity, or a combination of these types were the only reported expected sources of payment).
- A higher percentage of ED visits made by adults aged 18–64 had either Medicaid or no insurance as the expected source of payment compared with workers’ compensation or other types of insurance.
Figure 1. Percent distribution of expected source of payment for emergency department visits made by adults aged 18–64: United States, 2012
1Significantly different from private (p < 0.05).
2Significantly different from Medicaid and no insurance (p < 0.05).
NOTES: Among adults aged 18–64, there were 27,500,000 emergency department visits with private insurance as the expected source of payment,17,608,000 with Medicaid,16,728,000 with no insurance, 8,970,000 with unknown or blank, 7,482,000 with Medicare, and 4,141,000 with workers’ compensation or other types of insurance. No insurance is defined as having only self-pay, no charge, charity, or a combination of these types as payment sources. Access data table for Figure 1.
SOURCE: NCHS, National Hospital Ambulatory Medical Care Survey, 2012.
Did the percentage of ED visits made by adults aged 18–64 with private insurance as the expected source of payment vary by state?
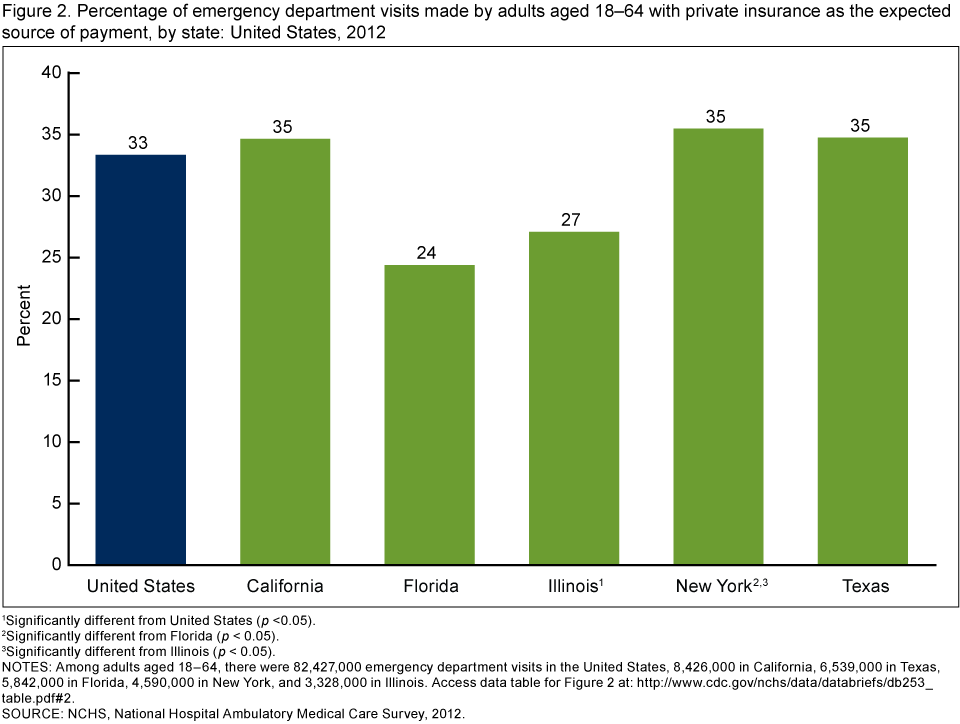
- Twenty-seven percent of ED visits made by adults aged 18–64 in Illinois had private insurance as the expected source of payment, which was lower than the percentage for the total United States (33%) (Figure 2).
- The observed percentage of ED visits made by adults aged 18–64 with private insurance as the expected source of payment was lower in Florida (24%) than for the total United States (33%), but the difference was not significant. However, the difference between the percentage in Florida and New York (35%) was significant.
- About 35% of ED visits made by adults aged 18–64 in New York had private insurance as the expected source of payment, which was higher than the percentage for Illinois (27%).
Figure 2. Percentage of emergency department visits made by adults aged 18–64 with private insurance as the expected source of payment, by state: United States, 2012
1Significantly different from United States (p <0.05).
2Significantly different from Florida (p < 0.05).
3Significantly different from Illinois (p < 0.05).
NOTES: Among adults aged 18–64, there were 82,427,000 emergency department visits in the United States, 8,426,000 in California, 6,539,000 in Texas, 5,842,000 in Florida, 4,590,000 in New York, and 3,328,000 in Illinois. Access data table for Figure 2.
SOURCE: NCHS, National Hospital Ambulatory Medical Care Survey, 2012.
Did the percentage of ED visits made by adults aged 18–64 with Medicaid as the expected source of payment vary by state?
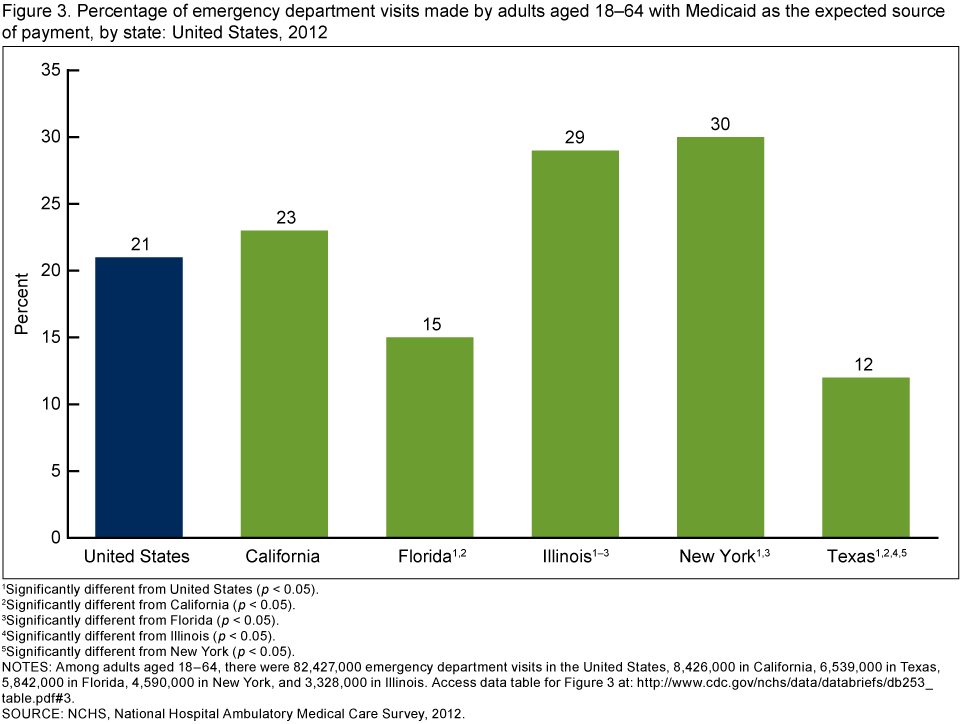
- The percentage of ED visits made by adults aged 18–64 with Medicaid as the expected source of payment varied across the five most populous states (Figure 3).
- In Illinois (29%) and New York (30%), the percentage of ED visits made by adults aged 18–64 with Medicaid as the expected source of payment was higher than the percentage for the total United States (21%).
- In Florida (15%) and Texas (12%), the percentage of ED visits made by adults aged 18–64 with Medicaid as the expected source of payment was lower than the percentage for the total United States (21%).
- In California (23%), Illinois (29%), and New York (30%), the percentage of ED visits made by adults aged 18–64 with Medicaid as the expected source of payment was higher than the percentage for both Florida (15%) and Texas (12%).
- In Illinois (29%), the percentage of ED visits made by adults aged 18–64 with Medicaid as the expected source of payment was higher than the percentage for California (23%).
Figure 3. Percentage of emergency department visits made by adults aged 18–64 with Medicaid as the expected source of payment, by state: United States, 2012
1Significantly different from United States (p < 0.05).
2Significantly different from California (p < 0.05).
3Significantly different from Florida (p < 0.05).
4Significantly different from Illinois (p < 0.05).
5Significantly different from New York (p < 0.05).
NOTES: Among adults aged 18–64, there were 82,427,000 emergency department visits in the United States, 8,426,000 in California, 6,539,000 in Texas, 5,842,000 in Florida, 4,590,000 in New York, and 3,328,000 in Illinois. Access data table for Figure 3.
SOURCE: NCHS, National Hospital Ambulatory Medical Care Survey, 2012.
Did the percentage of ED visits made by adults aged 18–64 with no insurance as the expected source of payment vary by state?
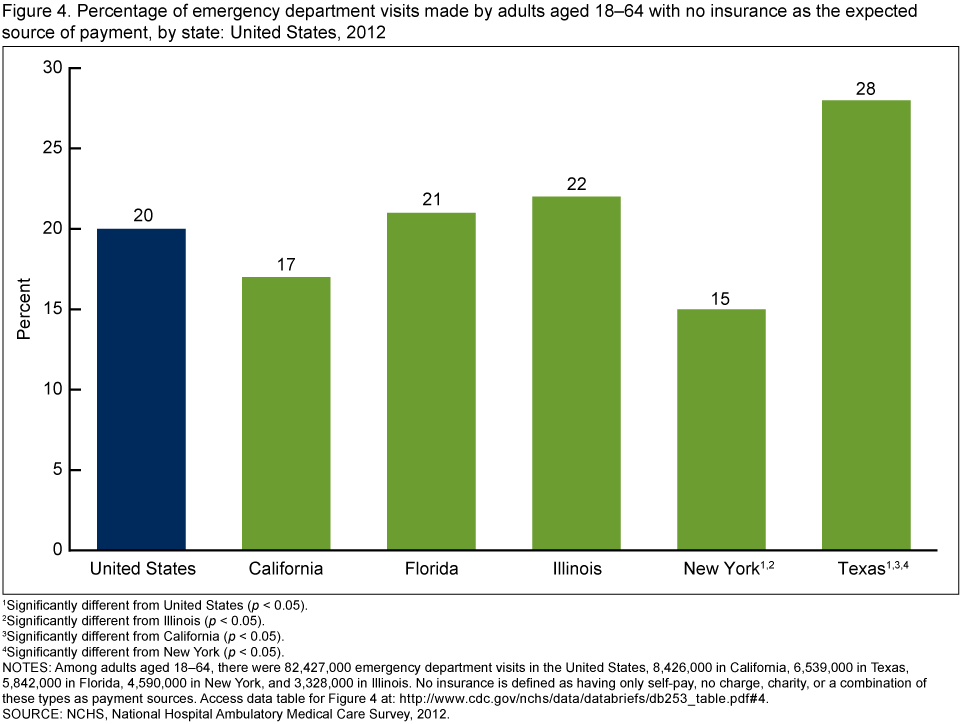
- The percentage of ED visits made by adults aged 18–64 with no insurance as the expected source of payment varied across the five most populous states (Figure 4).
- In New York (15%), the percentage of ED visits made by adults aged 18–64 with no insurance as the expected source of payment was lower than the percentage for the total United States (20%), Illinois (22%), and Texas (28%).
- In Texas (28%), the percentage of ED visits made by adults aged 18–64 with no insurance as the expected source of payment was higher than the percentage for the total United States (20%).
- In California (17%), the percentage of ED visits made by adults aged 18–64 with no insurance as the expected source of payment was lower than the percentage for Texas (28%).
Figure 4. Percentage of emergency department visits made by adults aged 18–64 with no insurance as the expected source of payment, by state: United States, 2012
1Significantly different from United States (p < 0.05).
2Significantly different from Illinois (p < 0.05).
3Significantly different from California (p < 0.05).
4Significantly different from New York (p < 0.05).
NOTES: Among adults aged 18–64, there were 82,427,000 emergency department visits in the United States, 8,426,000 in California, 6,539,000 in Texas, 5,842,000 in Florida, 4,590,000 in New York, and 3,328,000 in Illinois. No insurance is defined as having only self-pay, no charge, charity, or a combination of these types as payment sources. Access data table for Figure 4.
SOURCE: NCHS, National Hospital Ambulatory Medical Care Survey, 2012.
Summary
During 2012, an estimated 130.9 million visits were made to EDs in the United States (3). ED visits made by adults aged 18–64 accounted for 63% of all ED visits and are the focus of this report. In the United States, private insurance was the expected source of payment for one-third of all ED visits made by adults aged 18–64, which was higher than any other expected source of payment. Medicaid and no insurance were next, each accounting for about
one-fifth of all ED visits made by adults aged 18–64 in the United States.
About 27% of ED visits made by adults aged 18–64 in Illinois had private insurance as the expected source of payment, which was lower than the percentage for the total United States (33%) and New York (35%). A similar pattern was seen in Florida, but due to a small sample size, a statistically significant difference was not observed. In Illinois, a higher percentage of ED visits were made by adults aged 18–64 with Medicaid as the expected source of payment compared with the percentage for the total United States. However, unlike California and New York, Illinois did not have a correspondingly lower percentage of ED visits made by adults aged 18–64 with no insurance (self-pay, no charge, charity, or a combination of these types were the only reported expected sources of payment).
Use of EDs by adults aged 18–64 with Medicaid varied by state. In both California and New York, a higher percentage of visits to the ED were made by adults aged 18–64 with Medicaid as the expected source of payment compared with Florida and Texas, and a correspondingly lower percentage of visits to the ED were made by adults aged 18–64 with no insurance as the expected source of payment.
Use of EDs by adults aged 18–64 with no insurance (self-pay, no charge, charity, or a combination of these types were the only reported expected sources of payment) varied by state. In the United States, the percentage of ED visits made by adults aged 18–64 with no insurance was 20%. However, in Texas, 28% of adults aged 18–64 who visited the ED had no insurance. Since 1987, U.S. Census Bureau estimates have shown Texas to consistently have one of the highest rates of uninsured residents in the country (4). In contrast, 15% of adults aged 18–64 who visited the ED in New York had no insurance as the expected source of payment, which was lower than the national percentage.
Definitions
Expected source of payment for this visit: During data collection, all sources of payment were collected. These sources of payment were collapsed into one mutually exclusive variable (expected source of payment) that ranks payment sources based on the hierarchy shown below (5).
Private insurance: Charges paid in-part or in-full by a private insurer (e.g., BlueCross BlueShield), either directly to the physician and community health center (CHC) or reimbursed to the patient. Charges covered under a private insurance sponsored prepaid plan are included.
Medicare: Charges paid in-part or in-full by a Medicare plan. Includes payments made directly to the physician and CHC provider as well as payments reimbursed to the patient. Charges covered under a Medicare-sponsored prepaid plan are included.
Medicaid: Charges paid in-part or in-full by a Medicaid plan. Includes payments made directly to the physician and CHC provider as well as payments reimbursed to the patient. Charges covered under a Medicaid-sponsored prepaid plan are included.
Workers’ compensation and other: Includes programs designed to enable employees injured on the job to receive financial compensation, regardless of fault. For this report, “other” is also included in this category and includes any other source of payment not covered by the above categories, such as the Civilian Health and Medical Program of the Uniformed Services, state and local governments, private charitable organizations, and other liability insurance (e.g., automobile collision policy coverage).
No insurance: Includes self-pay and no charge or charity. Self-pay is charges that are paid by the patient or patient’s family, which will not be reimbursed by a third party. Self-pay includes visits for which the patient is expected to be ultimately responsible for most of the bill, even if the patient never actually pays it. This does not include copayments or deductibles. No charge or charity is visits for which no fee is charged (e.g., charity, special research, or teaching). No charge or charity does not include visits paid for as part of a total package (e.g., prepaid plan visits, postoperative visits included in a surgical fee, and pregnancy visits included in a flat fee charged for the entire pregnancy).
Unknown or blank: The primary source of payment is not known or all of the sources of payment listed above are left entirely blank.
Data source and methods
Data for this analysis are from the National Hospital Ambulatory Medical Care Survey (NHAMCS), an annual, nationally representative survey of nonfederal, general, and short-stay hospitals. NHAMCS is conducted by the National Center for Health Statistics and provides data on the utilization and provision of ambulatory care services in hospital EDs (5,6). NHAMCS uses a multistage probability design with samples of geographic primary sampling units (PSUs), hospitals within PSUs, and patient visits within EDs. The unweighted ED response rate was 76.3% (75.3% weighted). Additional information on the methodology of NHAMCS has been described previously (5,6).
The hospital location was used to generate state-level estimates.
Differences among subgroups were evaluated with one-tailed t tests, using p < 0.05 as the level of statistical significance. Terms relating to differences such as ‘‘higher’’ or ‘‘lower’’ indicate that the difference was statistically significant. Data analyses were performed using the statistical packages SAS version 9.3 (SAS Institute, Cary, N.C.) and SAS-callable SUDAAN version 11.0 (RTI International, Research Triangle Park, N.C.).
About the authors
Jill J. Ashman and Esther Hing are with the National Center for Health Statistics, Division of Health Care Statistics. Pinyao Rui is with Global Evaluation & Applied Research Solutions (GEARS), Inc.
References
- National Center for Health Statistics. Health, United States, 2012: With special feature on emergency care. Hyattsville, MD. 2013.
- Gindi RM, Black LI, Cohen RA. Reasons for emergency room use among U.S. adults aged 18–64: National Health Interview Survey, 2013 and 2014. National health statistics reports; no 90. Hyattsville, MD: National Center for Health Statistics. 2016.
- Hing E, Rui P. Emergency department use in the nation’s five most populous states and the total United States, 2012. NCHS data brief, no 252. Hyattsville, MD: National Center for Health Statistics. 2016.
- Baillargeon J, Paar D, Giordano TP, Zachariah B, Rudkin LL, Wu ZH, Raimer B. Emergency department usage by uninsured patients in Galveston County, Texas. Proc (Bayl Univ Med Cent) 21(3):236–242. 2008.
- National Center for Health Statistics. NHAMCS micro-data file documentation. 2012.
- National Center for Health Statistics. NHAMCS micro-data file. 2012.
Suggested citation
Ashman JJ, Rui P, Hing E. Expected source of payment at emergency department visits for adults aged 18–64 for the United States and in the five most populous states, 2012. NCHS data brief, no 253. Hyattsville, MD: National Center for Health Statistics. 2016.
Copyright information
All material appearing in this report is in the public domain and may be reproduced or copied without permission; citation as to source, however, is appreciated.
National Center for Health Statistics
Charles J. Rothwell, M.S., M.B.A., Director
Jennifer H. Madans, Ph.D., Associate Director for Science
Division of Health Care Statistics
Clarice Brown, M.S., Director
Alexander Strashny, Ph.D., Associate Director for Science