Mean Age of Mothers is on the Rise: United States, 2000–2014
- Key findings
- What are the recent trends in average age of mothers in the United States?
- How has the distribution of age at first birth changed?
- Does the average age of first-time mothers differ by race and Hispanic origin?
- Does average age of mother at first birth differ by geographic area over time?
- Summary
- Definitions
- Data source and methods
- About the authors
- References
- Suggested citation
NCHS Data Brief No. 232, January 2016
PDF Versionpdf icon (1.8 MB)
T.J. Mathews, M.S.; and Brady E. Hamilton, Ph.D.
Key findings
Data from the National Vital Statistics System
- The mean age of mothers has increased from 2000 to 2014 for all birth orders, with age at first birth having the largest increase, up from 24.9 years in 2000 to 26.3 years in 2014.
- Increases in the average age for all birth orders were most pronounced from 2009 to 2014.
- In 2014, Asian or Pacific Islander mothers had the oldest average age at first birth (29.5 years), while American Indian or Alaska Native mothers had the youngest (23.1 years).
- Mean age at first birth increased in all states and the District of Columbia (D.C.) from 2000 to 2014, but D.C. (3.4 years) and Oregon had the largest increases (2.1 years).
A mother’s age at birth, and particularly the mean or “average” age when a mother has her first child, is of interest to researchers and the public. Mean age can affect the total number of births a mother has over a lifetime, which in turn impacts the composition and growth of the U.S. population. Age of mother is associated with a range of birth outcomes, such as multiple births and birth defects. An earlier report presented trends in mean age from 1970 to 2000 (1). This report updates the earlier report and presents trends in the mean age at first and higher birth orders by race and Hispanic origin of mother and by state from 2000 to 2014 (1).
Keywords: maternal age, race and Hispanic origin, birth order, National Vital Statistics System (NVSS)
What are the recent trends in average age of mothers in the United States?
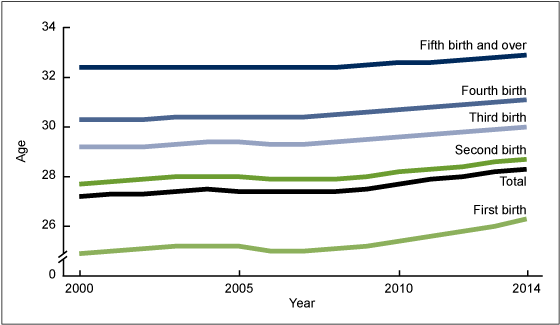
- The mean age of first-time mothers increased 1.4 years, from 24.9 in 2000 to 26.3 in 2014. While the mean age at first birth was fairly stable for the first half of this time period, greater increases were observed from 2009 (25.2 years) to 2014 (26.3 years) (Figure 1).
- Trends in mean age of mother for higher-order births were similar to those for first births—that is, generally stable from 2000 to 2006, followed by greater increases from 2009 to 2014.
- Increases from 2000 to 2014 in average age for higher birth orders were less than those for first births, rising 1.4 years for first births, 1.0 years for second births, 0.8 years for third- and fourth-order births, and 0.5 years for fifth- and higher-order births.
- As a result of the different rate of increases by birth order, the gap in the mean age between sequential birth orders has decreased. For example, the difference in the mean age at first birth compared with the mean age at second birth was 2.8 years in 2000 and 2.4 years in 2014.
Figure 1. Mean age, by birth order: United States, 2000–2014
SOURCE: CDC/NCHS, National Vital Statistics System.
How has the distribution of age at first birth changed?
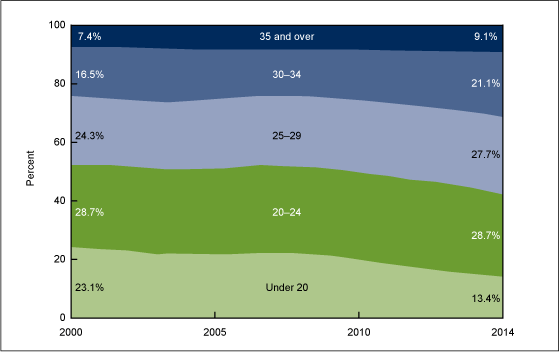
- The largest factor in the rise in mean age at first birth is the decline in the proportion of first births to mothers under age 20, down 42% from 2000 to 2014, or from approximately 1 in 4 births to 1 in 7 (Figure 2).
- From 2000 to 2014, the proportion of first births to women aged 30–34 rose 28% (from 16.5% to 21.1%), and first births to women aged 35 and over rose 23% (from 7.4% to 9.1%).
- The proportion of first births to mothers aged 20–24 was the same in 2000 and 2014, while the proportion of first births to mothers aged 25–29 increased 14%, from 24.3% in 2000 to 27.7% in 2014.
Figure 2. Percentage of first births, by age of mother: United States, 2000–2014
SOURCE: CDC/NCHS, National Vital Statistics System.
Does the average age of first-time mothers differ by race and Hispanic origin?
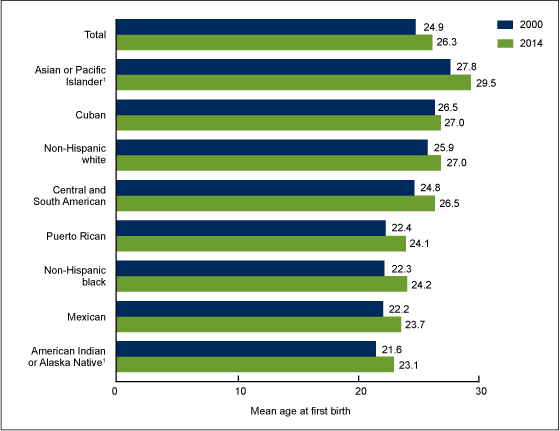
- The mean age at first birth increased for all race and Hispanic origin groups from 2000 to 2014. Increases ranged from 0.5 years for Cuban mothers to 1.9 years for non-Hispanic black mothers (Figure 3).
- Asian or Pacific Islander (API) mothers had the oldest average age at first birth in 2000 (27.8 years) and 2014 (29.5 years), while American Indian or Alaska Native (AIAN) women had the youngest average age at first birth (21.6 years in 2000 and 23.1 years in 2014). The difference in mean age at first birth among these groups was 6.4 years in 2014, up from 6.2 years in 2000.
- In 2014, the mean age at first birth for API (29.5 years), non-Hispanic white (27.0 years), Central and South American (26.5 years), and Cuban (27.0 years) mothers was higher than the average for all mothers (26.3 years). The mean age was lower than the average for Puerto Rican (24.1 years), non-Hispanic black (24.2 years), Mexican (23.7 years), and AIAN (23.1 years) mothers.
Figure 3. Mean age at first birth, by race and Hispanic origin of mother: United States, 2000 and 2014
1Includes persons of Hispanic and non-Hispanic origin.
SOURCE: CDC/NCHS, National Vital Statistics System.
Does average age of mother at first birth differ by geographic area over time?
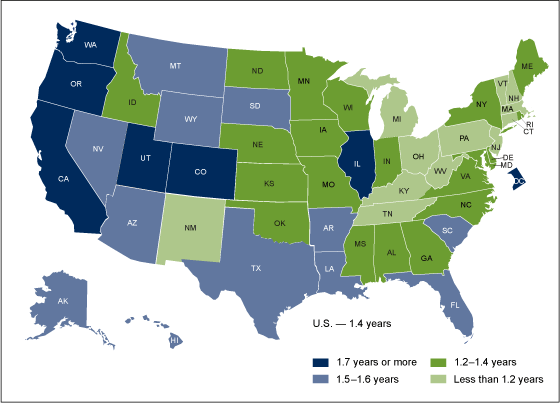
- The average age of first-time mothers increased for all states and the District of Columbia (D.C.) from 2000 to 2014. Increases ranged from 0.7 years for mothers in New Hampshire to more than three years for mothers in D.C. (Figure 4).
- States with larger increases (1.7 years or more) in the mean age at first birth tended to be in the western United States (California, Oregon, Washington, Utah, and Colorado). Greater increases were also seen in Illinois, Arkansas, and D.C.
- Apart from New Mexico, states with the smallest increases (less than 1.2 years) were all east of the Mississippi River, from Tennessee to New Hampshire.
Figure 4. Increase in mean age at first birth, by state: United States, 2000–2014
SOURCE: CDC/NCHS, National Vital Statistics System.
Summary
The average age of first-time mothers increased by 1.4 years from 2000 to 2014, with most of the increase occurring from 2009 to 2014. Trends were similar for higher birth orders with fairly stable mean ages occurring from 2000 to 2006, and greater increases occurring from 2009 to 2014. Since 2000, the mean age at first birth increased for all race and Hispanic origin groups, but large differences remained among the groups. AIAN mothers had the youngest mean age at first birth in 2014 and API mothers had the oldest.
Since 2000, the average age at first birth has increased in all states, rising 1.9 years or more in D.C., California, Oregon, and Utah, while increasing by less than a year in Connecticut, Michigan, New Hampshire, and West Virginia.
Continued delays in childbearing in the United States are evident in the 1.4 year increase in the average age of first births from 2000 to 2014 (2–5). The decrease in the proportion of first births to women under age 20 had the largest impact on this change, while increases in first births among mothers aged 30 and over also contributed to the increase in mean age.
Over the past several decades, the United States continued to have a larger number of first births to older women along with fewer births to mothers under age 20 (1,5). This trend and the more recent uptick in delayed initial childbearing can affect the number of children a typical woman will have in her lifetime, family size, and for the overall population change in the United States.
Definitions
Mean and average age: The arithmetic average of a mother’s age at birth.
First birth: The first child born alive to a mother.
Race and Hispanic origin: Race and Hispanic origin are reported separately on birth certificates. Persons of Hispanic origin may be of any race. Persons of non-Hispanic ancestry are further classified by race because there are substantial difference in fertility and maternal characteristics between Hispanic and non-Hispanic persons. Persons of AIAN and API ancestry are not classified separately by Hispanic origin because the majority of these persons are non-Hispanic. Multiple-race data reported since 2003 were bridged to single race categories for comparability among states and for trend analyses (2).
Data source and methods
This report contains data from the birth data set, which is part of the National Vital Statistics System (NVSS). NVSS contains all live births reported in the United States. The birth data set is the primary data set for analyzing birth trends and patterns in the United States. Birth data sets are available from NCHS at: National Vital Statistic System and NCHS VitalStats.
About the authors
T.J. Mathews and Brady Hamilton are with the CDC’s National Center for Health Statistics, Division of Vital Statistics, Reproductive Statistics Branch.
References
- Mathews TJ, Hamilton BE. Mean age of mother, 1970–2000. National vital statistics reports; vol 51 no 1. Hyattsville, MD: National Center for Health Statistics. 2002.
- Hamilton BE, Martin JA, Osterman MJK, et al. Births: Final data for 2014. National vital statistics reports; vol 64 no 12. Hyattsville, MD: National Center for Health Statistics. 2015.
- Ventura SJ, Hamilton BE, Mathews TJ. National and state patterns of teen births in the United States, 1940–2013. National vital statistics reports; vol 63 no 4. Hyattsville, MD: National Center for Health Statistics. 2014.
- Mathews TJ, Hamilton BE. First births to older women continue to rise. NCHS data brief, no 152. Hyattsville, MD: National Center for Health Statistics. 2014.
- Gregory E. Ready: Why women are embracing the new later motherhood. Basic Books. 2007.
Suggested citation
Mathews TJ, Hamilton BE. Mean age of mothers is on the rise: United States, 2000–2014. NCHS data brief, no 232. Hyattsville, MD: National Center for Health Statistics. 2016.
Copyright information
All materials appearing in this report is in the public domain and may be reproduced or copied without permission; citation as to source, however, is appreciated.
National Center for Health Statistics
Charles J. Rothwell, M.S., M.B.A., Director
Nathaniel Schenker, Ph.D., Deputy Director
Jennifer H. Madans, Ph.D., Associate Director for Science
Division of Vital Statistics
Delton Atkinson, M.P.H., M.P.H., P.M.P., Director
Hanyu Ni, Ph.D., M.P.H., Associate Director for Science


