Births in the United States, 2014
- Key findings
- The number of births per 1,000 women aged 15–44 (the GFR) increased slightly in 2014—the first increase since 2007.
- Birth rates for teenagers declined to historic lows in 2014 overall and for each race and Hispanic origin group.
- The cesarean delivery rate declined in 2014 for most race and Hispanic origin groups.
- Preterm birth rates declined for most race and Hispanic origin groups from 2007 to 2014.
- Summary
- Definitions
- Data sources and methods
- About the authors
- References
- Suggested citation
NCHS Data Brief No. 216, September 2015
PDF Version (488 KB)
Joyce A. Martin, M.P.H.; Brady E. Hamilton, Ph.D.; and Michelle J.K. Osterman, M.H.S.
Key findings
- The number of births per 1,000 women aged 15–44 (the general fertility rate) in the United States increased slightly in 2014, to 62.9—the first increase since 2007. Rates rose for non-Hispanic white and Asian or Pacific Islander women, but historic lows were observed for Hispanic women and American Indian or Alaska Native women.
- Teen childbearing in the United States in 2014 fell to another historic low of 24.2 per 1,000 females. Record lows were seen for each race and Hispanic origin group.
- The cesarean delivery rate declined to 32.2% of births in 2014, down 2% from the 2009 peak of 32.9%. Declines in rates were seen for most race and Hispanic origin groups for 2013–2014.
- The preterm birth rate fell slightly in 2014 to 9.57% of births, down 8% from the 2007 high. Preterm rates declined among most race and Hispanic origin groups during 2007–2014.
This report presents several key demographic and maternal and infant health indicators by race and Hispanic origin, using 2014 final birth data. Trends in general fertility rates (GFRs), teen birth rates, and cesarean delivery and preterm birth rates are explored by race and Hispanic origin group (non-Hispanic white, non-Hispanic black, Hispanic, American Indian or Alaska Native [AIAN], and Asian or Pacific Islander [API]), with special focus on the most current period, 2013–2014. An earlier report presented 2014 preliminary data on selected topics (1). Data are from the annual national natality files, representing 100% of births to U.S. residents.
Keywords: general fertility rate, teen childbearing, cesarean delivery, preterm births
The number of births per 1,000 women aged 15–44 (the GFR) increased slightly in 2014—the first increase since 2007.
- The U.S. GFR increased less than 1% from 2013 to 2014, from 62.5 to 62.9 births per 1,000 women aged 15–44 (Figure 1).
- The GFR declined steadily from 2007 through 2013, with the pace of decline slowing from 2010 through 2013.
- Rates were up 1% from 2013 to 2014 for non-Hispanic white women (59.5 per 1,000 in 2014) and 3% for API women (60.7).
- Fertility rates declined to record lows for Hispanic women (down 1% to 72.1 per 1,000) and AIAN women (down 3% to 44.8). The rate for non-Hispanic black women was essentially unchanged at 64.5.
Figure 1. General fertility rates, by race and Hispanic origin of mother: United States, 1990–2014
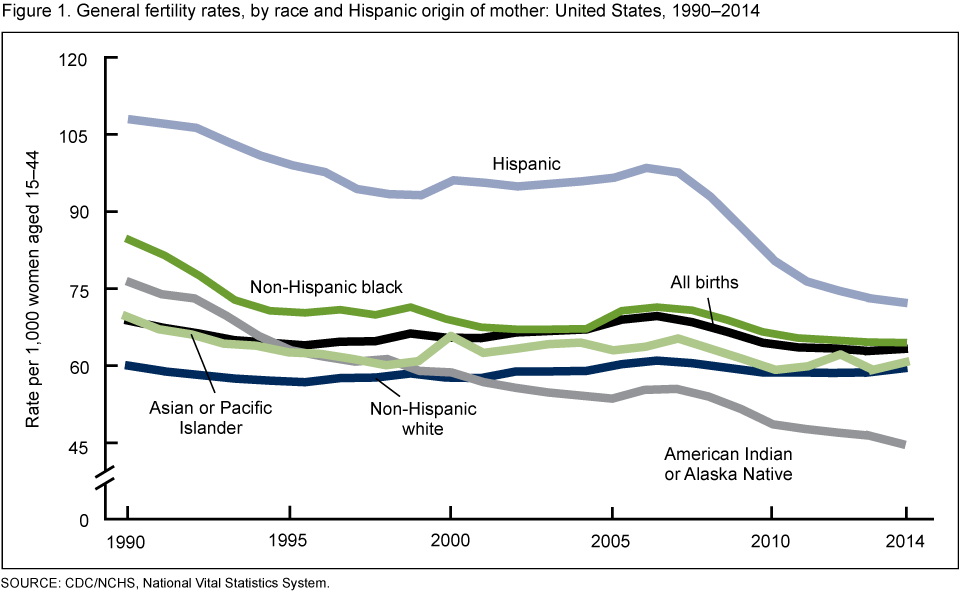
SOURCE: CDC/NCHS, National Vital Statistics System.
Birth rates for teenagers declined to historic lows in 2014 overall and for each race and Hispanic origin group.
- Birth rates for teenagers fell 9% from 2013 to 2014, to 24.2 births per 1,000 females aged 15–19, reaching yet another record low for the nation. The rate has declined 42% since 2007 (the most recent peak) and 61% since 1991 (Figure 2).
- Teen birth rates declined to record lows for all groups in 2014, down 7% for non-Hispanic white, 9% for Hispanic, 11% for non-Hispanic black and API, and 12% for AIAN females, compared with 2013.
- Birth rates among teenagers have declined for each race and Hispanic origin group over the last two decades, with declines ranging from 60% to 72% since 1991.
- In 2014, teen birth rates ranged from a low of 7.7 births per 1,000 for API females to a high of 38.0 for Hispanic females.
Figure 2. Birth rates for females aged 15–19, by race and Hispanic origin of mother: United States, 1991, 2007, 2013, and 2014
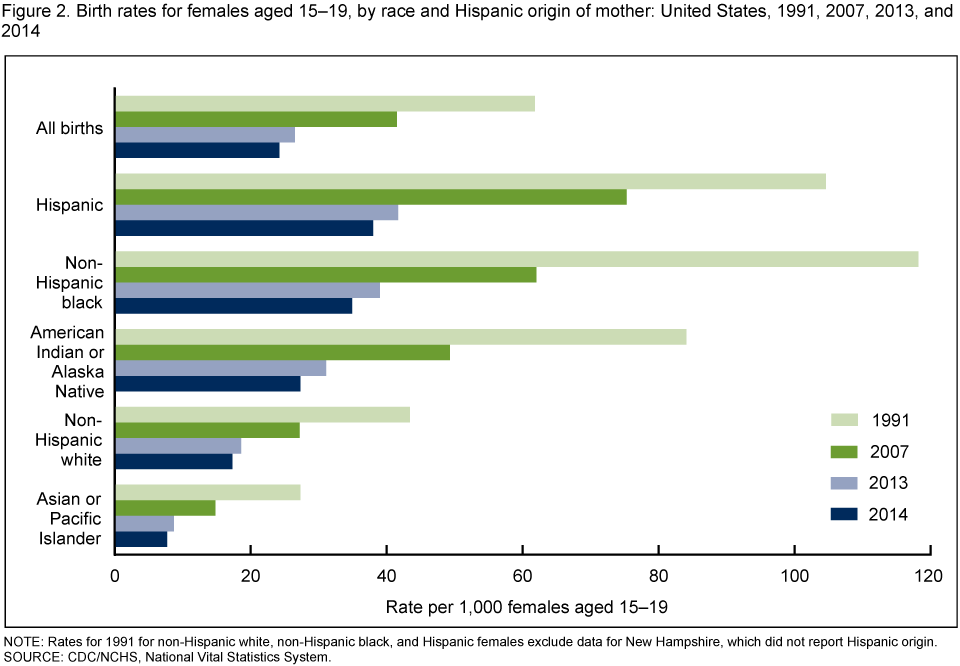
NOTE: Rates for 1991 for non-Hispanic white, non-Hispanic black, and Hispanic females exclude data for New Hampshire, which did not report Hispanic origin.
SOURCE: CDC/NCHS, National Vital Statistics System.
The cesarean delivery rate declined in 2014 for most race and Hispanic origin groups.
- The cesarean delivery rate declined in 2014 to 32.2% of all births, from 32.7% in 2013. The rate is down 2% from the 2009 peak of 32.9% (Figure 3).
- Cesarean delivery rates declined for nearly all race and Hispanic origin groups (non-Hispanic white, non-Hispanic black, Hispanic, and API) in 2014. The rate for non-Hispanic white women fell for the fifth consecutive year, to 31.4% in 2014, down 4% from the 2009 peak of 32.8%.
- Cesarean delivery rates declined in 2014 for the first year since 1996 for non-Hispanic black, Hispanic, and API women. From 2013 to 2014, the rate declined 1% for non-Hispanic black (from 35.8% to 35.6%), Hispanic (32.2% to 31.9%), and API women (33.5% to 33.1%). The rate for AIAN women was essentially unchanged (28.5% for 2014).
- Despite the declining cesarean delivery rates for most groups, differences between groups continue to grow due to the larger declines for non-Hispanic white women.
Figure 3. Cesarean delivery rates, by race and Hispanic origin of mother: United States, 2009, 2013, and 2014
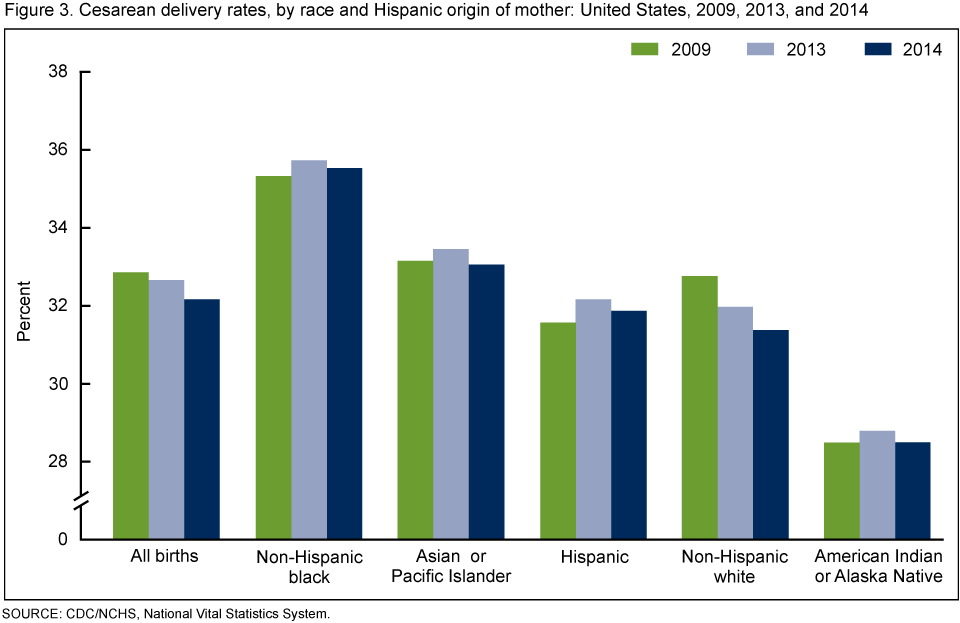
SOURCE: CDC/NCHS, National Vital Statistics System.
Preterm birth rates declined for most race and Hispanic origin groups from 2007 to 2014.
- The U.S. preterm birth rate declined again in 2014, to 9.57% of all births, from 9.62% in 2013. The percentage of infants born before 37 completed weeks of gestation is down 8% since 2007 (from 10.44%).
- The preterm birth rate for API infants declined 3% from 2013 through 2014 (from 8.68% to 8.45%); changes in rates for non-Hispanic white, non-Hispanic black, Hispanic, and AIAN infants were not statistically significant for this time period.
- Since 2007 (the first year for which national data based on the obstetric estimate of gestation [2] are available), preterm rates are down 11% for non-Hispanic white and non-Hispanic black infants, 8% for API infants, and 4% for Hispanic infants; a non-statistically significant decline was reported among AIAN births over this period (Figure 4).
- Large differences in preterm risk persist among the race and Hispanic origin groups. In 2014, non-Hispanic black infants were about 50% more likely to be born preterm than non-Hispanic white, Hispanic, and API infants.
Figure 4. Preterm birth rates, by race and Hispanic origin of mother: United States, 2007–2014
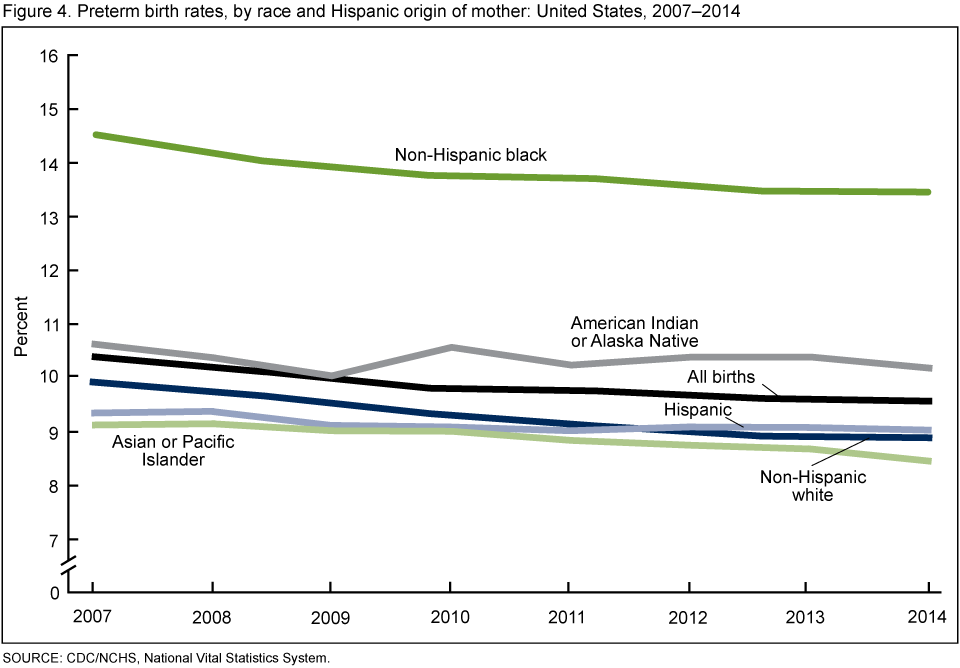
SOURCE: CDC/NCHS, National Vital Statistics System.
Summary
For the first year since 2007, childbearing rose in the United States in 2014, albeit slightly. Trends differed by race and Hispanic origin, with the GFR up among non-Hispanic white and API women but down or unchanged among other groups for 2013–2014. Historical lows in teen childbearing were seen in the U.S. overall in 2014, and for each of the race and Hispanic origin groups. Following years of steady increases that totaled nearly 60% (3), the U.S. cesarean delivery rate declined for the second straight year. Cesarean delivery rates had been on the decline for several years for non-Hispanic white and API women, but 2014 marks the first year of decline in cesarean deliveries among non-Hispanic black and Hispanic women. Preterm birth rates continued to trend downward in 2014 (2), overall and among most race and Hispanic origin groups, but large differences among groups in the risk of preterm birth were observed. The forthcoming report, “Births: Final data for 2014” (4), will present more information on the topics addressed in this report and selected others.
Definitions
General fertility rate (GFR): Number of births per 1,000 women aged 15–44.
Teen birth rate: Number of births per 1,000 females aged 15–19.
Cesarean delivery rate: Number of births delivered by cesarean section per 100 births.
Preterm birth rate: Births delivered prior to 37 completed weeks of gestation per 100 births.
Data sources and methods
This report is based on data from the natality data file of the National Vital Statistics System, a collaboration among the vital statistics reporting areas and the Centers for Disease Control and Prevention’s (CDC) National Center for Health Statistics (NCHS). The vital statistics natality file is based on information derived from birth certificates and includes information for all births occurring in the United States. This data brief accompanies the release of the 2014 natality public use file (5). More detailed analysis of the topics presented in this report, plus many other topics such as births to unmarried women, prenatal care, tobacco use during pregnancy, source of payment for the delivery, pregnancy risk factors, maternal morbidity, and breastfeeding, is possible using the annual natality files (5).
References to increases or decreases in rates indicate that differences are statistically significant at the 0.05 level. Computations exclude records for which information is unknown.
About the authors
Joyce A. Martin, Brady E. Hamilton, and Michelle J.K. Osterman are with CDC’s National Center for Health Statistics, Division of Vital Statistics, Reproductive Statistics Branch.
References
- Hamilton BE, Martin JA, Osterman MJK, Curtin SC. Births: Preliminary data for 2014. National vital statistics reports; vol 64 no 6. Hyattsville, MD: National Center for Health Statistics. 2015.
- Martin JA, Osterman MJK, Kirmeyer SE, Gregory ECW. Measuring gestational age in vital statistics data: Transitioning to the obstetric estimate. National vital statistics reports; vol 64 no 5. Hyattsville, MD: National Center for Health Statistics. 2015.
- Martin JA, Hamilton BE, Osterman MJK, et al. Births: Final data for 2013. National vital statistics reports; vol 64 no 1. Hyattsville, MD: National Center for Health Statistics. 2015.
- Martin JA, Hamilton BE, Osterman MJK, et al. Births: Final data for 2014. National vital statistics reports. Hyattsville, MD: National Center for Health Statistics [forthcoming].
- National Center for Health Statistics. Vital statistics data available online: Natality public use file and CD–ROM. Hyattsville, MD: NCHS. Published annually.
Suggested citation
Martin JA, Hamilton BE, Osterman MJK. Births in the United States, 2014. NCHS data brief, no 216. Hyattsville, MD: National Center for Health Statistics. 2015.
Copyright information
All material appearing in this report is in the public domain and may be reproduced or copied without permission; citation as to source, however, is appreciated.
National Center for Health Statistics
Charles J. Rothwell, M.S., M.B.A., Director
Nathaniel Schenker, Ph.D., Deputy Director
Jennifer H. Madans, Ph.D., Associate Director for Science
Division of Vital Statistics
Delton Atkinson, M.P.H., M.P.H., P.M.P., Director
Hanyu Ni, Ph.D., M.P.H., Associate Director for Science