Prevalence of Obesity Among Children and Adolescents in the United States and Canada
- Key findings
- Have changes in obesity prevalence in the last 30 years been similar in Canada and the United States?
- Were differences by age seen in the prevalence of childhood obesity between Canada and the United States?
- Were differences by sex and age seen in the prevalence of childhood obesity between Canada and the United States?
- Were differences seen in the prevalence of childhood obesity among the non-Hispanic white population between Canada and the United States?
- Summary
- Definitions
- Data sources and methods
- About the authors
- References
- Suggested citation
NCHS Data Brief No. 211, August 2015
PDF Version (411 KB)
Margaret D. Carroll, M.S.P.H.; Tanya Navaneelan, M.Sc.; Shirley Bryan, Ph.D.; and Cynthia L. Ogden, Ph.D.
Key findings
- In the late 1970s, the prevalence of childhood obesity was the same in Canada and the United States, but recently the prevalence is 4.5 percentage points higher in the United States than in Canada.
- No change has been seen over the last decade in the prevalence of obesity among children and adolescents in Canada or the United States.
- The prevalence of obesity among children and adolescents aged 3–19 in Canada was lower (13.0%) than in the United States (17.5%) in recent years.
- There was no difference between Canada and the United States in the prevalence of obesity among children aged 3–6 years.
- In the non-Hispanic white population, the prevalence of obesity among girls was lower in Canada than in the United States, but there was no difference between the two countries among boys.
About one-quarter of Canadian adults and more than one-third of adults in the United States are obese (1). Obese children are at risk of becoming obese adults (2) and can experience immediate health consequences such as psychosocial stress, elevated blood pressure and cholesterol, and abnormal glucose tolerance (3). Monitoring trends in childhood obesity is important in order to assess interventions aimed at reducing the burden of obesity.
Keywords: Canadian Health Measures Survey, body mass index, international comparison, National Health and Nutrition Examination Survey
Have changes in obesity prevalence in the last 30 years been similar in Canada and the United States?
During the late 1970s, there was no difference between Canada and the United States in the prevalence of childhood obesity (approximately 5% in both countries) (Figure 1). An increasing trend in childhood obesity has been seen in both countries, but the increase was greater in the United States. Beginning in the early part of the 21st century, the prevalence of childhood obesity was approximately 4 percentage points lower in Canada (12.4% in 2004; 13.0% in 2009–2013) than in the United States (16.6% in 2001–2004; 17.5% in 2009–2012), although there was no significant change between the two most recent time periods in either country.
Figure 1. Trends in childhood obesity among children and adolescents aged 3–19 in Canada and the United States
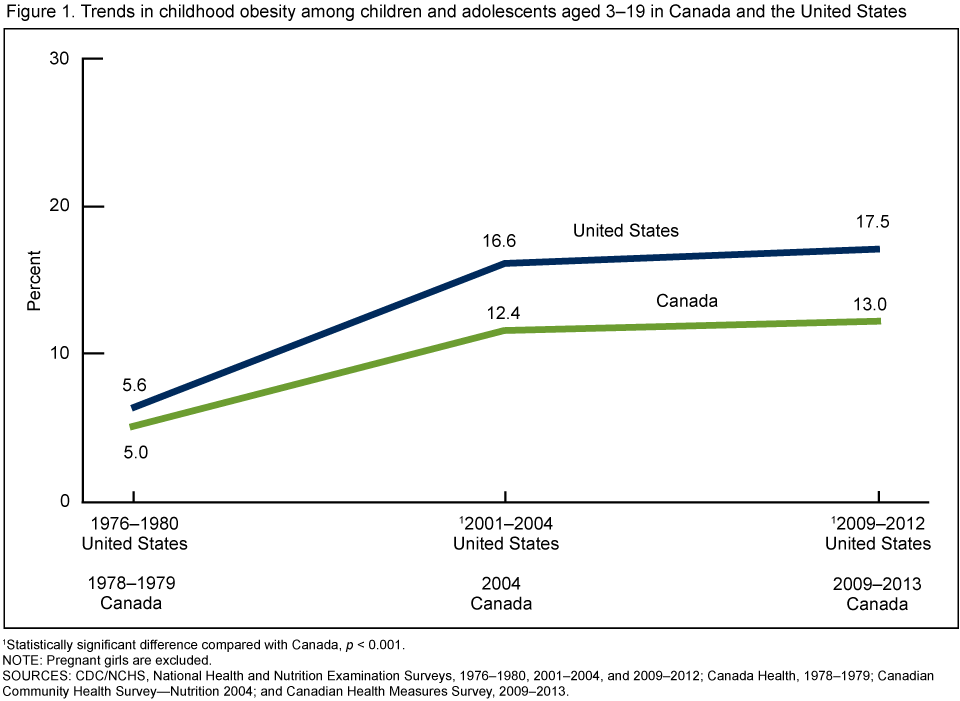
1Statistically significant difference compared with Canada, p < 0.001.
NOTE: Pregnant girls are excluded.
SOURCES: CDC/NCHS, National Health and Nutrition Examination Surveys, 1976–1980, 2001–2004, and 2009–2012; Canada Health, 1978–1979; Canadian Community Health Survey—Nutrition 2004; and Canadian Health Measures Survey, 2009–2013.
Were differences by age seen in the prevalence of childhood obesity between Canada and the United States?
Among children aged 7–12, the prevalence of obesity was more than 7 percentage points lower in Canada compared with the United States (11.8% in Canada and 19.2% in the United States) (Figure 2). For children aged 3–6 and adolescents aged 13–19, there were no significant differences in the prevalence of obesity in Canada and United States. For adolescents aged 13–19, the sample size may not have been large enough to detect a difference.
Figure 2. Childhood obesity among children and adolescents aged 3–19, by age: Canada, 2009–2013, and United States, 2009–2012
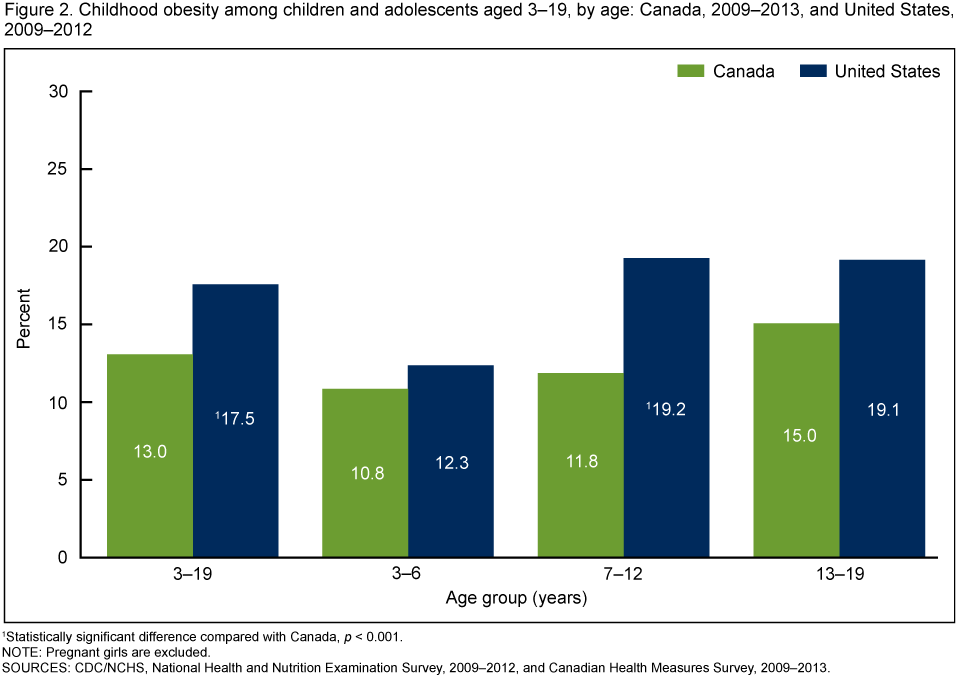
1Statistically significant difference compared with Canada, p < 0.001.
NOTE: Pregnant girls are excluded.
SOURCES: CDC/NCHS, National Health and Nutrition Examination Survey, 2009–2012, and Canadian Health Measures Survey, 2009–2013.
Were differences by sex and age seen in the prevalence of childhood obesity between Canada and the United States?
Overall, among children and adolescents aged 3–19, the prevalence of obesity among girls was significantly lower in Canada than in the United States (10.4% compared with 16.7%) but not for Canadian boys (Figure 3). Among the youngest children (3–6 years), there was no significant difference in obesity prevalence between Canada and the United States for either boys or girls.
Canadian boys (14.8%) and girls (8.7%) aged 7–12 had a lower prevalence of obesity than their U.S. counterparts (20.0% for boys, 18.5% for girls). Among adolescent boys aged 13–19, there was no significant difference in obesity prevalence, but among girls of this age group, the prevalence of obesity was lower in Canada (11.7%) than in the United States (18.3%).
Figure 3. Childhood obesity among children and adolescents aged 3–19, by sex and age: Canada, 2009–2013, and United States, 2009–2012
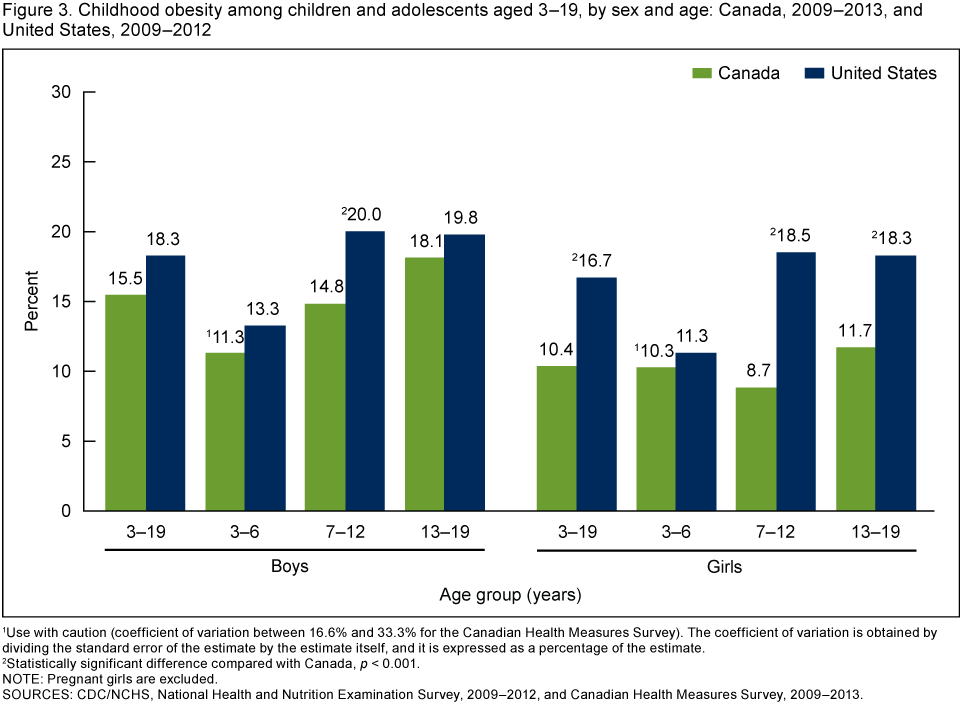
1Use with caution (coefficient of variation between 16.6% and 33.3% for the Canadian Health Measures Survey). The coefficient of variation is obtained by dividing the standard error of the estimate by the estimate itself, and it is expressed as a percentage of the estimate.
2Statistically significant difference compared with Canada, p < 0.001.
NOTE: Pregnant girls are excluded.
SOURCES: CDC/NCHS, National Health and Nutrition Examination Survey, 2009–2012, and Canadian Health Measures Survey, 2009–2013.
Were differences seen in the prevalence of childhood obesity among the non-Hispanic white population between Canada and the United States?
Among non-Hispanic white boys aged 3–19, there was no significant difference between Canada and the United States in the prevalence of obesity (Figure 4). Similar to the overall population, the prevalence of childhood obesity among non-Hispanic white girls was lower in Canada than in the United States (10.2% compared with 14.2%). But when stratified by age group, only Canadian girls aged 7–12 had a significantly lower prevalence of obesity than their U.S. counterparts (8.8% compared with 15.2%).
There was no difference in the prevalence of obesity between girls aged 3–6 in Canada and the United States and no significant difference for non-Hispanic white girls aged 13–19, which may be because the sample size was not large enough to detect a difference.
Figure 4. Childhood obesity among non-Hispanic white children and adolescents aged 3–19, by sex and age: Canada, 2009–2013, and United States, 2009–2012
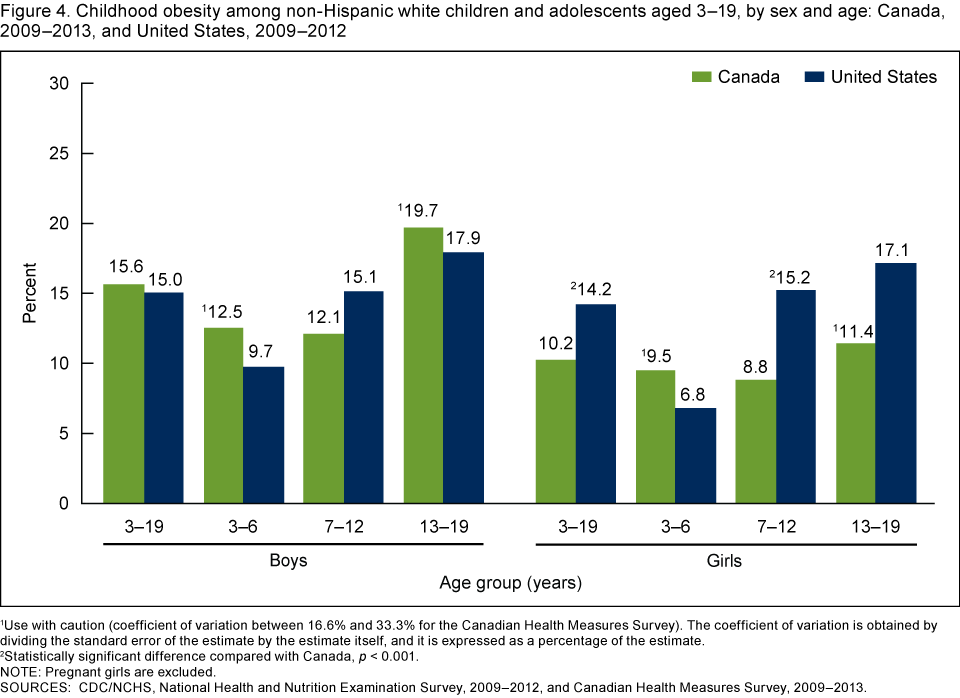
1Use with caution (coefficient of variation between 16.6% and 33.3% for the Canadian Health Measures Survey). The coefficient of variation is obtained by dividing the standard error of the estimate by the estimate itself, and it is expressed as a percentage of the estimate.
2Statistically significant difference compared with Canada, p < 0.001.
NOTE: Pregnant girls are excluded.
SOURCES: CDC/NCHS, National Health and Nutrition Examination Survey, 2009–2012, and Canadian Health Measures Survey, 2009–2013.
Summary
The prevalence of childhood obesity was lower in Canada than in the United States. This difference was particularly pronounced in girls compared with boys. In analysis restricted to the non-Hispanic white population, the prevalence of obesity among boys was virtually identical in Canada and the United States (15.6% compared with 15.0%). Among non-Hispanic white girls, however, just more than 10% of girls in Canada were obese compared with a little more than 14% in the United States.
Previous comparisons of childhood obesity in Canada, Mexico, and the United States through 2004 found similar changes in childhood obesity in each of the three countries (4). Although age, income, and education differed somewhat within each country, the prevalence had increased in all three countries.
Both Canada and the United States have seen increases in childhood obesity from 1980 to the beginning of the 21st century, and then no recent changes in prevalence. This plateau (or in some cases, a decrease) in childhood obesity prevalence has been reported in at least eight other countries (5). Similar to childhood obesity, the prevalence of obesity among adults increased in Canada and the United States from the late 1980s and early 1990s to the first decade of the 21st century (1).
Future data from the National Health and Nutrition Examination Survey (NHANES) and the Canadian Health Measures Survey (CHMS) will provide information on the direction of trends in obesity among youth in Canada and the United States.
Definitions
Body mass index (BMI): Weight in kilograms divided by height in meters squared, rounded to the nearest 10th.
Obesity: BMI at or above the sex-specific 95th percentile of BMI for age, based on the 2000 CDC (Centers for Disease Control and Prevention) Growth Charts.
Non-Hispanic white: In Canada, all respondents were asked the question: “People living in Canada come from many different cultural and racial backgrounds. Are you: white, Chinese, South Asian, Black, Filipino, Latin American, South East Asian, Arab, West Asian, Japanese, Korean, or Other?” Respondents could select more than one answer. Respondents who answered only white were used for the analysis on non-Hispanic white children and adolescents.
In the United States, non-Hispanic white was defined based on combining participant responses to questions on race and Hispanic origin. Participants were asked if they identified themselves as Hispanic and which of the following races they considered themselves (choosing one or more): American Indian or Alaska Native, Asian, black or African American, Native Hawaiian or Pacific Islander, white, or other. Respondents who answered only white and did not identify as Hispanic were considered non-Hispanic white.
Data sources and methods
Canadian estimates are based on data from three cross-sectional surveys: the 1978–1979 Canada Health Survey (CHS), the 2004 Canadian Community Health Survey–Nutrition (CCHS–Nutrition), and cycles 2 and 3 (2009–2013) of CHMS (6). These surveys were designed to provide nationally representative estimates of the Canadian noninstitutionalized population (7,8). In addition to an interview, these surveys included direct measurement of height and weight either at the home (CCHS and CHS) or in a mobile examination center (CHMS). Measured height and weight data for individuals aged 3–19 were available on 1,974 youths in CHS, 8,994 in CCHS–Nutrition, and 5,334 in CHMS.
United States estimates are based on data from three cycles of NHANES: NHANES II (1976–1980), NHANES 2001–2004, and NHANES 2009–2012. NHANES, conducted by the Centers for Disease Control and Prevention’s (CDC) National Center for Health Statistics (NCHS), is designed to monitor the health and nutritional status of the United States civilian noninstitutionalized population (9), using highly stratified multistage probability designs. The survey consists of interviews conducted in participants’ homes and standardized physical examinations conducted in mobile examination centers, including measured height and weight. Standardized measurements of height and weight for youth aged 3–19 were collected from 6,687 participants in NHANES II, 7,742 in NHANES 2001–2004, and 6,233 in NHANES 2009–2012.
For all surveys, sample weights—which account for the differential probabilities of selection, nonresponse, and noncoverage—are incorporated into the estimation process. For CHS, standard errors were estimated under the assumption of simple random sampling. For CCHS–Nutrition and CHMS, standard errors of the prevalence of obesity were estimated using the bootstrap method (10). For NHANES, standard errors were estimated by Taylor series linearization (10). Both the bootstrap and Taylor series linearization methods account for the design features of the survey. To compare the prevalence of obesity between Canada and the United States, statistical hypotheses were tested using Student’s t statistic and an α level of 0.05. All differences reported are statistically significant unless otherwise indicated. Linear trends in obesity prevalence over time were tested using orthogonal contrast matrices. Statistical analyses were conducted using SAS release 9.3 (SAS Institute, Inc., Cary, N.C.) and SUDAAN software version 11.0 (RTI International, Research Triangle Park, N.C.).
About the authors
Margaret D. Carroll is with CDC’s National Center for Health Statistics; Tanya Navaneelan and Shirley Bryan are with Statistics Canada; and Cynthia L. Ogden is with the National Center for Health Statistics.
References
- Shields M, Carroll MD, Ogden CL. Adult obesity prevalence in Canada and the United States. NCHS data brief, no 56. Hyattsville, MD: National Center for Health Statistics. 2011.
- Singh AS, Mulder C, Twisk JW, van Mechelen W, Chinapaw MJ. Tracking of childhood overweight into adulthood: A systematic review of the literature. Obes Rev 9(5):474–88. 2008.
- Barlow SE, Expert Committee. Expert Committee recommendations regarding the prevention, assessment, and treatment of child and adolescent overweight and obesity: Summary report. Pediatrics 120(Suppl 4)S164–92. 2007.
- Ogden CL, Connor Gorber S, Rivera Dommarco JA, Carroll M, Shields M, Flegal K. Chapter 5: The epidemiology of childhood obesity in Canada, Mexico and the United States. In: Moreno LA, Pigeot I, Ahrens W (editors). Epidemiology of obesity in children and adolescents: Prevalence and etiology. New York, NY: Springer Science+Business Media, LLC. 2011.
- Olds T, Maher C, Zumin S, Péneau S, Lioret S, Castetbon K, et al. Evidence that the prevalence of childhood overweight is plateauing: Data from nine countries. Int J Pediatr Obes 6(5–6):342–60. 2011.
- Statistics Canada. List of other Canadian Health Measures Survey (CHMS) documents available.
- Statistics Canada. Canadian Community Health Survey–Nutrition.
- Giroux S. Canadian Health Measures Survey: Sampling strategy overview. Health Rep 18(Suppl):31–6. 2007.
- NCHS. National Health and Nutrition Examination Survey: Questionnaires, datasets, and related documentation.
- Wolter KM. Introduction to variance estimation. 2nd ed. New York, NY: Springer Science+Business Media, LLC. 2007.
Suggested citation
Carroll MD, Navaneelan T, Bryan S, Ogden CL. Prevalence of obesity among children and adolescents in Canada and the United States. NCHS data brief, no 211. Hyattsville, MD: National Center for Health Statistics. 2015.
Copyright information
All material appearing in this report is in the public domain and may be reproduced or copied without permission; citation as to source, however, is appreciated.
National Center for Health Statistics
Charles J. Rothwell, M.S., M.B.A., Director
Nathaniel Schenker, Ph.D., Deputy Director
Jennifer H. Madans, Ph.D., Associate Director for Science
Division of Health and Nutrition Examination Surveys
Kathryn S. Porter, M.D., M.S., Director