Delayed Childbearing: More Women Are Having Their First Child Later in Life
- Key findings
- Are first-time mothers older?
- Does average age of mother at first birth differ by geographic area over time?
- Does the average age of first-time mothers differ by race and Hispanic origin?
- How does the United States compare with other countries in average age at first birth?
- Summary
- Definitions
- Data sources and methods
- About the authors
- References
- Suggested Citation
NCHS Data Brief No. 21, August 2009
PDF Versionpdf icon (701 KB)
T.J. Mathews, M.S., and Brady E. Hamilton, Ph.D.
Key findings
Data from the Birth Data File, National Vital Statistics System
- The average age of first-time mothers increased 3.6 years from 1970 to 2006, from 21.4 to 25.0 years.
- Increases in average age at first birth were more pronounced in the 1970s and 1980s.
- Average age at first birth increased in all states and the District of Columbia; the District of Columbia (5.5 years) and Massachusetts (5.2 years) had the largest increases since 1970.
- In 2006, Asian or Pacific Islander women had the oldest average age at first birth (28.5 years) and American Indian or Alaska Native women had the youngest (21.9 years).
- The average age at first birth has been increasing in many developed nations.
Of particular interest to both researchers and the public is the “average” age of women when they have a child, especially their first. Age at first birth influences the total number of births that a woman might have in her life, which impacts the size, composition, and future growth of the population. The age of the mother, both younger and older, plays a strong role in a wide range of birth outcomes (e.g., birthweight, multiple births, and birth defects), so it is critical to track the average age at which women have their first birth.
Keywords: average age, first birth, race and Hispanic origin, state-specific average age
Are first-time mothers older?
The average age of first-time mothers increased by 3.6 years, from 21.4 years in 1970 to 25.0 years in 2006. While the average age for first births increased from 1970 to 2006, the increases were more dramatic during the first two decades (1970 to 1990) (Figure 1).
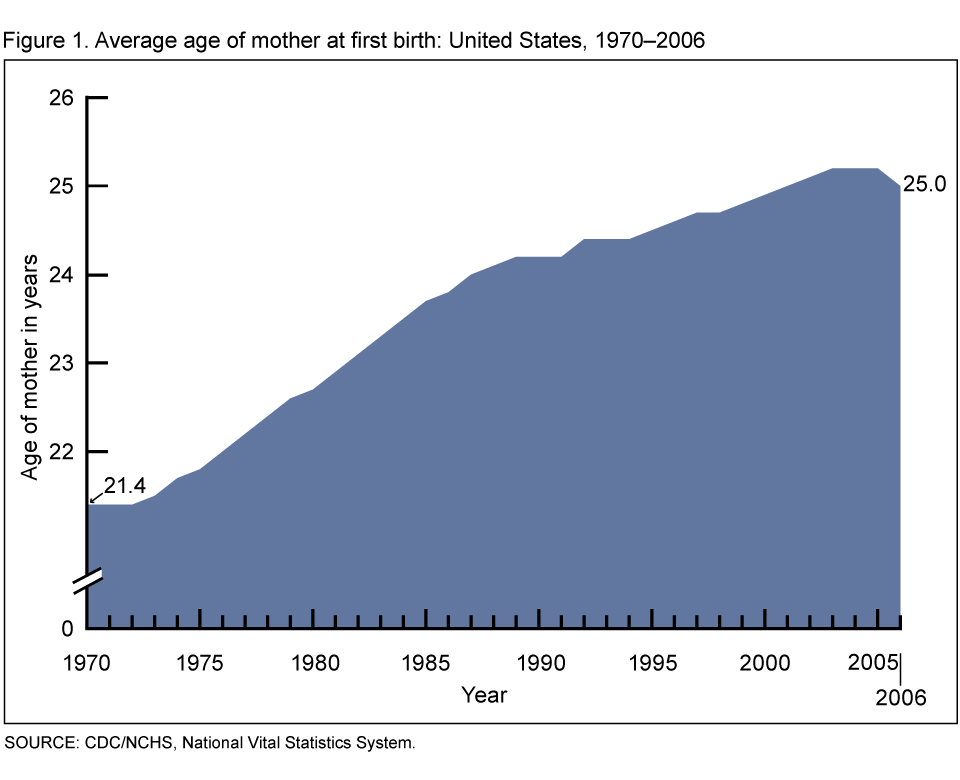 image icon
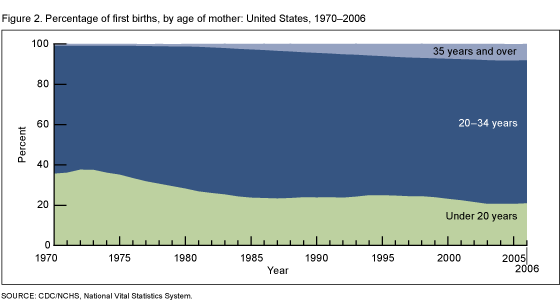
From 1970 to 2006 the proportion of first births to women aged 35 years and over increased nearly eight times (1,2). In 2006, about 1 out of 12 first births were to women aged 35 years and over compared with 1 out of 100 in 1970. According to preliminary data, the proportion for 2007 was the same as in 2006 (3). In 2006, only 21% of first births were to mothers under age 20, down from 36% in 1970 (Figure 2).
Does average age of mother at first birth differ by geographic area over time?
The average age of first-time mothers increased for all states and the District of Columbia between 1970 and 2006. The increases ranged from 2.0 years for women in New Mexico to over 5.0 years for women in the District of Columbia, New Hampshire, and Massachusetts (Figure 3).
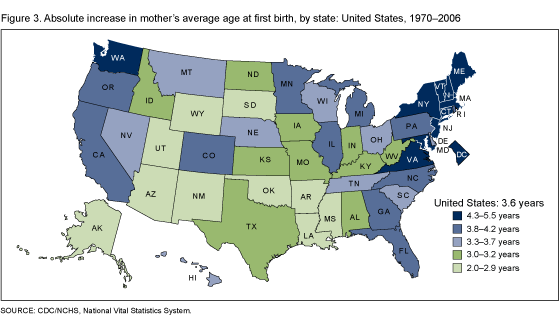
There are significant differences in average age at first birth among the states. In 1970, the average age at first birth was lowest in Arkansas (20.2 years) and highest in Connecticut, Massachusetts, and New York (22.5 years). In 2006, Massachusetts had the highest average age at first birth (27.7 years) and Mississippi had the lowest (22.6 years) (Table 1).
Table 1. Average age of mother at first birth, by state (1970 and 2006) and absolute change (1970-2006): United States and each state
[By place of residence]
| State | 1970 | 2006 | Absolute change, 1970-2006 |
|---|---|---|---|
| United States | 21.4 | 25.0 | 3.6 |
| Alabama | 20.5 | 23.6 | 3.1 |
| Alaska | 21.6 | 24.3 | 2.7 |
| Arizona | 21.2 | 24.0 | 2.8 |
| Arkansas | 20.2 | 23.0 | 2.8 |
| California | 21.8 | 25.6 | 3.8 |
| Colorado | 21.6 | 25.7 | 4.1 |
| Connecticut | 22.5 | 27.2 | 4.7 |
| Delaware | 21.4 | 25.0 | 3.6 |
| District of Columbia | 21.0 | 26.5 | 5.5 |
| Florida | 21.0 | 25.0 | 4.0 |
| Georgia | 20.7 | 24.5 | 3.8 |
| Hawaii | 22.4 | 25.7 | 3.3 |
| Idaho | 20.8 | 23.8 | 3.0 |
| Illinois | 21.5 | 25.4 | 3.9 |
| Indiana | 20.9 | 24.0 | 3.1 |
| Iowa | 21.3 | 24.5 | 3.2 |
| Kansas | 21.1 | 24.2 | 3.1 |
| Kentucky | 20.7 | 23.8 | 3.1 |
| Louisiana | 20.5 | 23.3 | 2.8 |
| Maine | 21.2 | 25.6 | 4.4 |
| Maryland | 21.6 | 26.1 | 4.5 |
| Massachusetts | 22.5 | 27.7 | 5.2 |
| Michigan | 21.2 | 25.0 | 3.8 |
| Minnesota | 22.0 | 25.8 | 3.8 |
| Mississippi | 20.3 | 22.6 | 2.3 |
| Missouri | 21.1 | 24.1 | 3.0 |
| Montana | 21.2 | 24.5 | 3.3 |
| Nebraska | 21.4 | 24.7 | 3.3 |
| Nevada | 21.3 | 24.6 | 3.3 |
| New Hampshire | 21.6 | 26.7 | 5.1 |
| New Jersey | 22.4 | 27.2 | 4.8 |
| New Mexico | 21.0 | 23.0 | 2.0 |
| New York | 22.5 | 26.8 | 4.3 |
| North Carolina | 20.8 | 24.6 | 3.8 |
| North Dakota | 21.5 | 24.7 | 3.2 |
| Ohio | 21.3 | 24.7 | 3.4 |
| Oklahoma | 20.7 | 23.1 | 2.4 |
| Oregon | 21.4 | 25.4 | 4.0 |
| Pennsylvania | 21.7 | 25.5 | 3.8 |
| Rhode Island | 22.1 | 26.2 | 4.1 |
| South Carolina | 20.6 | 24.0 | 3.4 |
| South Dakota | 21.1 | 24.0 | 2.9 |
| Tennessee | 20.7 | 24.0 | 3.3 |
| Texas | 20.9 | 23.9 | 3.0 |
| Utah | 21.4 | 23.9 | 2.5 |
| Vermont | 21.7 | 26.5 | 4.8 |
| Virginia | 21.4 | 25.8 | 4.4 |
| Washington | 21.5 | 25.9 | 4.4 |
| West Virginia | 20.8 | 23.9 | 3.1 |
| Wisconsin | 21.8 | 25.3 | 3.5 |
| Wyoming | 21.0 | 23.7 | 2.7 |
NOTE: Difference of averages was significant at p<0.05 for the United States and each state.
Does the average age of first-time mothers differ by race and Hispanic origin?
The average age at first birth increased for all racial and ethnic groups between 1990 and 2006 with increases ranging from 0.6 years for American Indian or Alaska Native (AIAN) women to 1.7 years for Asian or Pacific Islander (API) women.
In 2006, API women had the oldest average age at first birth (28.5 years), whereas AIAN women had the youngest (21.9 years); a difference of 6.6 years. The average age at first birth for non-Hispanic white women (26.0 years) was older than the average for the U.S. population (25.0 years) while those for non-Hispanic black (22.7 years) and Hispanic women (23.1 years) were younger (Figure 4).
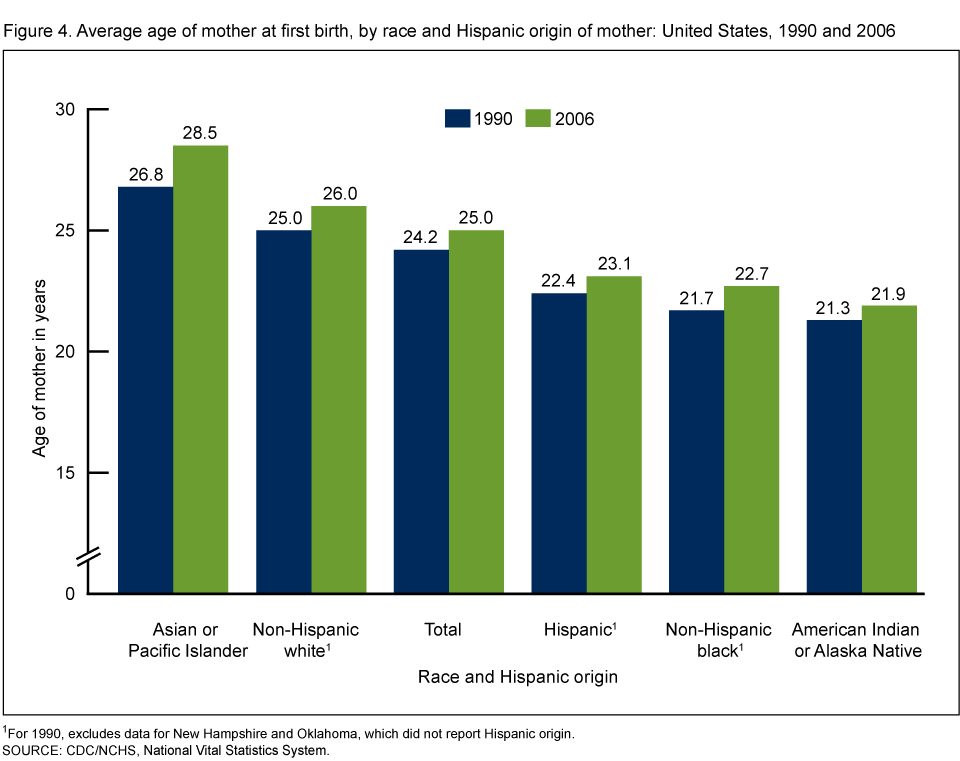 image icon
Variations among race and Hispanic origin groups within states tend to mirror these patterns with API women being the oldest first-time mothers, and AIAN women the youngest (access Table 2 online pdf icon[PDF – 23 KB]).
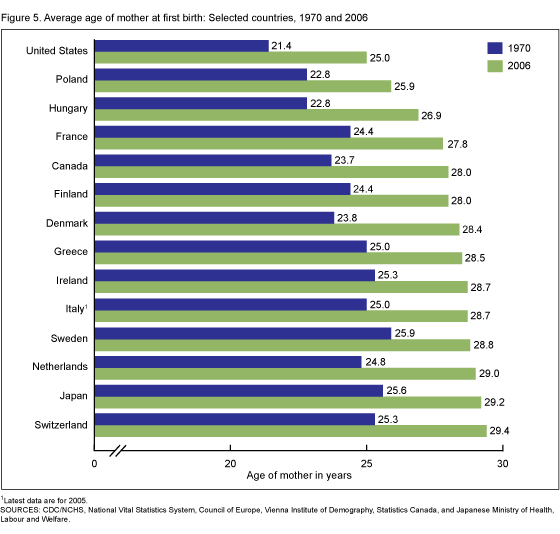
How does the United States compare with other countries in average age at first birth?
According to the latest data for selected countries, the average age at first birth in 2006 ranged from 25.0 years in the United States to 29.4 years in Switzerland. The average age at first birth has steadily increased among developed nations (1,4-6). All of the countries shown here had increases in average age at first birth since 1970, with a range of 2.9 years in Sweden to 4.6 years in Denmark. While the United States was in the middle of this range with a 3.6-year increase between 1970 (21.4 years) and 2006 (25.0 years), it had the youngest average age at first birth in both time periods for the nations shown (Figure 5).
Summary
Delayed childbearing in the United States is evident in the 3.6-year increase in the average age at first birth between 1970 and 2006 (2,7-9). The dramatic increase in women having their first birth at the age of 35 years and over has played the largest role in the increased average age of first-time mothers.
Since 1970, the average age at first birth has increased in all states, rising 5.0 years or more in the District of Columbia, Massachusetts, and New Hampshire, while increasing less than one-half that number in Mississippi, New Mexico, and Oklahoma.
Since 1990, there have been increases in average age at first birth for all racial and Hispanic origin groups but there remain large differences by race and ethnicity. In 1990 and 2006, AIAN women had the youngest average age at first birth; the average age at first birth was oldest for API women, followed by non-Hispanic white women.
Along with the United States, many other developed nations have observed increases in average age at first birth with some now averaging near 30.0 years of age. Increase in age at first birth, which affects the number of children a woman will have during her childbearing years, has important ramifications for family size and overall population change.
Definitions
Average age: The arithmetic mean of mother’s age at birth.
First birth: The first child born alive to a woman.
Race and Hispanic origin: Race and Hispanic origin are reported separately on birth certificates. Persons of Hispanic origin may be of any race. Persons of non-Hispanic ancestry are further classified by race because there are substantial differences in fertility and maternal characteristics between Hispanic and non-Hispanic persons. Persons of AIAN and API ancestry are not classified separately by Hispanic origin because the majority of these persons are non-Hispanic. Multiple-race data reported since 2003 were bridged to single-race categories for comparability among states and for trend analysis (1).
Data sources and methods
This report contains data from the birth data set, which is part of the National Vital Statistics System (NVSS). NVSS contains all live births reported in the United States. The birth data set is the primary data set for analyzing birth trends and patterns in the United States. Birth data sets are available from Vital Stats Online and VitalStats.
About the authors
T.J. Mathews and Brady E. Hamilton are with the Centers for Disease Control and Prevention’s National Center for Health Statistics, Division of Vital Statistics, Reproductive Statistics Branch.
References
- Martin JA, Hamilton BE, Sutton PD, et al. Births: Final data for 2006. National vital statistics reports; vol 57 no 7. Hyattsville, MD: National Center for Health Statistics. 2009.
- Mathews TJ, Hamilton BE. Mean age of mother, 1970-2000. National vital statistics reports; vol 51 no 1. Hyattsville, MD: National Center for Health Statistics. 2002.
- Hamilton BE, Martin JA, Ventura SJ. Births: Preliminary data for 2007. National vital statistics reports, Web release; vol 57 no 12. Hyattsville, MD: National Center for Health Statistics. Released March 18, 2009.
- Vienna Institute of Demography. European demographic data sheet 2008. pdf icon[PDF – 24 KB]external icon [Accessed 5/29/09].
- Statistics Canada. Report on the demographic situation in Canada, 2005 and 2006. pdf icon[PDF – 7 MB]external icon [Accessed 5/29/09].
- Gregory E. Ready: Why women are embracing the new later motherhood. Basic Books. 2007.
- Chandra A, Martinez GM, Mosher WD, et al. Fertility, family planning, and reproductive health of U.S. women: Data from the 2002 National Survey of Family Growth. National Center for Health Statistics. Vital Health Stat 23(25). 2005.
- Ventura SJ. Trends and variations in first births to older women 1970-86. National Center for Health Statistics. Vital Health Stat 21(47). 1989.
Suggested Citation
Mathews TJ, Hamilton BE. Delayed childbearing: More women are having their first child later in life. NCHS data brief, no 21. Hyattsville, MD: National Center for Health Statistics. 2009.
Copyright information
All material appearing in this report is in the public domain and may be reproduced or copied without permission; citation as to source, however, is appreciated.
National Center for Health Statistics
Director
Edward J. Sondik, Ph.D.
Acting Co-Deputy Directors
Jennifer H. Madans, Ph.D
Michael H. Sadagursky