Communication Disorders and Use of Intervention Services Among Children Aged 3–17 Years: United States, 2012
- Key findings
- What percentage of children aged 3–17 years had a communication disorder during the past 12 months?
- Among children with a communication disorder during the past 12 months, what proportion had multiple types of communication disorders?
- Did the percentage of children aged 3–17 years with any communication disorder during the past 12 months vary by race and Hispanic origin, sex, and age group?
- Among children aged 3–17 years with any communication disorder, what percentage received an intervention service during the past 12 months?
- Did the percentage of children aged 3–17 years who received an intervention service during the past 12 months for any communication disorder vary by race and Hispanic origin, sex, and age group?
- Summary
- Definitions
- Data source and methods
- About the authors
- References
- Suggested citation
NCHS Data Brief No. 205, June 2015
PDF Version (1.03 MB)
Lindsey I. Black, M.P.H.; Anjel Vahratian, Ph.D., M.P.H.; and Howard J. Hoffman, M.A.
Key findings
Data from the National Health Interview Survey, 2012
- Nearly 8% of children aged 3–17 years had a communication disorder during the past 12 months.
- Children aged 3–6 years, boys, and non-Hispanic black children were more likely than other children to have had any communication disorder.
- Approximately 55% of children aged 3–17 years who had any communication disorder received an intervention service during the past 12 months.
- Among those with any communication disorder, younger children, boys, and non-Hispanic white children were more likely than other children to receive an intervention service for their disorder.
Increasing the proportion of children with voice, swallowing, speech, or language disorders who receive intervention services is a Healthy People 2020 goal (1). Timely receipt of intervention services is shown to be effective for treatment of communication disorders (2–5). Using data from the 2012 National Health Interview Survey (NHIS), this brief reports the percentage of U.S. children aged 3–17 years who had communication disorders of speech, language, voice, or swallowing. Further, of those with a communication disorder, the percentage who received intervention services is also reported.
Keywords: speech, language, voice, National Health Interview Survey
What percentage of children aged 3–17 years had a communication disorder during the past 12 months?
In 2012, 7.7% of children aged 3–17 years had a communication disorder during the past 12 months (Figure 1). Speech problems were the most prevalent type of communication disorder (5.0%), while swallowing problems were the least prevalent (0.9%).
Figure 1. Percentage of children aged 3–17 years with a communication disorder during the past 12 months: United States, 2012
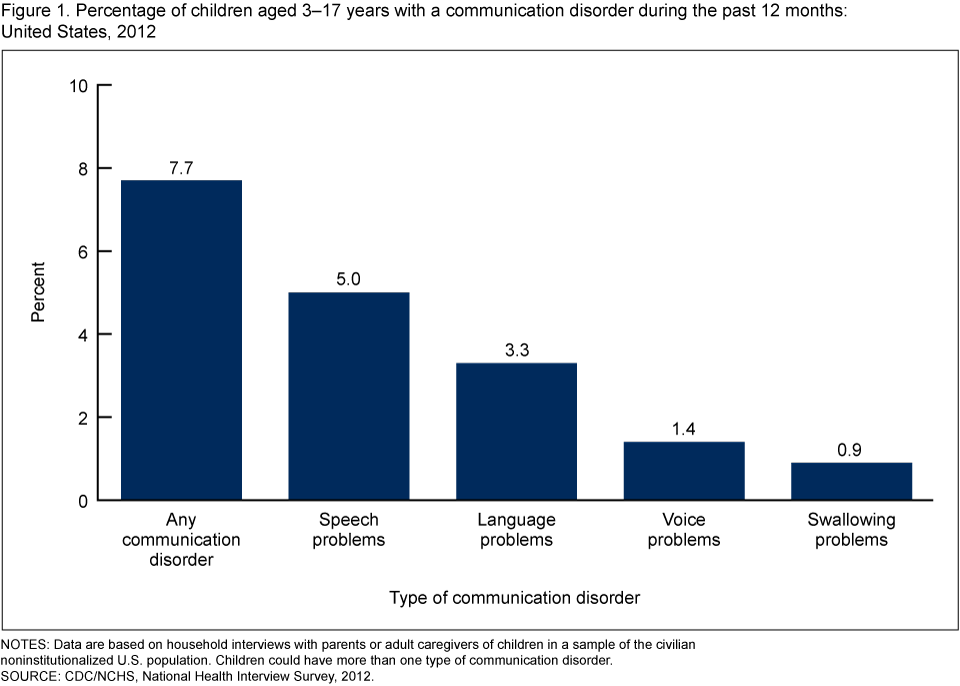
NOTES: Data are based on household interviews with parents or adult caregivers of children in a sample of the civilian noninstitutionalized U.S. population. Children could have more than one type of communication disorder.
SOURCE: CDC/NCHS, National Health Interview Survey, 2012.
Among children with a communication disorder during the past 12 months, what proportion had multiple types of communication disorders?
One-third of children aged 3–10 years with a communication disorder had more than one type of communication disorder during the past 12 months (Figure 2). In contrast, one-fourth of children aged 11–17 years with a communication disorder had more than one type of communication disorder during the past 12 months. Speech problems on their own were the most common individual type of communication disorder, with 41.8% of children aged 3–10 and 24.4% of children aged 11–17 affected. Among children aged 3–10, 13.6% had language problems, 6.3% had voice problems, and 4.3% had swallowing problems. Among children aged 11–17, 23.2% had language problems, 12.5% had voice problems, and 14.5% had swallowing problems.
Figure 2. Percent distribution of types of communication disorders among children aged 3–17 years with a communication disorder during the past 12 months, by age group: United States, 2012
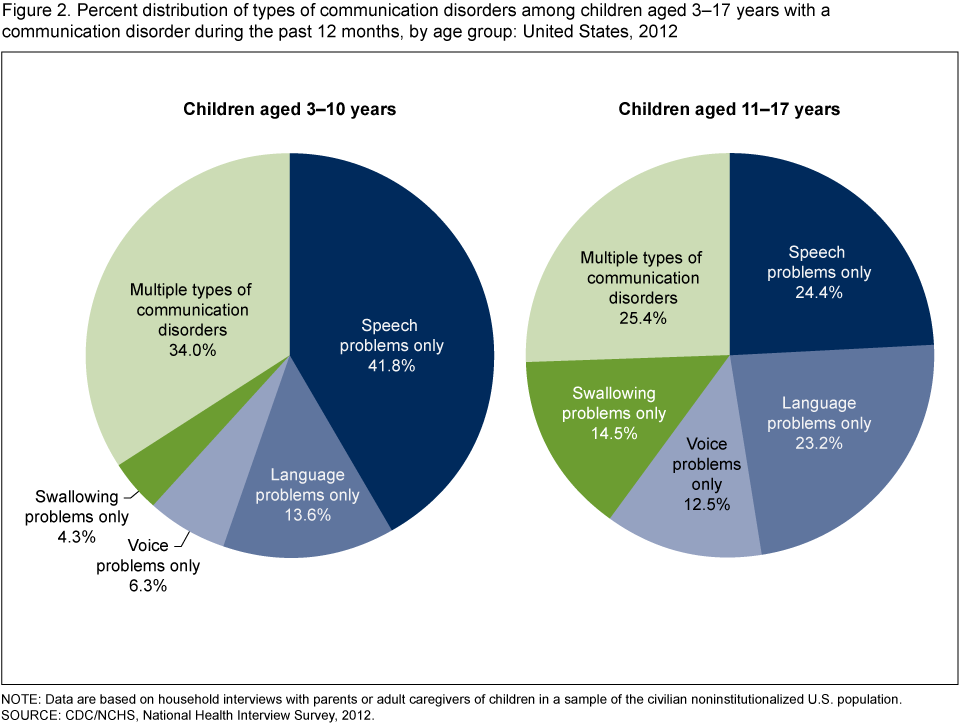
NOTE: Data are based on household interviews with parents or adult caregivers of children in a sample of the civilian noninstitutionalized U.S. population.
SOURCE: CDC/NCHS, National Health Interview Survey, 2012.
Did the percentage of children aged 3–17 years with any communication disorder during the past 12 months vary by race and Hispanic origin, sex, and age group?
The percentage of children aged 3–17 years with any communication disorder during the past 12 months was higher among non-Hispanic black children (9.6%) compared with Hispanic children (6.9%) (Figure 3). Boys (9.6%) were more likely than girls (5.7%) to have had any communication disorder during the past 12 months. Children aged 3–6 years (11.0%) and 7–10 years (9.3%) were more likely than children aged 11–17 years (4.9%) to have had any communication disorder in the past 12 months.
Figure 3. Percentage of children aged 3–17 years with any communication disorder during the past 12 months, by selected demographic characteristics: United States, 2012
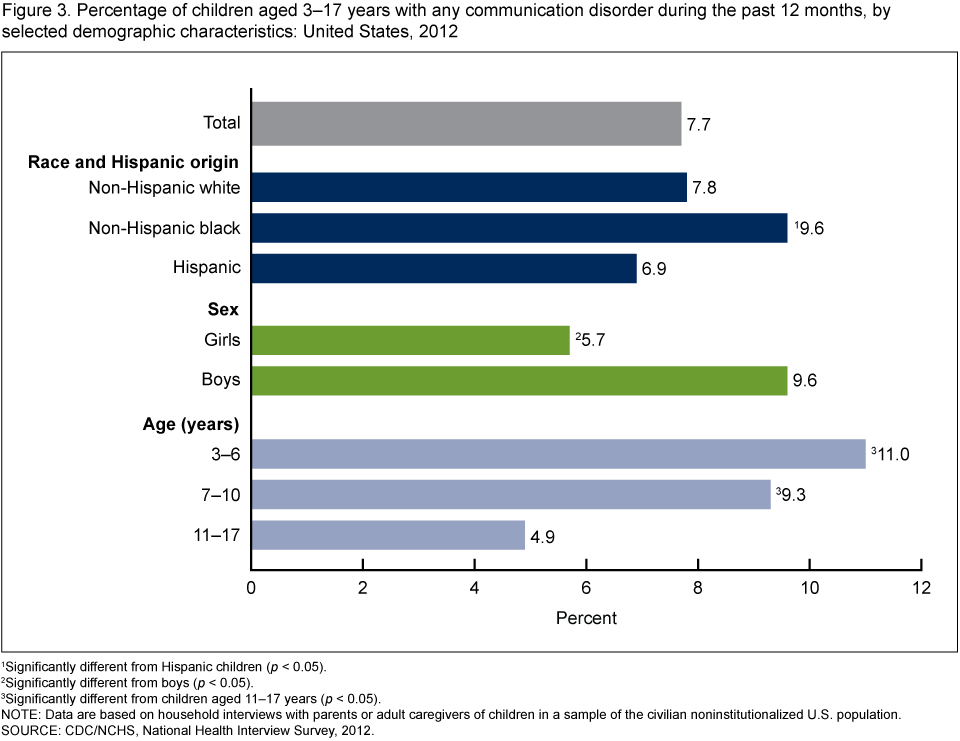
1Significantly different from Hispanic children (p < 0.05).
2Significantly different from boys (p < 0.05).
3Significantly different from children aged 11–17 years (p < 0.05).
NOTE: Data are based on household interviews with parents or adult caregivers of children in a sample of the civilian noninstitutionalized U.S. population.
SOURCE: CDC/NCHS, National Health Interview Survey, 2012.
Among children aged 3–17 years with any communication disorder, what percentage received an intervention service during the past 12 months?
Overall, 55.2% of children aged 3–17 years with any communication disorder received an intervention service in the past 12 months (Figure 4). Among children with speech problems, 67.6% received a speech problem intervention service. Among children with language problems, 66.8% received a language problem intervention service. About 23% of children with voice problems received a voice problem intervention service and about 13% of children with swallowing problems received a swallowing problem intervention service.
Figure 4. Percentage of children aged 3–17 years with any communication disorder who received an intervention service during the past 12 months, by type of communication disorder: United States, 2012

* Estimate has a relative standard error greater than 30% and less than or equal to 50% and should be used with caution as it does not meet NCHS standards of reliability or precision.
NOTE: Data are based on household interviews with parents or adult caregivers of children in a sample of the civilian noninstitutionalized U.S. population.
SOURCE: CDC/NCHS, National Health Interview Survey, 2012.
Did the percentage of children aged 3–17 years who received an intervention service during the past 12 months for any communication disorder vary by race and Hispanic origin, sex, and age group?
Among children with any communication disorder, the prevalence of receiving an intervention service for their disorder was highest among non-Hispanic white children (60.1%) compared with both non-Hispanic black (45.8%) and Hispanic children (47.3%) (Figure 5). Boys with any communication disorder (59.4%) were more likely than girls with any communication disorder (47.8%) to have received an intervention service for their disorder. Both children aged 3–6 years (59.8%) and 7–10 years (61.3%) with any communication disorder were more likely than those aged 11–17 years (42.6%) to have received an intervention service for their disorder.
Figure 5. Percentage of children aged 3–17 years with any communication disorder who received an intervention service during the past 12 months, by selected demographic characteristics: United States, 2012

1Significantly different from non-Hispanic white children (p < 0.05).
2Significantly different from boys (p < 0.05).
3Significantly different from children aged 11–17 years (p < 0.05).
NOTE: Data are based on household interviews with parents or adult caregivers of children in a sample of the civilian noninstitutionalized U.S. population.
SOURCE: CDC/NCHS, National Health Interview Survey, 2012.
Summary
In 2012, 7.7% of children aged 3–17 years had any communication disorder during the past 12 months. Speech and language problems were the most frequently reported communication disorders among this age group. Among those with any communication disorder, one-third of children aged 3–10 and one-quarter of children aged 11–17 had two or more disorders in the past 12 months. Communication disorders were more prevalent among non-Hispanic black children, boys, and younger children. Overall, more than one-half of children with any communication disorder received intervention services for their disorder during the past 12 months. Among those with any communication disorder, non-Hispanic black and Hispanic children were less likely than non-Hispanic white children to receive intervention services for their disorders. Girls were less likely than boys and older children were less likely than younger children to receive intervention services.
Increasing the proportion of children with voice, swallowing, speech, or language disorders who receive intervention services is a Healthy People 2020 goal (1). Using the most recent NHIS data available, this report provides a snapshot of the percentage of children aged 3–17 years in the United States who have a communication disorder and among those, who has received intervention services in the past 12 months. Ongoing surveillance may provide further insights into the health and wellbeing of this population.
Definitions
Speech problem: Based on a positive response to the question, “During the past 12 months, has [sample child] had a problem speaking, such as making speech sounds correctly or stuttering, that lasted for a week or longer?”
Language problem: Based on a positive response to the question, “During the past 12 months, has [sample child] had a problem learning, using, or understanding words or sentences that lasted for a week or longer?”
Voice problem: Based on a positive response to the question, “During the past 12 months, has [sample child] had any problems or difficulties with his/her voice, such as too weak, hoarse, or strained, that lasted for a week or longer?”
Swallowing problem: Based on a positive response to the question, “During the past 12 months, has [sample child] had a problem swallowing food or beverages that lasted for a week or longer?”
Communication disorder: Based on a positive response to at least one of the four problems listed above. Disorders were parent-reported and not necessarily diagnosed by a doctor or health care professional.
Receipt of intervention services: Respondents who indicated that the sample child had a speech, language, voice, or swallowing problem were then asked the following question separately for each type of communication disorder, “During the past 12 months, did [sample child] receive speech language therapy or other intervention services for his/her 1) voice problems; 2) problems swallowing, 3) speech problems; 4) using, learning, or understanding words or sentences; respectively?”
Data source and methods
This report is based on data from the 2012 NHIS, a nationally representative survey of the civilian noninstitutionalized population of the United States. NHIS is conducted continuously throughout the year for the Centers for Disease Control and Prevention’s (CDC) National Center for Health Statistics (NCHS) by the U.S. Census Bureau. Interviews are conducted in respondents’ homes, but follow-ups to complete interviews may be conducted over the telephone. Questions for this analysis are from the household composition section and the Sample Child components of the 2012 NHIS. A sample child is randomly selected from each family in NHIS, and information about the sample child is obtained from an adult residing in the household who is knowledgeable about the child’s health (usually the parent). Questions on communication disorders in children were from the 2012 child communication disorders (CCD) supplement embedded in the Sample Child component of the survey. The CCD supplement was developed and implemented with collaboration and funding support from the National Institutes of Health’s National Institute on Deafness and Other Communication Disorders.
NHIS is designed to yield a nationally representative sample, and this analysis used weights to produce national estimates. The sample design is described elsewhere (6). Point estimates and estimates of corresponding variance were calculated using the SUDAAN software package (7) to account for the complex sample design of NHIS. The Taylor linearization method was used for variance estimation. Unless otherwise noted, all estimates shown meet the NCHS standard for reliability (having a relative standard error less than or equal to 30%). Differences between percentages were evaluated using two-sided significance tests at the 0.05 level.
About the authors
Lindsey I. Black and Anjel Vahratian are with CDC’s National Center for Health Statistics, Division of Health Interview Statistics. Howard J. Hoffman is with the National Institutes of Health’s National Institute on Deafness and Other Communication Disorders, Division of Scientific Programs.
References
- HHS. Office of Disease Prevention and Health Promotion. Healthy People 2020. Washington, DC.
- Almost D, Rosenbaum P. Effectiveness of speech intervention for phonological disorders: A randomized controlled trial. Dev Med Child Neurol 40(5):319–25. 1998.
- Law J, Garrett Z, Nye C. The efficacy of treatment for children with developmental speech and language delay/disorder: A meta-analysis. J Speech Lang Hear Res 47(4):924–43. 2004.
- Beitchman JH, Wilson B, Johnson CJ, Atkinson L, Young A, Adlaf E, et al. Fourteen-year follow-up of speech/language-impaired and control children: Psychiatric outcome. J Am Acad Child Adolesc Psychiatry 40(1):75–82. 2001.
- Schwarz SM, Corredor J, Fisher-Medina J, Cohen J, Rabinowitz S. Diagnosis and treatment of feeding disorders in children with developmental disabilities. Pediatrics 108(3):671–6. 2001.
- Parsons VL, Moriarity C, Jonas K, et al. Design and estimation for the National Health Interview Survey, 2006–2015. National Center for Health Statistics. Vital Health Stat 2(165). 2014.
- RTI International. SUDAAN (Release 11.0.0) [computer software]. 2012.
Suggested citation
Black LI, Vahratian A, Hoffman HJ. Communication disorders and use of intervention services among children aged 3–17 years: United States, 2012. NCHS data brief, no 205. Hyattsville, MD: National Center for Health Statistics. 2015.
Copyright information
All material appearing in this report is in the public domain and may be reproduced or copied without permission; citation as to source, however, is appreciated.
National Center for Health Statistics
Charles J. Rothwell, M.S., M.B.A., Director
Nathaniel Schenker, Ph.D., Deputy Director
Jennifer H. Madans, Ph.D., Associate Director for Science
Division of Health Interview Statistics
Marcie L. Cynamon, Acting Director